English
Back
Open Account
The Fed raises interest rates for the first time in three years! How will the market react?

Option Mover The Moo
joined discussion ·

Options Income Strategy | US Treasury yields hit new highs, AI cloud leader NBIS falls below $200; how to capitalize on the high IV window?

1. NEBIUS: Rising macro hedging sentiment, AI cloud leader falls below $200
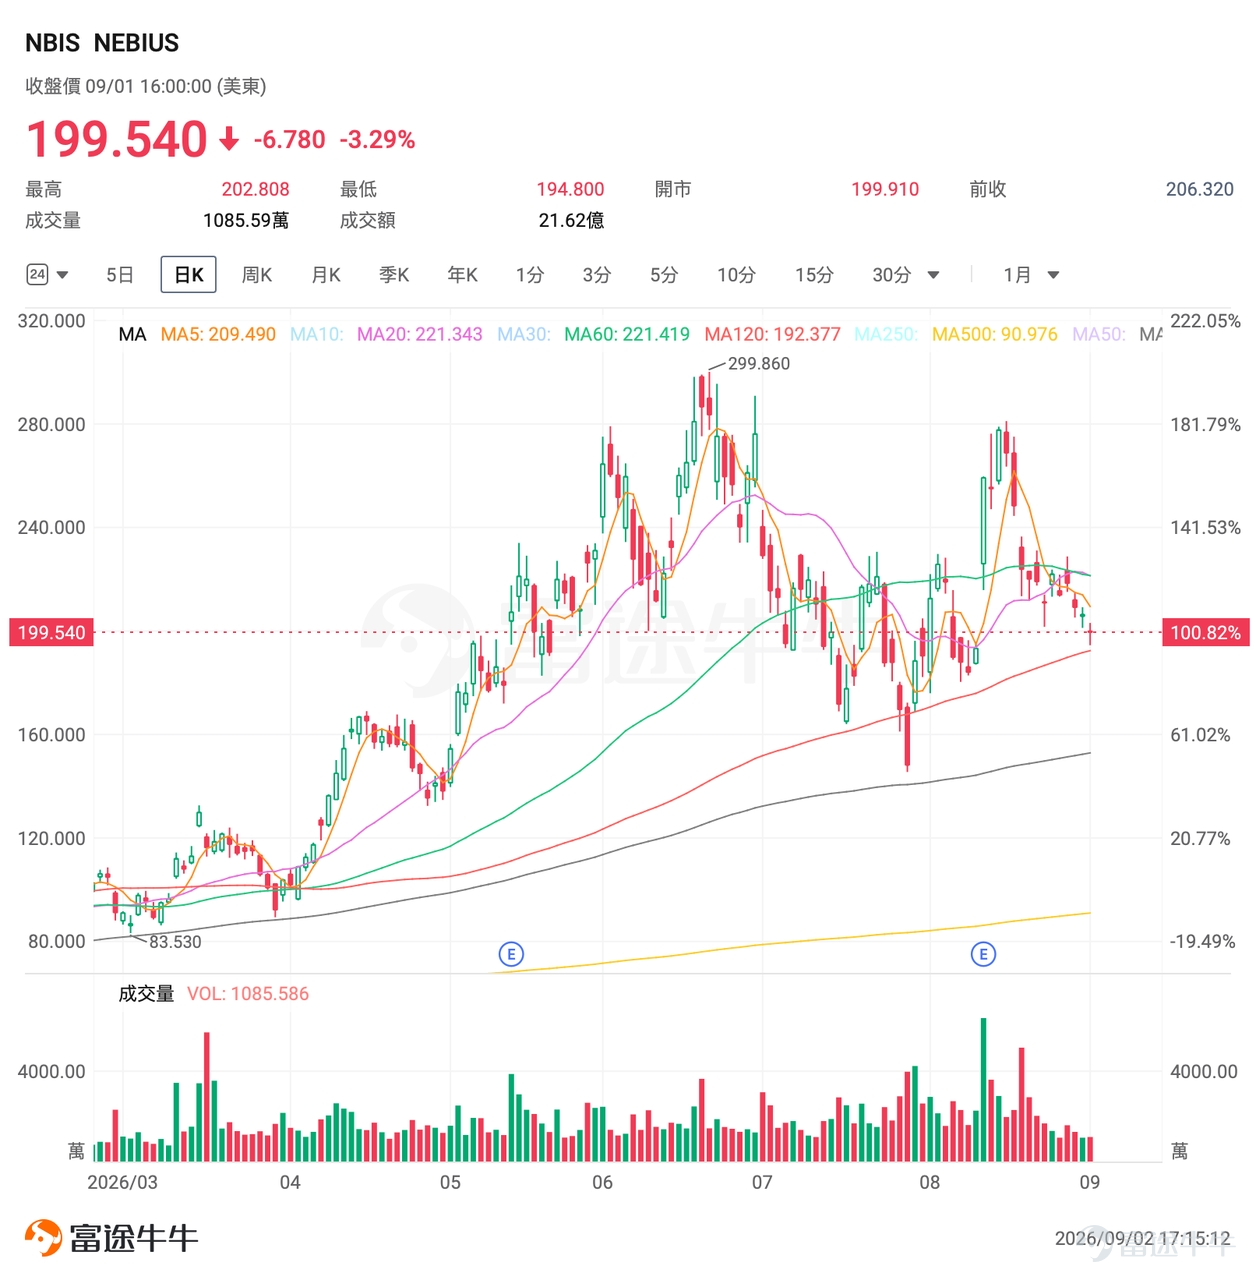
Tuesday $NEBIUS (NBIS.US)$ Closed down 3.29% at $199.54, breaking below the $200 psychological level; daily turnover reached $2.162 billion, with trading volume of 10.8559 million shares, a volume ratio of 0.842, and a turnover rate of 4.80%.
1. NEBIUS: Rising macro hedging sentiment, AI cloud leader falls below $200 Tuesday $NEBIUS (NBIS.US)$ Closed down 3.29% at $199.54, breaking below the $200 psychological level; daily turnover reached $2.162 billion, with trading volume of 10.8559 million shares, a volume ratio of 0.842, and a turnover rate of 4.80%. Technical Analysis: NBIS surged 34.14% in a single day on August 12, hitting $259.20, before entering a correction phase. It weakened overall from late August to early September, showing a short-term pattern of "spiking then falling back, breaking key integer levels." In terms of volume, the volume ratio was only 0.842 on September 1, indicating a significant contraction in trading activity compared to earlier periods. This suggests that downward momentum has not yet intensified, but the rebound also lacks supporting volume. News Analysis: This round of decline is primarily driven by a contraction in macro risk appetite. The core suppressing factor is the rise in US Treasury yields: the yield on the 10-year US Treasury note climbed to its highest level since January 2025. Coupled with Fed Chair Walsh's recent hawkish remarks, which led the market to increase bets on rate hikes, high-valuation tech stocks faced pressure first. Additionally, tensions between the US and Iran, along with attacks on oil tankers in the Strait of Hormuz, pushed up oil prices, further suppressing risk assets amid inflation concerns. Major Bank Views: Institutional ratings are predominantly Buy: 83.33% Buy, 16.67% Hold, and 0% Sell; the average target price is $307.67, with a range of $224–$410. Goldman Sachs, ...
Technical Analysis:
NBIS surged 34.14% in a single day on August 12, hitting $259.20, before entering a correction phase. It weakened overall from late August to early September, showing a short-term pattern of "spiking then falling back, breaking key integer levels." In terms of volume, the volume ratio was only 0.842 on September 1, indicating a significant contraction in trading activity compared to earlier periods. This suggests that downward momentum has not yet intensified, but the rebound also lacks supporting volume.
News Analysis:
This round of decline is primarily driven by a contraction in macro risk appetite. The core suppressing factor is the rise in US Treasury yields: the yield on the 10-year US Treasury note climbed to its highest level since January 2025. Coupled with Fed Chair Walsh's recent hawkish remarks, which led the market to increase bets on rate hikes, high-valuation tech stocks faced pressure first. Additionally, tensions between the US and Iran, along with attacks on oil tankers in the Strait of Hormuz, pushed up oil prices, further suppressing risk assets amid inflation concerns.
Major Bank Views:
Institutional ratings are predominantly Buy: 83.33% Buy, 16.67% Hold, and 0% Sell. The average target price is $307.67, with a range of $224–$410. Goldman Sachs and Citi maintain their Buy ratings, with target prices of $328 and $324, respectively.
2. Short Option Strategies
IV Analysis
Currently, $NEBIUS (NBIS.US)$ Implied volatility (IV) stands at approximately 81.28%; while the absolute level remains high, offering substantial premiums for sellers, the historical IV percentile is only 6.35%, and the IV Rank is around 13.92%. This indicates that option pricing has dropped significantly relative to the stock's previous extreme moves. Recent realized volatility is approximately 139%, with large intraday swings, so sellers need to manage position sizes carefully while collecting premiums.
1. NEBIUS: Rising macro hedging sentiment, AI cloud leader falls below $200 Tuesday $NEBIUS (NBIS.US)$ Closed down 3.29% at $199.54, breaking below the $200 psychological level; daily turnover reached $2.162 billion, with trading volume of 10.8559 million shares, a volume ratio of 0.842, and a turnover rate of 4.80%. Technical Analysis: NBIS surged 34.14% in a single day on August 12, hitting $259.20, before entering a correction phase. It weakened overall from late August to early September, showing a short-term pattern of "spiking then falling back, breaking key integer levels." In terms of volume, the volume ratio was only 0.842 on September 1, indicating a significant contraction in trading activity compared to earlier periods. This suggests that downward momentum has not yet intensified, but the rebound also lacks supporting volume. News Analysis: This round of decline is primarily driven by a contraction in macro risk appetite. The core suppressing factor is the rise in US Treasury yields: the yield on the 10-year US Treasury note climbed to its highest level since January 2025. Coupled with Fed Chair Walsh's recent hawkish remarks, which led the market to increase bets on rate hikes, high-valuation tech stocks faced pressure first. Additionally, tensions between the US and Iran, along with attacks on oil tankers in the Strait of Hormuz, pushed up oil prices, further suppressing risk assets amid inflation concerns. Major Bank Views: Institutional ratings are predominantly Buy: 83.33% Buy, 16.67% Hold, and 0% Sell; the average target price is $307.67, with a range of $224–$410. Goldman Sachs, ...
Cash Secured Put
Sell 1 contract of NBIS 2026-09-18 175.00 Put, and reserve sufficient cash for potential assignment.
1. NEBIUS: Rising macro hedging sentiment, AI cloud leader falls below $200 Tuesday $NEBIUS (NBIS.US)$ Closed down 3.29% at $199.54, breaking below the $200 psychological level; daily turnover reached $2.162 billion, with trading volume of 10.8559 million shares, a volume ratio of 0.842, and a turnover rate of 4.80%. Technical Analysis: NBIS surged 34.14% in a single day on August 12, hitting $259.20, before entering a correction phase. It weakened overall from late August to early September, showing a short-term pattern of "spiking then falling back, breaking key integer levels." In terms of volume, the volume ratio was only 0.842 on September 1, indicating a significant contraction in trading activity compared to earlier periods. This suggests that downward momentum has not yet intensified, but the rebound also lacks supporting volume. News Analysis: This round of decline is primarily driven by a contraction in macro risk appetite. The core suppressing factor is the rise in US Treasury yields: the yield on the 10-year US Treasury note climbed to its highest level since January 2025. Coupled with Fed Chair Walsh's recent hawkish remarks, which led the market to increase bets on rate hikes, high-valuation tech stocks faced pressure first. Additionally, tensions between the US and Iran, along with attacks on oil tankers in the Strait of Hormuz, pushed up oil prices, further suppressing risk assets amid inflation concerns. Major Bank Views: Institutional ratings are predominantly Buy: 83.33% Buy, 16.67% Hold, and 0% Sell; the average target price is $307.67, with a range of $224–$410. Goldman Sachs, ...
Opportunity screening logic:
For investors who are bullish on $NEBIUS (NBIS.US)$ the company, given the fundamental support from AI cloud revenue growth and sustained long-term prosperity, chasing highs in the short term carries significant pullback risks due to macro risk-off sentiment. Instead, consider selling out-of-the-money Puts to collect substantial premiums during consolidation. If the stock pulls back to near $175, you can acquire shares at a lower cost as planned.
Covered Call
Hold 100 shares $NEBIUS (NBIS.US)$At the same time, sell 1 contract of NBIS 2026-09-18 230.00 Call
1. NEBIUS: Rising macro hedging sentiment, AI cloud leader falls below $200 Tuesday $NEBIUS (NBIS.US)$ Closed down 3.29% at $199.54, breaking below the $200 psychological level; daily turnover reached $2.162 billion, with trading volume of 10.8559 million shares, a volume ratio of 0.842, and a turnover rate of 4.80%. Technical Analysis: NBIS surged 34.14% in a single day on August 12, hitting $259.20, before entering a correction phase. It weakened overall from late August to early September, showing a short-term pattern of "spiking then falling back, breaking key integer levels." In terms of volume, the volume ratio was only 0.842 on September 1, indicating a significant contraction in trading activity compared to earlier periods. This suggests that downward momentum has not yet intensified, but the rebound also lacks supporting volume. News Analysis: This round of decline is primarily driven by a contraction in macro risk appetite. The core suppressing factor is the rise in US Treasury yields: the yield on the 10-year US Treasury note climbed to its highest level since January 2025. Coupled with Fed Chair Walsh's recent hawkish remarks, which led the market to increase bets on rate hikes, high-valuation tech stocks faced pressure first. Additionally, tensions between the US and Iran, along with attacks on oil tankers in the Strait of Hormuz, pushed up oil prices, further suppressing risk assets amid inflation concerns. Major Bank Views: Institutional ratings are predominantly Buy: 83.33% Buy, 16.67% Hold, and 0% Sell; the average target price is $307.67, with a range of $224–$410. Goldman Sachs, ...
Opportunity screening logic:
Investors already holding the stock face short-term pressure from macro headwinds and technical breakdowns but may be reluctant to sell directly at low levels. They might consider selling out-of-the-money Calls to collect premiums and reduce their cost basis. If the stock rebounds above $230 and gets assigned, it effectively serves as taking partial profits near the target price.
3. Risk Control Notes
Although short-option strategies generally have a high probability of profit, investors must still implement sound risk management:
- Position management is core. The biggest risk for sellers lies in black swan events. It is recommended that margin usage for a single underlying asset should not exceed 20% of total capital. Do not sell options beyond your capacity to absorb losses just to chase premiums.
- Pay attention to rolling positions for Covered Calls. When a Covered Call is deep in-the-money, if you remain bullish on the underlying stock, consider buying back the current option to close the position while simultaneously selling options with a further expiration date and a higher strike price. This avoids having the underlying stock forced to be sold at a low price.
- Cash-Secured Puts require vigilance against left-tail risks. If the stock price drops significantly due to deteriorating fundamentals, do not mechanically hold on. Instead, cut losses or roll down positions based on your risk tolerance.
Make good use of the Option Seller Zone to understand income strategies for selling options,and earn option premiums!
Investors can openFutubull >> Market >> Options >> Seller Zone >> Filter, to filter for option underlyings that suit their risk appetite and investment needs.
The screening criteria for the option cases provided in this article are:
Stock Screening: Market Cap > $10 billion; IV > 70%; Total Option Volume > 60,000 contracts
Option Screening: Days to Expiration (DTE) 0-45 days; Probability of OTM > 70%; Return > 2%; Annualized Return > 30%; Volume > 100 contracts
Underlying Selection Rule: Sorted by probability, prioritizing underlying assets with higher probabilities. Probability refers to the likelihood that the sold option contract will not be exercised, i.e., the Out-of-the-Money (OTM) probability. A higher probability indicates a lower chance of being assigned, and thus a greater likelihood of securely collecting the option premium.
All data and information in the Option Seller Zone are for reference only and do not constitute any investment advice.
1. NEBIUS: Rising macro hedging sentiment, AI cloud leader falls below $200 Tuesday $NEBIUS (NBIS.US)$ Closed down 3.29% at $199.54, breaking below the $200 psychological level; daily turnover reached $2.162 billion, with trading volume of 10.8559 million shares, a volume ratio of 0.842, and a turnover rate of 4.80%. Technical Analysis: NBIS surged 34.14% in a single day on August 12, hitting $259.20, before entering a correction phase. It weakened overall from late August to early September, showing a short-term pattern of "spiking then falling back, breaking key integer levels." In terms of volume, the volume ratio was only 0.842 on September 1, indicating a significant contraction in trading activity compared to earlier periods. This suggests that downward momentum has not yet intensified, but the rebound also lacks supporting volume. News Analysis: This round of decline is primarily driven by a contraction in macro risk appetite. The core suppressing factor is the rise in US Treasury yields: the yield on the 10-year US Treasury note climbed to its highest level since January 2025. Coupled with Fed Chair Walsh's recent hawkish remarks, which led the market to increase bets on rate hikes, high-valuation tech stocks faced pressure first. Additionally, tensions between the US and Iran, along with attacks on oil tankers in the Strait of Hormuz, pushed up oil prices, further suppressing risk assets amid inflation concerns. Major Bank Views: Institutional ratings are predominantly Buy: 83.33% Buy, 16.67% Hold, and 0% Sell; the average target price is $307.67, with a range of $224–$410. Goldman Sachs, ...
This content is for reference only and should not be regarded or construed as an offer, solicitation, invitation, or recommendation to buy or sell any investment products, nor as a basis for investment decisions. It should not be interpreted as professional advice. Option contracts are derivative products and are not suitable for all investors. You should carefully assess whether you are suitable for participating in such trading based on your own investment experience, investment objectives, financial resources, and other relevant conditions.
The risk of loss in trading option contracts can be substantial. In certain circumstances, the losses you incur may exceed the initial margin deposited. Even if you have set contingency orders, such as "stop-loss" or "limit" orders, losses may not be avoided. Market conditions may prevent these orders from being executed. You may be required to deposit additional margin within a short period. If you fail to provide the required amount within the specified time, your open positions may be liquidated. However, you will still be liable for any deficit in your account resulting from this. Therefore, before trading, you should study and understand options, and carefully consider whether such trading is suitable for you based on your financial situation and investment objectives. If you trade options, you should be familiar with the procedures for exercising options and at expiration, as well as your rights and obligations upon exercise and at expiration. "Futubull" is a one-stop financial investment and trading platform, with securities services provided by Futu Securities International (Hong Kong) Limited.
Risk Disclaimer: The above content only represents the author's view. It does not represent any position or investment advice of Futu. Futu makes no representation or warranty.Read more
Thumbs Up
14
Lol
1
Heart
1
95K Views
Report
Comments
Write a Comment...
16
8