US Stock Market Talk | The Fed Resumes Rate Hikes After a Three-Year Pause! Is a New Shift Ahead for

NVIDIA halts its seven-day losing streak; can earnings become a turning point?
$NVIDIA (NVDA.US)$ After seven consecutive trading days of declines and a cumulative drawdown of approximately 7.4%, the stock halted its fall and closed higher yesterday. Global markets are holding their breath for its earnings release—NVIDIA's data center revenue has long served as a real-time indicator of global investment sentiment toward AI infrastructure:including the capital expenditure pace of hyperscale cloud providers, the shipment ramp-up of Blackwell, and the mass production timeline for the next-generation Vera Rubin.Preview of NVIDIA Earnings Highlights >>
Every figure will transcend NVIDIA itself, re-pricing the valuation anchor of the entire AI computing power supply chain and becoming a key variable influencing risk appetite in the US tech sector for the next phase. Below, we will analyze the latest price action structure and key levels from a technical perspective ahead of NVIDIA's earnings.
Recent stock price movement
![$NVIDIA (NVDA.US)$ After seven consecutive trading days of declines, with a cumulative drawdown of approximately 7.4%, the stock stabilized and closed higher yesterday. Global markets are holding their breath for its earnings release—NVIDIA's data center revenue has long served as a real-time indicator of global investment sentiment toward AI infrastructure:Including the capex pacing of hyperscale cloud providers, the shipment ramp-up slope of Blackwell, and the mass production timeline for the next-generation Vera Rubin.[Share Link: Preview of NVIDIA's Earnings Highlights >>] Every figure will transcend NVIDIA itself, repricing the valuation anchor of the entire AI computing power supply chain and becoming a key variable influencing risk appetite in the US tech sector for the next phase. Below, we will analyze the latest stock price structure and key levels from a technical perspective ahead of the earnings release. Recent stock price movement NVIDIA is currently showinga pattern where a short-term downtrend coexists with a medium-term bullish structure.After falling for seven consecutive sessions from the recent high of $227.92 to around $208, the stock closed higher on August 25, briefly easing selling pressure. The share price is currently trading above the 60-day EMA ($209.50),maintaining an intact medium-term technical bull market structure.Despite this, the closing price of $213.05 remained below the 20-day Moving Average (MA20) at $214.58,The short-term trend has not yet reversed. Key Technical Indicator Analysis EMA Moving Averages:EMA5 = $214.16, EMA10 = $215.78, EMA20 = $214.62, EMA6...](https://nnqimage.futunn.com/sns_client_feed/999991/20260826/web-1787732092135-zcxBhVS2Iw.png/big?area=2&is_public=true&imageMogr2/ignore-error/1/format/webp)
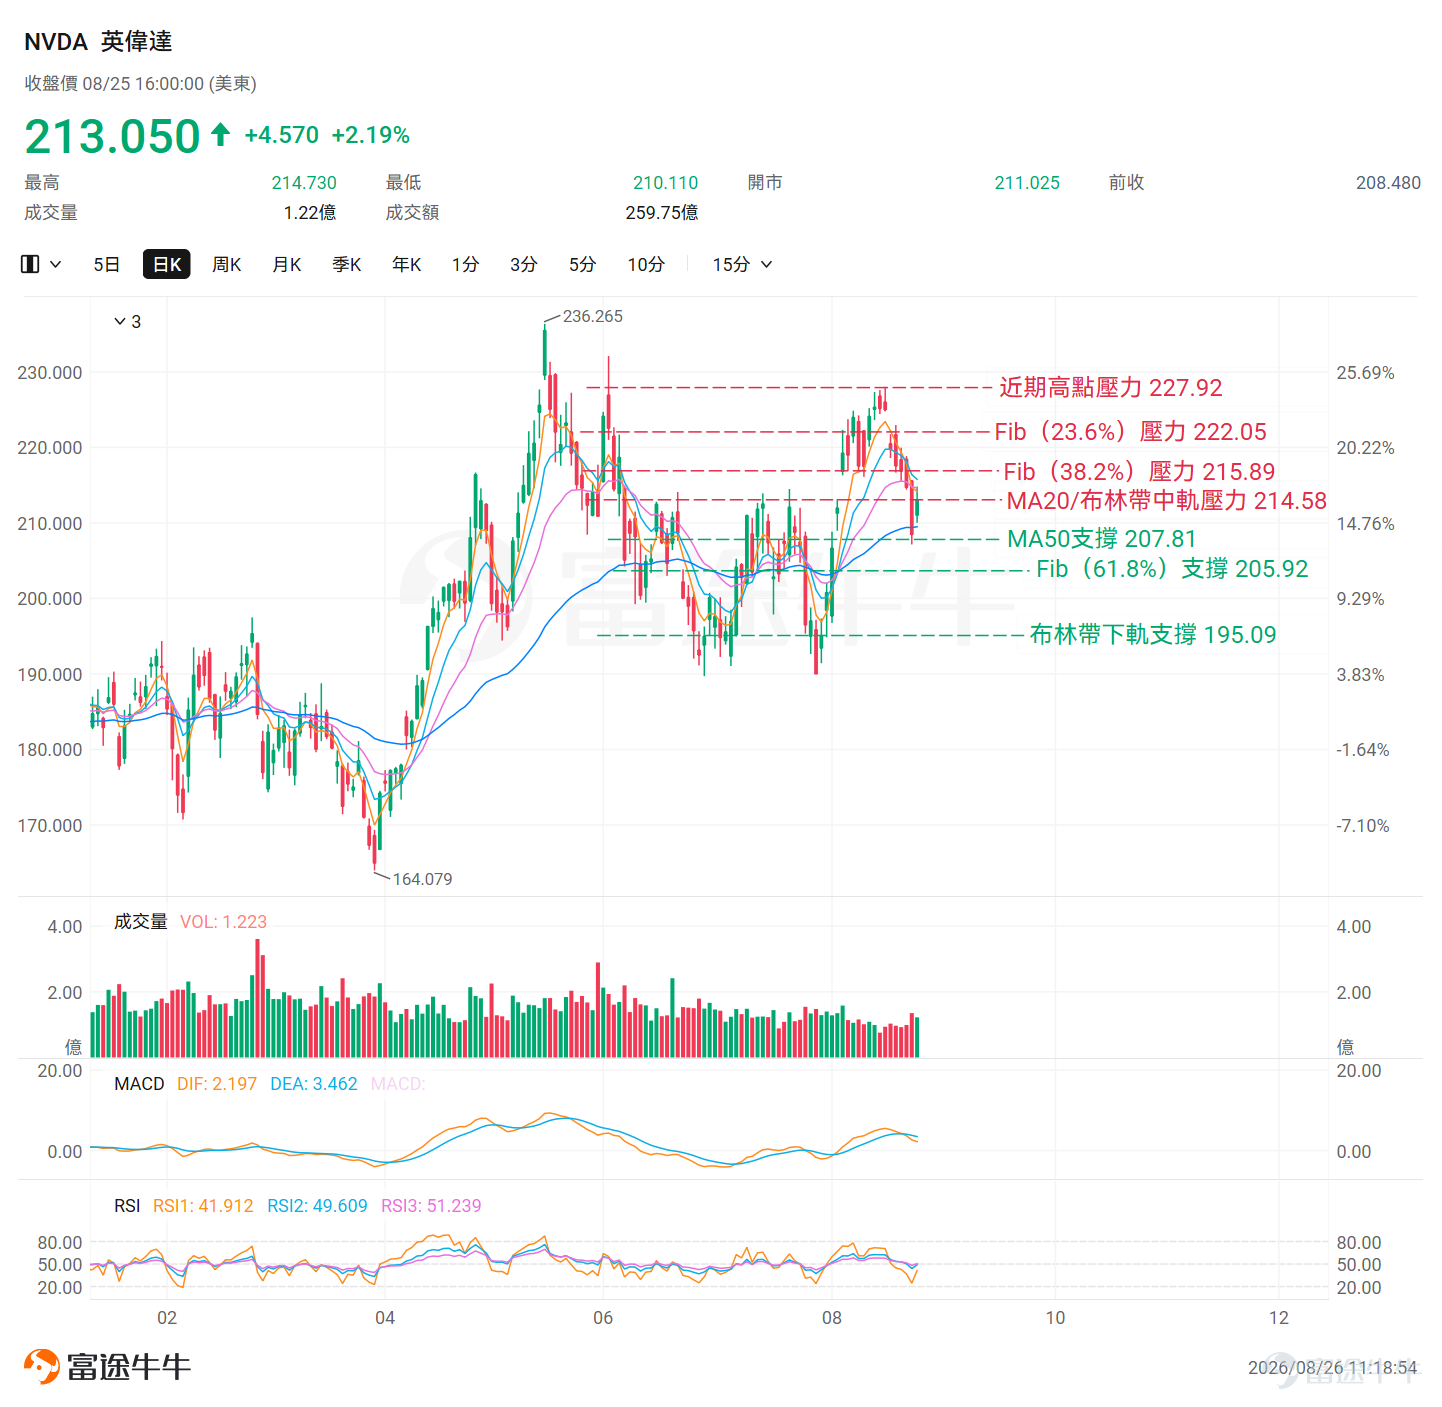
NVIDIA is currently showinga pattern where a short-term downtrend coexists with a medium-term bullish structure.From the recent high of $227.92, the stock price fell for seven consecutive sessions with bearish candles to around $208, before closing higher on August 25, temporarily easing selling pressure. The stock is currently trading above the 60-day Exponential Moving Average (EMA60) at $209.50,The medium-term technical bull market structure remains intact.Nevertheless, the closing price of $213.05 remains below the 20-day Moving Average (MA20) at $214.58,the short-term trend has not yet reversed.
Key Technical Indicator Analysis
EMA Moving Averages:EMA5=$214.16, EMA10=$215.78, EMA20=$214.62, EMA60=$209.50. The EMA5 has crossed below the EMA10 and is trading below the EMA20, indicating a short-term bearish alignment; however, the price remains above the EMA60, maintaining a medium-term technically bullish posture.
RSI:49.61, situated in a neutral zone with no clear overbought/oversold signals; no bullish divergence observed.
MACD:MACD line (2.20) < Signal line (3.46), in a death cross state, with momentum above the zero axis continuing to weaken; no bullish divergence seen, short-term sentiment remains bearish.
Bollinger Bands:The stock price ($213.05) is trading between the middle band ($214.58) and the lower band ($195.09), moving closer to the lower band; volatility has not narrowed, showing no contraction signal.
Fibonacci:The current stock price of $213.05 is located between the 50% Fibonacci retracement level ($210.90) and the 38.2% Fibonacci retracement level ($215.89)—with immediate support at $210.90 and resistance above at $215.89.
* Fibonacci retracement levels are automatically calculated based on the highest and lowest prices over the past 60 trading days, not manually selected swing points. Actual support/resistance effectiveness should be confirmed by market price action
Comprehensive assessment
NVIDIA currentlyThe most direct support corresponds to the 50% Fibonacci retracement level at $210.90,This serves as a key reference zone for the recent stabilization of the stock price; if this level is breached, the50-day moving average (MA50) at $207.81 will become the critical support line for this pullback;Going further down,Once the 61.8% Fibonacci retracement level at $205.92 is broken, the medium-term bullish structure will face a substantial test.
UpsideThe most immediate resistance lies at the 20-day moving average (MA20) of $214.58, which is close to the 38.2% Fibonacci retracement level at $215.89,creating a confluence of resistance from both the moving average and the retracement level, forming a key hurdle for a short-term breakout. If the stock price can effectively hold and close above $215.89,the next resistance target will point to the 23.6% Fibonacci retracement level at $222.05.
![$NVIDIA (NVDA.US)$ After seven consecutive trading days of declines, with a cumulative drawdown of approximately 7.4%, the stock stabilized and closed higher yesterday. Global markets are holding their breath for its earnings release—NVIDIA's data center revenue has long served as a real-time indicator of global investment sentiment toward AI infrastructure:Including the capex pacing of hyperscale cloud providers, the shipment ramp-up slope of Blackwell, and the mass production timeline for the next-generation Vera Rubin.[Share Link: Preview of NVIDIA's Earnings Highlights >>] Every figure will transcend NVIDIA itself, repricing the valuation anchor of the entire AI computing power supply chain and becoming a key variable influencing risk appetite in the US tech sector for the next phase. Below, we will analyze the latest stock price structure and key levels from a technical perspective ahead of the earnings release. Recent stock price movement NVIDIA is currently showinga pattern where a short-term downtrend coexists with a medium-term bullish structure.After falling for seven consecutive sessions from the recent high of $227.92 to around $208, the stock closed higher on August 25, briefly easing selling pressure. The share price is currently trading above the 60-day EMA ($209.50),maintaining an intact medium-term technical bull market structure.Despite this, the closing price of $213.05 remained below the 20-day Moving Average (MA20) at $214.58,The short-term trend has not yet reversed. Key Technical Indicator Analysis EMA Moving Averages:EMA5 = $214.16, EMA10 = $215.78, EMA20 = $214.62, EMA6...](https://nnqimage.futunn.com/sns_client_feed/999991/20260826/web-1787732092914-2fa2XIdVLb.png/big?area=2&is_public=true&imageMogr2/ignore-error/1/format/webp)
Risk Disclaimer: The above content only represents the author's view. It does not represent any position or investment advice of Futu. Futu makes no representation or warranty.Read more


Comments (2)
to post a comment
13
11