The Fed raises interest rates for the first time in three years! How will the market react?

Options Sir Breaks Down Hot Topics | After the S&P Hits New Highs, What Should We Focus on Next? AI, Software, and Gold Are Being Re-ranked
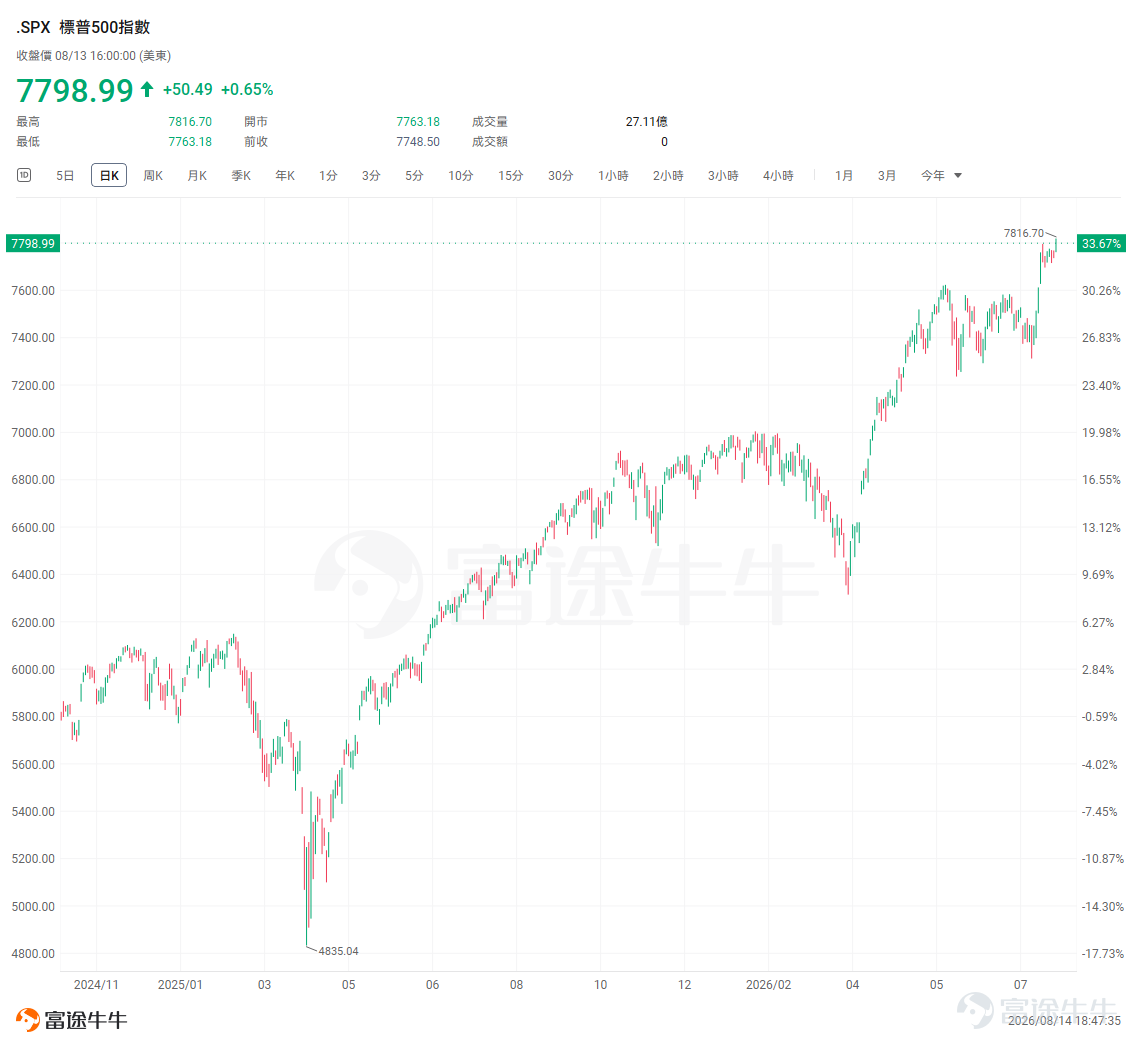
$S&P 500 Index (.SPX.US)$ Back to all-time highs again.
On August 13, the S&P 500 rose 0.65%, closing at 7,798.99 points, setting another record high close; $Nasdaq Composite Index (.IXIC.US)$ up 0.81%. More importantly, this rally to new highs occurred after tech stocks underwent significant deleveraging in late July.In just two weeks, market sentiment shifted rapidly from fears of an AI trade unwind and potential Fed rate hikes back to trading on earnings growth and easing macroeconomic pressures.
Wall Street remains broadly optimistic about the index itself.Goldman Sachs had previously raised its year-end 2026 S&P 500 target to 8,000 points, forecasting EPS of $340 for this year, a 24% year-over-year increase; JPMorgan also recently raised its year-end target from 7,800 to 8,000 points, while lifting its 2026 EPS forecast to $365. On August 7, Ashok Varadhan, Co-Head of Global Banking & Markets at Goldman Sachs, further stated that US stocks are highly likely to continue their "slow grind higher" after July's sharp volatility.
This means that current market discussions can no longer stop at "can the S&P still rise." What deserves more attention is the structural change behind the index's new highs.
1. Macroeconomic environment improves; the next key indicator to watch is the 10-year US Treasury yield.
This round of S&P 500 record highs stems primarily from declining macroeconomic pressures.
US July CPI fell to 3.4% year-over-year from 3.5%, while core CPI dropped to 2.5% from 2.6%, with a 0.2% month-over-month increase; subsequently released July PPI remained flat month-over-month, with goods prices down 0.7% month-over-month. Although energy prices remain relatively high year-over-year, the risk of further inflation deterioration has temporarily decreased.
This has altered the policy trajectory that the market had previously feared most.Goldman Sachs' Ashok Varadhan also recently assessed that the Fed is unlikely to continue raising rates in 2026.。
However, merely "holding rates steady" will not be enough moving forward. For growth stocks, the more critical factor is whether long-term interest rates can truly decline.
Morgan Stanley currently forecasts that, $U.S. 10-Year Treasury Notes Yield (US10Y.BD)$ by the end of 2026, they may gradually ease to approximately 4.25%,and further drop to around 4.20% in 2027, based on the assumption that inflation will gradually cool while the Fed keeps policy rates stable.
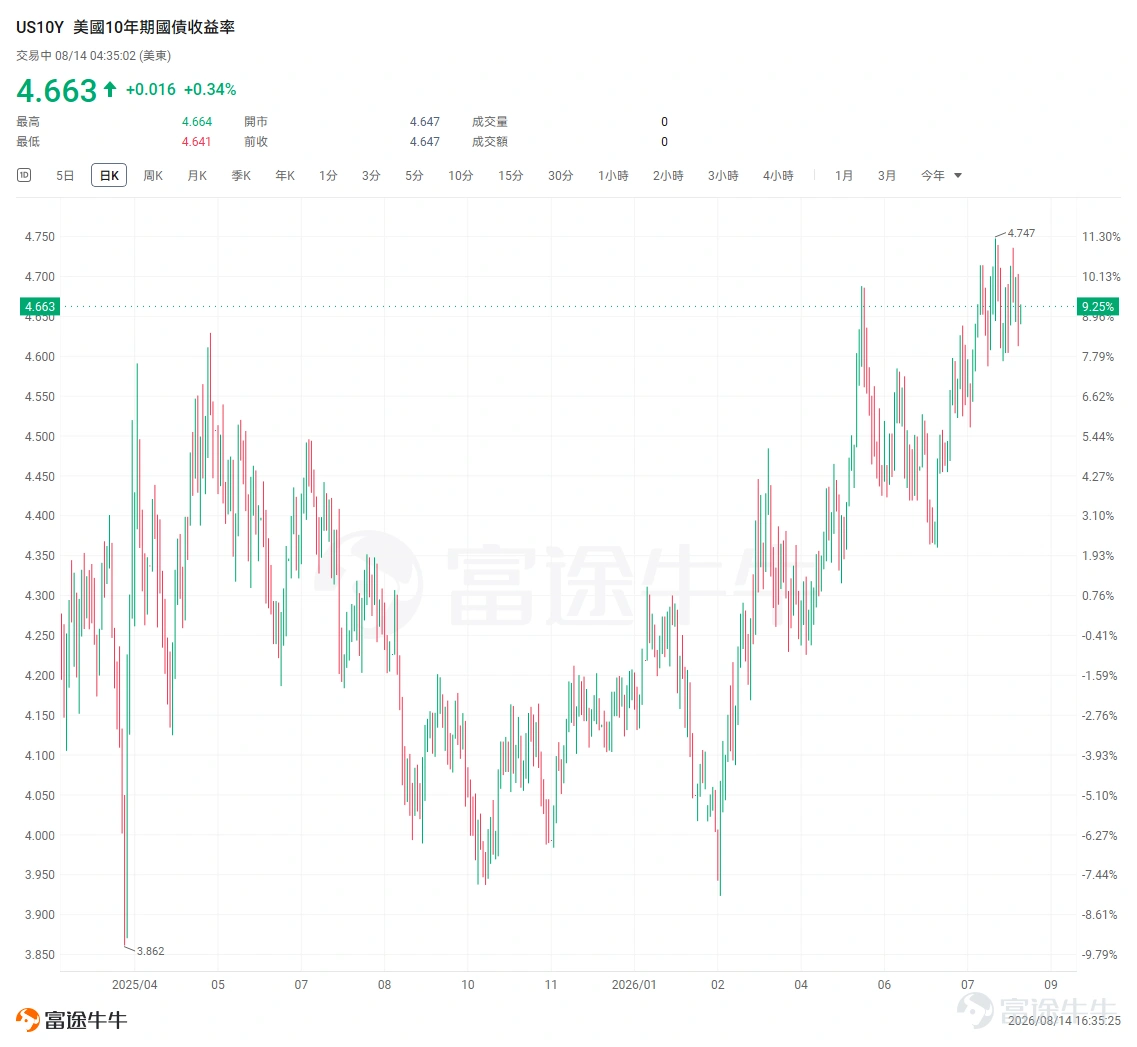
If this scenario materializes, the market will enter a relatively favorable environment: no significant economic recession, declining inflationary pressures, and a gradual easing of long-term rates. The scope for valuation recovery in high-duration assets, such as software, would expand significantly. Conversely, if oil prices spiral out of control again and the 10-year US Treasury yield approaches 5%, the deleveraging logic seen in July could resurface.
2. AI remains investable, but the strategy has shifted from "buying the entire sector" to screening for profitability.
AI remains the core driver of earnings growth in this round of US stock market performance.
In raising its S&P 500 target, Goldman Sachs pointed out that,The consensus market expectation for major hyperscalers' capital expenditure in 2026 has reached $754 billion, an 83% year-over-year increase, and is projected to further rise to $905 billion in 2027.Companies benefiting from AI-related capital expenditure are expected to contribute approximately half of the S&P 500's earnings growth this year and next, with semiconductors remaining the most direct beneficiaries.
UBS Group's outlook is even more optimistic.UBS CIO forecasts that AI-related capital expenditure could reach $820 billion in 2026, a year-over-year increase of approximately 68%, and approach $990 billion in 2027. Meanwhile, UBS expects semiconductor companies to contribute over 40% of the S&P 500's earnings growth in Q2 of this year, with earnings growth for constituents of the Philadelphia Semiconductor Index potentially reaching 92% in 2026.
Therefore, following the sharp decline in semiconductor stocks in late July, one point needs to be reconfirmed:The market is concerned about AI return on investment (ROI), but there is currently no clear inflection point in capital expenditure itself.
Goldman Sachs Asset Management's assessment after surveying Silicon Valley companies in July is also noteworthy. Investment Manager Brook Dane believes that corporate AI applications are transitioning from the pilot phase to scaled deployment, with token consumption by leading enterprises increasing rapidly and computing resources remaining under continuous strain. As AI expands from training to inference, demand will gradually spread to different segments such as ASICs, storage, and optical communications.
The previous logic was simple: with the growth in AI Capex, nearly the entire industry chain could enjoy valuation expansion. Going forward, the market will become more selective.
Investors will increasingly ask: Are orders still being revised upward? Can average selling prices (ASP) continue to rise? Is the supply-demand gap narrowing? Can AI revenue growth gradually catch up with capital expenditure?
Therefore, while the outlook for AI remains bullish, the strategy needs to shift fromBeta shifts toward earnings certainty。
3. Software valuation repair, but divergence is expected to widen
Compared to AI hardware, which has been rallying for a long time, software appears to be the next sector worth monitoring in advance. Opportunities in software essentially stem from the resonance of two factors:Previously, market expectations regarding the impact of AI were overly pessimistic. Additionally, once interest rates decline in the future, the duration profile of valuations will become favorable again.
Over the past few months, the software sector has borne the brunt of the market's most extreme pessimism. With the rapid development of AI Agents and automated coding tools, investors began to doubt whether the traditional seat-based pricing model of SaaS could be sustained in the long term. In the first quarter, the software sector even experienced a market capitalization erosion approaching the trillion-dollar level, $ServiceNow (NOW.US)$ 、 $Salesforce (CRM.US)$ 、 $Adobe (ADBE.US)$ Traditional industry leaders also saw significant drawdowns.
Currently, these expectations are starting to ease.
On August 13, news that Silver Lake was negotiating an acquisition of $Workday (WDAY.US)$ drove Workday's shares up nearly 18% in a single day. More notably, prior to the announcement, Workday was still down about 15% year-to-date and more than 40% below its 2024 highs. For the software industry, this potential transaction sends an important signal: once valuations decline sufficiently, the cash flows, customer relationships, and data assets of mature software companies regain recognition from industrial capital.
Morgan Stanley believes thatThe market's pricing of AI's disruption to the software industry may be overly pessimistic, but opportunities will remain highly differentiated. Companies that meet both of the following criteria include: $Microsoft (MSFT.US)$ 、 $Palo Alto Networks (PANW.US)$ 、 $CrowdStrike (CRWD.US)$ 、 $Shopify (SHOP.US)$ 、 $Cloudflare (NET.US)$ 、 $ServiceNow (NOW.US)$ 、 $Datadog (DDOG.US)$ and $Snowflake (SNOW.US)$ Adobe and Workday face relatively greater challenges.
Goldman Sachs has recently further reinforced its outlook on Microsoft.In early August, Goldman Sachs added Microsoft to its US Conviction List. Analyst Gabriela Borges believes that AI investment is gradually shifting from the "training and infrastructure build-out" phase to the stage of "integrating AI into actual enterprise workflows." With its Azure cloud platform, established enterprise customer relationships, and Copilot entry point, Microsoft is better positioned to convert AI usage into revenue. Goldman Sachs projects that Microsoft's EPS growth rate could accelerate gradually from approximately 12% in FY2027 to over 20% by FY2029.
The software sector may see a recovery, but it is unlikely to witness a traditional broad-based rally across the entire SaaS industry.Companies worth paying closer attention to typically share several common characteristics: strong cash flow, products deeply embedded in core enterprise processes, hard-to-replicate data assets, and the ability to turn AI into a new source of revenue.
4. The medium-to-long-term thesis for gold remains intact, but Wall Street has shifted from extreme optimism to a stance of "structurally bullish, cautiously short-term."
Gold is another asset class worthy of renewed discussion.
This year $XAU/USD (XAUUSD.CFD)$ It has experienced significant volatility. In late January, prices briefly surged to near $5,594 per ounce. Subsequently, driven by rising oil prices amid Middle East conflicts, a hawkish shift by the Fed, and a stronger US dollar, gold prices corrected by more than 20% from their highs. However, since hitting a low of around $3,965 in late June, gold has rebounded by nearly 10%.
Views among major banks have also changed significantly.
At the beginning of the year, Goldman Sachs raised its end-2026 gold price target to $5,400. However, in June, as expectations for Fed rate cuts were pushed back significantly, it lowered the year-end target to $4,900. Goldman Sachs' current stance on gold is very clear:Structurally still bullish, but more cautious on a tactical level. The reason is that high interest rates have increased the opportunity cost of holding gold, but central bank reserve diversification, fiscal sustainability, and geopolitical risks continue to provide medium-to-long-term support.
Bank of America's outlook is more conservative. In July, BofA lowered its average gold price forecast for 2026 by 14% to $4,360, but still believes that once the Fed's tightening cycle ends, it remains possible for gold to revisit $5,000.
Meanwhile, the largest structural support for gold is beginning to recover.
Data from the World Gold Council shows that global central banks' net gold purchases reached 289 tons in the second quarter, setting a historical record for the same period.Following a significant slowdown in central bank gold buying in the first quarter, this indicates that demand from the official sector has not disappeared.
Therefore, going forward, gold is better understood asmacro insurance within a portfolio. If oil prices stabilize, the economy achieves a soft landing, and AI and software sectors continue to rise, gold may not outperform stocks; however, if US fiscal issues intensify or the market re-bets on rate cuts, gold's appeal will recover.
5. In the next phase, US stocks may enter a market environment characterized by both 'earnings-driven trends' and 'valuation repair'.
Overall, the current macroeconomic environment is significantly more favorable than it was in July. Capital is unlikely to exit AI easily, but investment opportunities are gradually expanding from standalone semiconductor hardware to enterprise AI applications, software, and growth assets that were previously suppressed by high interest rates.
The rotation itself may be the key opportunity to seize in the next phase.
1. Bull Call Spread: Remain bullish on the index under the base-case scenario
Suitable for: Investors who believe a soft landing remains the base case and that the S&P can continue to rise, but are concerned about the cost and drawdown risk of buying calls directly near all-time highs.
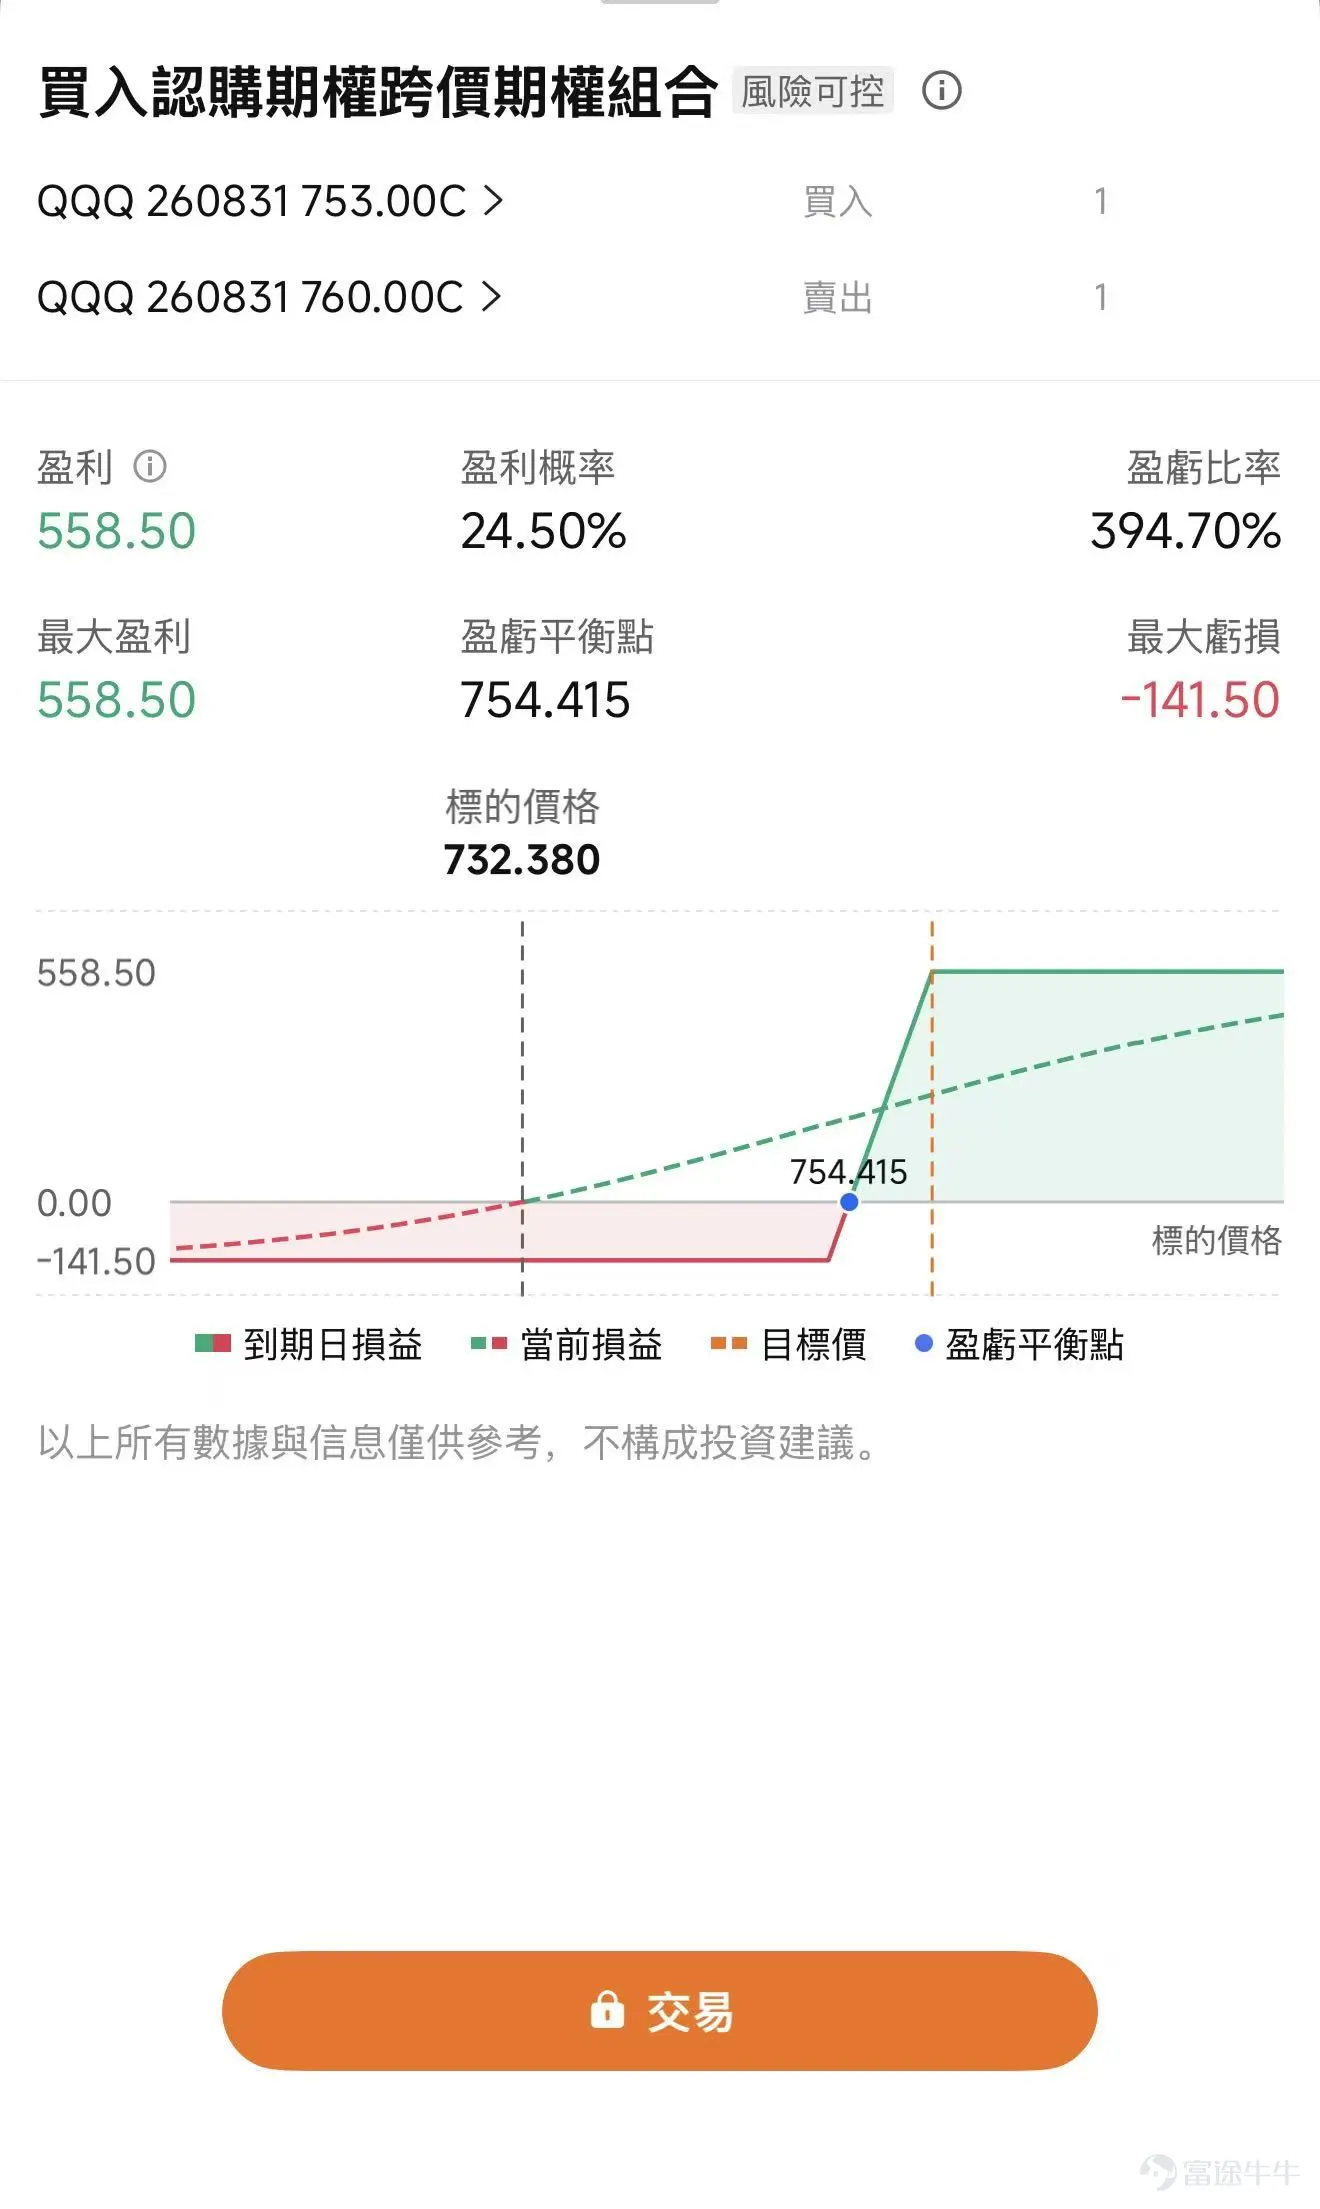
A Bull Call Spread is a bullish strategy with clearly capped risk and reward. It involves buying an SPY call option that is at-the-money or slightly out-of-the-money, while simultaneously selling a call option with a higher strike price to reduce the premium cost.While there is still upside potential for the index, the probability of continued rapid, one-sided gains similar to previous periods has decreased after hitting new highs.Therefore, compared to buying naked calls, a Bull Call Spread is better suited for capturing a market trend of "slowly making new highs."
(The chart below illustrates the simulated profit/loss profile of this strategy at expiration. The displayed graphic is for demonstration purposes only and does not constitute investment advice or guarantees; market conditions change rapidly, and the prices shown do not reflect real-time data.)
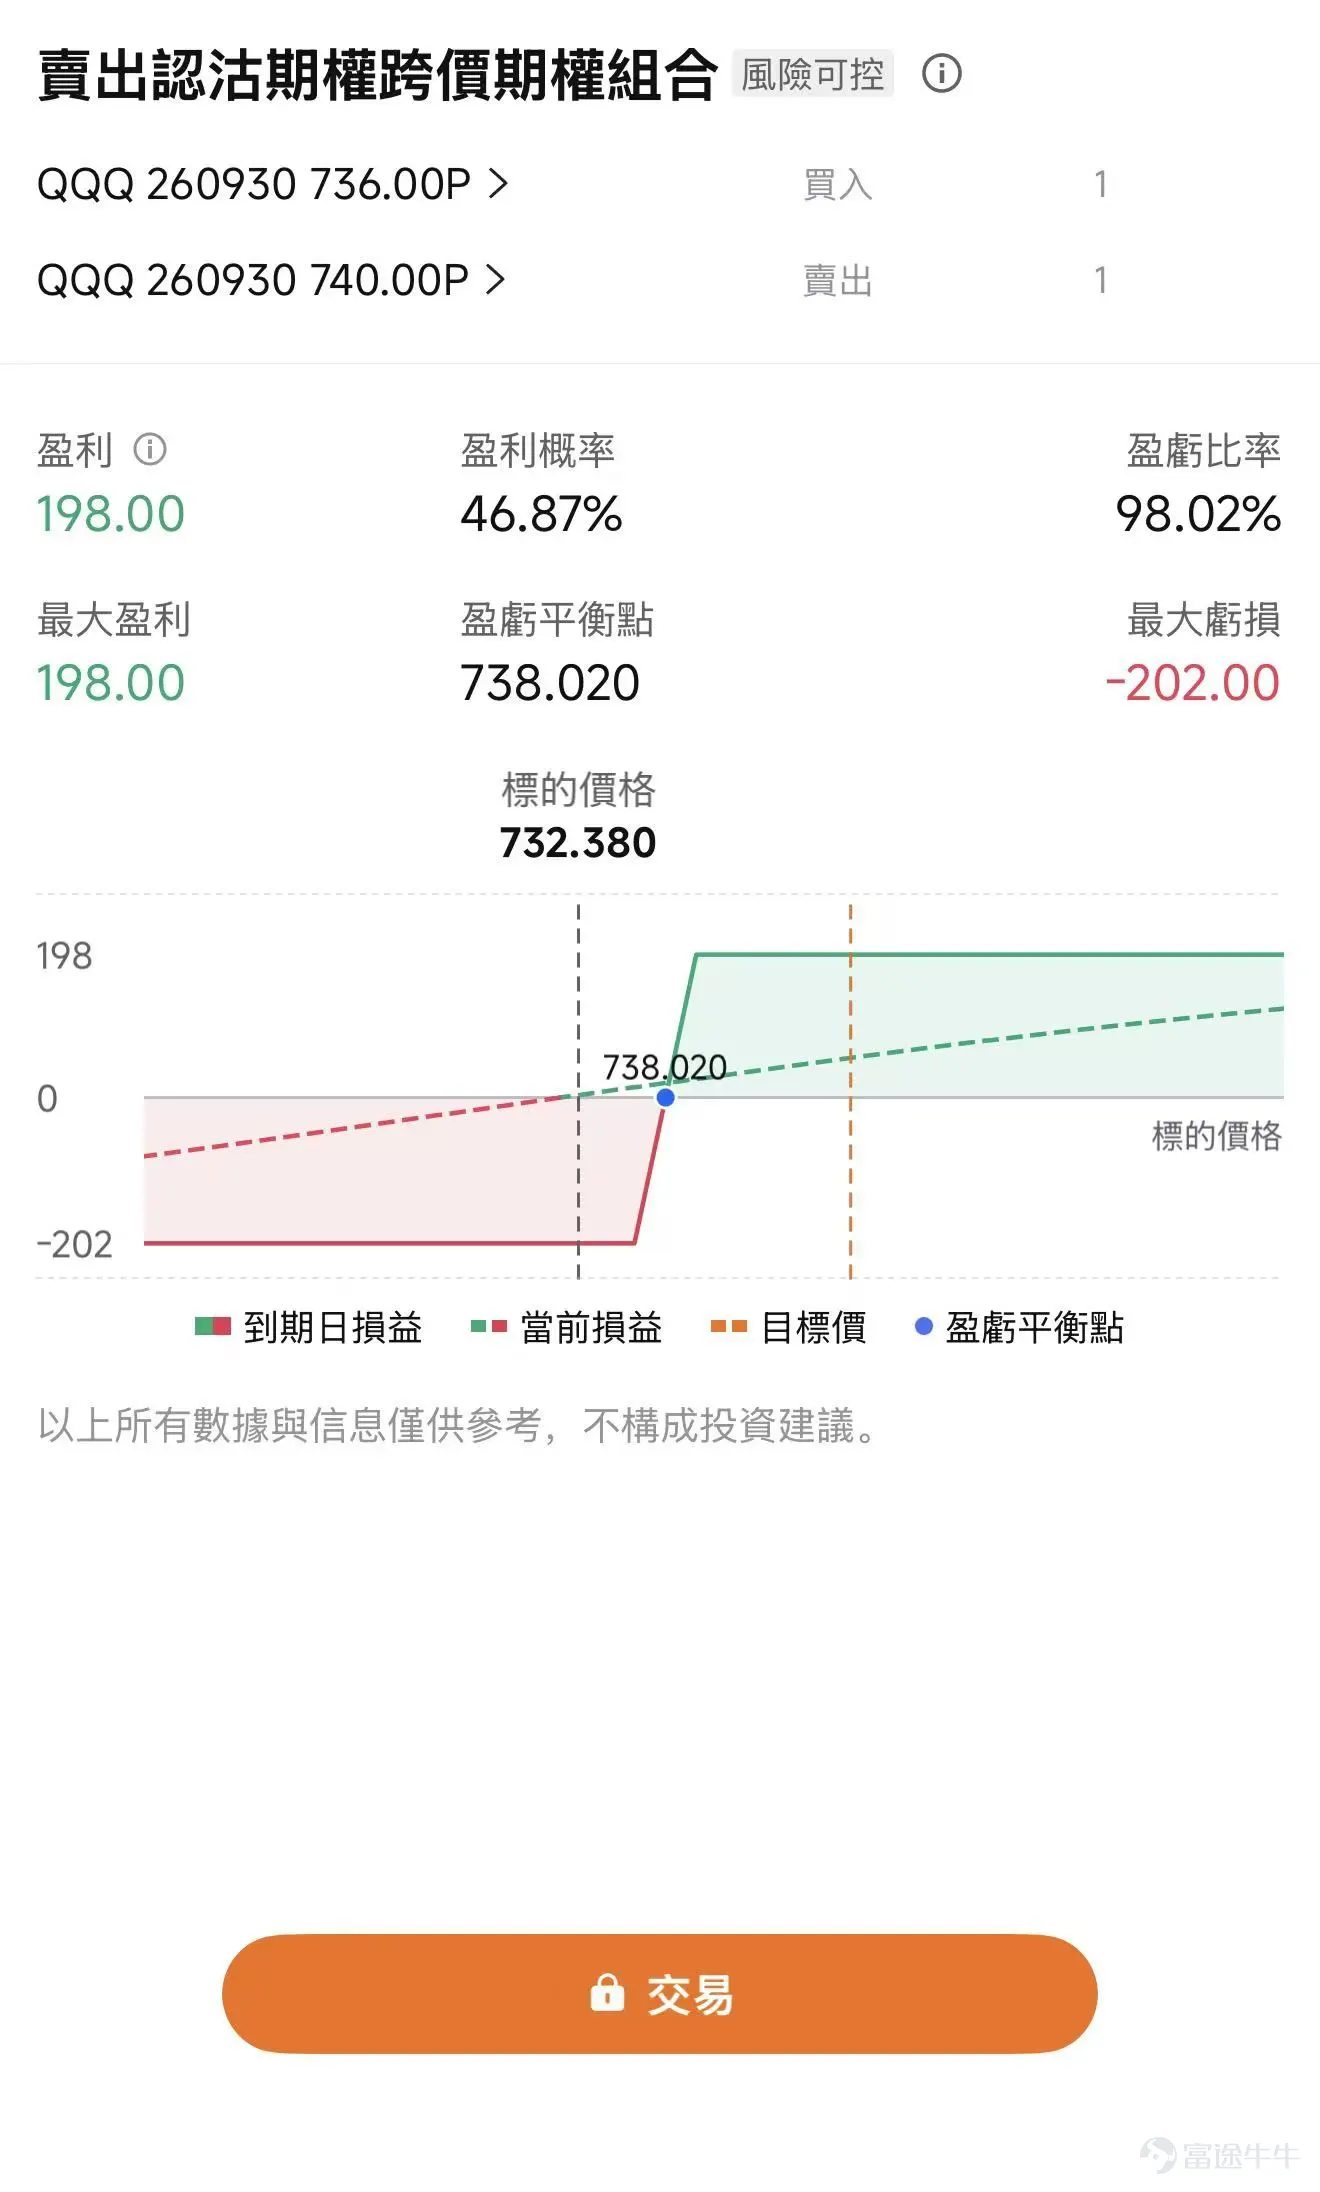
2、 Bull Put Spread: High-level consolidation, mildly bullish
Suitable for: Those who believe the index lacks upward momentum in the short term but is unlikely to drop sharply, expecting mostly sideways movement or slight fluctuations, then The Bull Put Spread is very suitable.The index has hit a new high, so the room for further significant gains may be limited. However, the macro environment is not yet supportive of a deep correction. Therefore, you can generate income by selling downside volatility.
Sell a put with a higher strike price and simultaneously buy a put with a lower strike price for protection. As long as the underlying price remains above the strike price of the sold put at expiration, you will earn the entire net premium. The index does not need to continue rising,you can also make money in a sideways market; meanwhile, the maximum loss is locked in advance.
(The chart below illustrates the simulated profit/loss profile of this strategy at expiration. The displayed graphic is for demonstration purposes only and does not constitute investment advice or guarantees; market conditions change rapidly, and the prices shown do not reflect real-time data.)
Finally, Options Sir has a small giveaway for fellow investors—feel free to claim it!Options Starter Pack
*This promotion is exclusively available to invited Hong Kong users. Click to learn more.Detailed terms and conditions of the promotion >>
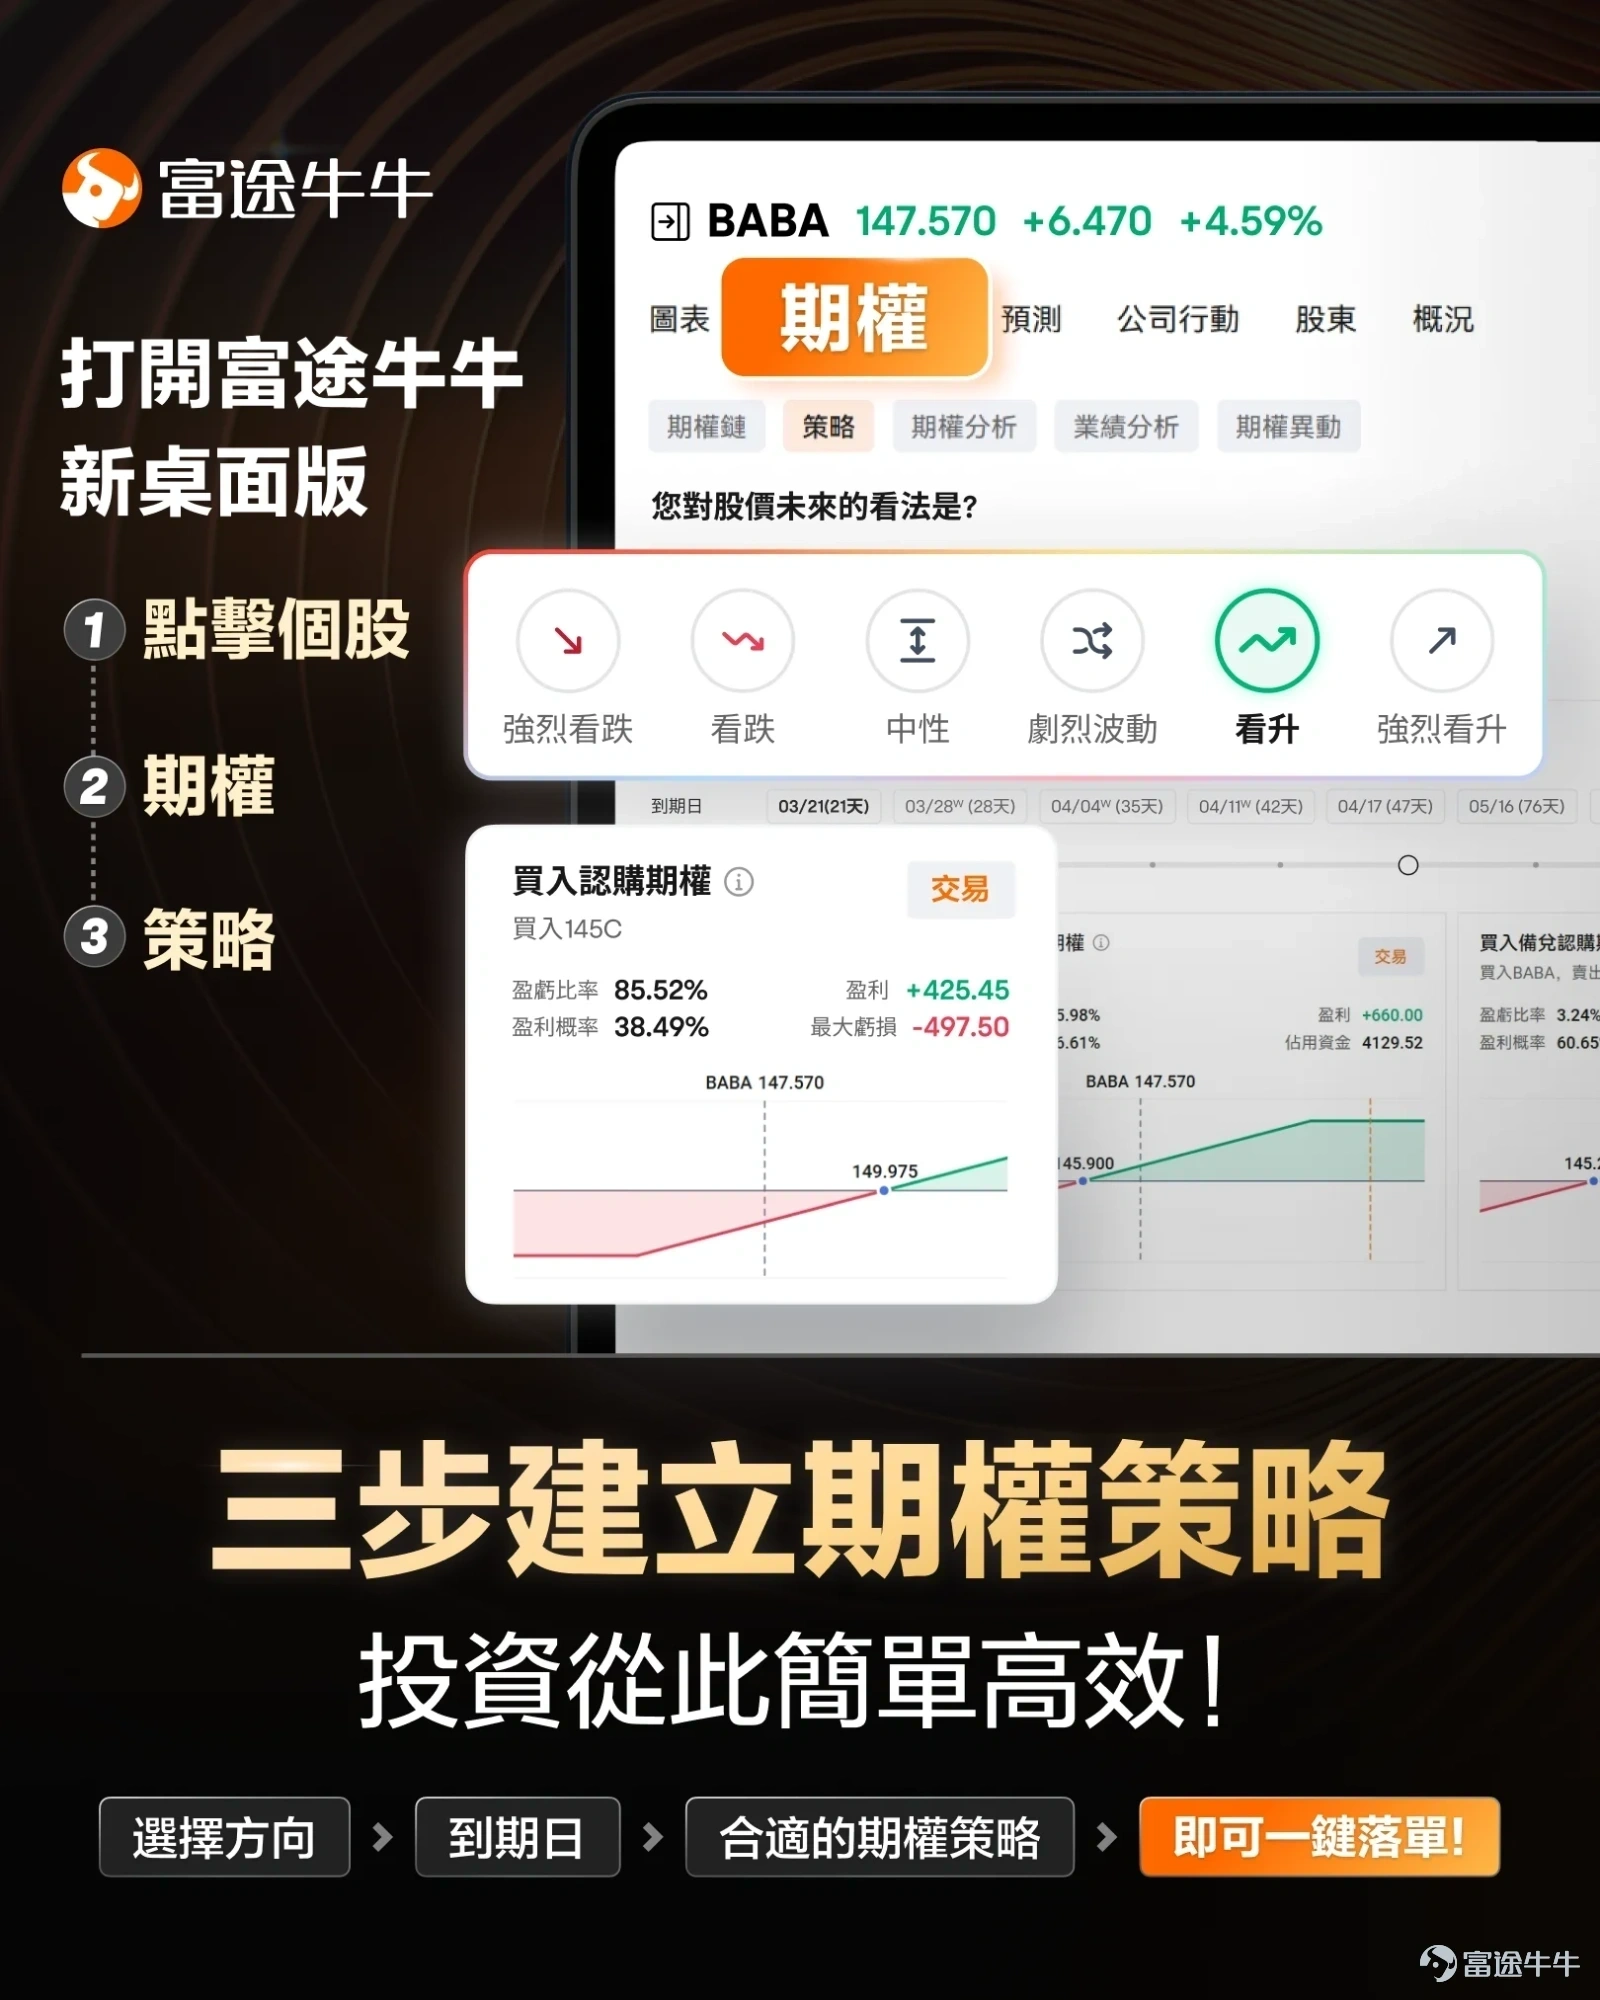
Market conditions are complex and ever-changing,Options strategiesToo many choices and unsure how to proceed? Let Futubull help you build a strategy in three simple stepsOptions strategies, making investing simple and efficient!
Options Risk Disclosure:An option is a contract that grants the holder the right—but not the obligation—to buy or sell an underlying asset at a predetermined price on or before a specified date. Option prices are influenced by multiple factors, including the current price of the underlying asset, the strike price, time to expiration, and implied volatility. Implied volatility reflects the market’s expectation of future price fluctuations over the life of the option; it is derived by reverse-engineering the Black-Scholes pricing model and is commonly viewed as an indicator of market sentiment. When investors anticipate higher volatility, they may be willing to pay more for options to hedge their risk, resulting in higher implied volatility. Traders and investors use implied volatility to assess the attractiveness of option prices, identify potential mispricings, and manage their risk exposure.
Disclaimer:This content does not constitute an offer, solicitation, recommendation, opinion, or any form of guarantee regarding any securities, financial products, or instruments. The risk of loss in trading options can be substantial. In certain circumstances, your losses may exceed the initial margin deposit. Even if you place contingent orders such as 'stop-loss' or 'limit' orders, there is no assurance that losses will be avoided, as market conditions may prevent execution of these orders. You may be required to deposit additional margin on short notice. If you fail to meet such margin calls within the stipulated time, your open positions may be liquidated. You remain fully liable for any resulting deficit in your account. Therefore, prior to trading options, you should thoroughly research and understand how options work and carefully consider whether such trading aligns with your financial situation and investment objectives. If you trade options, you should become familiar with the procedures for exercising options and handling expiration, as well as your rights and obligations upon exercise or expiration. Options trading involves significant risk and is not suitable for all investors. Investors should carefully read"Characteristics and Risks of Standardized Options"。
Risk Disclaimer: The above content only represents the author's view. It does not represent any position or investment advice of Futu. Futu makes no representation or warranty.Read more


Comments
to post a comment
10
5