The Fed raises interest rates for the first time in three years! How will the market react?

S&P 500 hits a new high! What should we focus on next?
August 13, $S&P 500 Index (.SPX.US)$Closed at 7,798.99, hitting another all-time high,It has been only 11 trading days since the阶段性 low of 7,316 on July 29,with a cumulative rebound of +6.6%.—Thanks to July's non-farm payrolls coming in below market expectations, CPI meeting expectations, and the July Producer Price Index (PPI) inflation data once again falling short of expectations, the market's previous concerns aboutinflation expectations have been effectively suppressed.Based on a comprehensive analysis of news flows, the current rally in US stocks is supported by a triple framework: "fundamental earnings growth + dovish shift in rate hike expectations + continued net capital inflows." Below, we analyze the recent price action from a technical perspective and highlight key levels to watch.
Recent Price Action

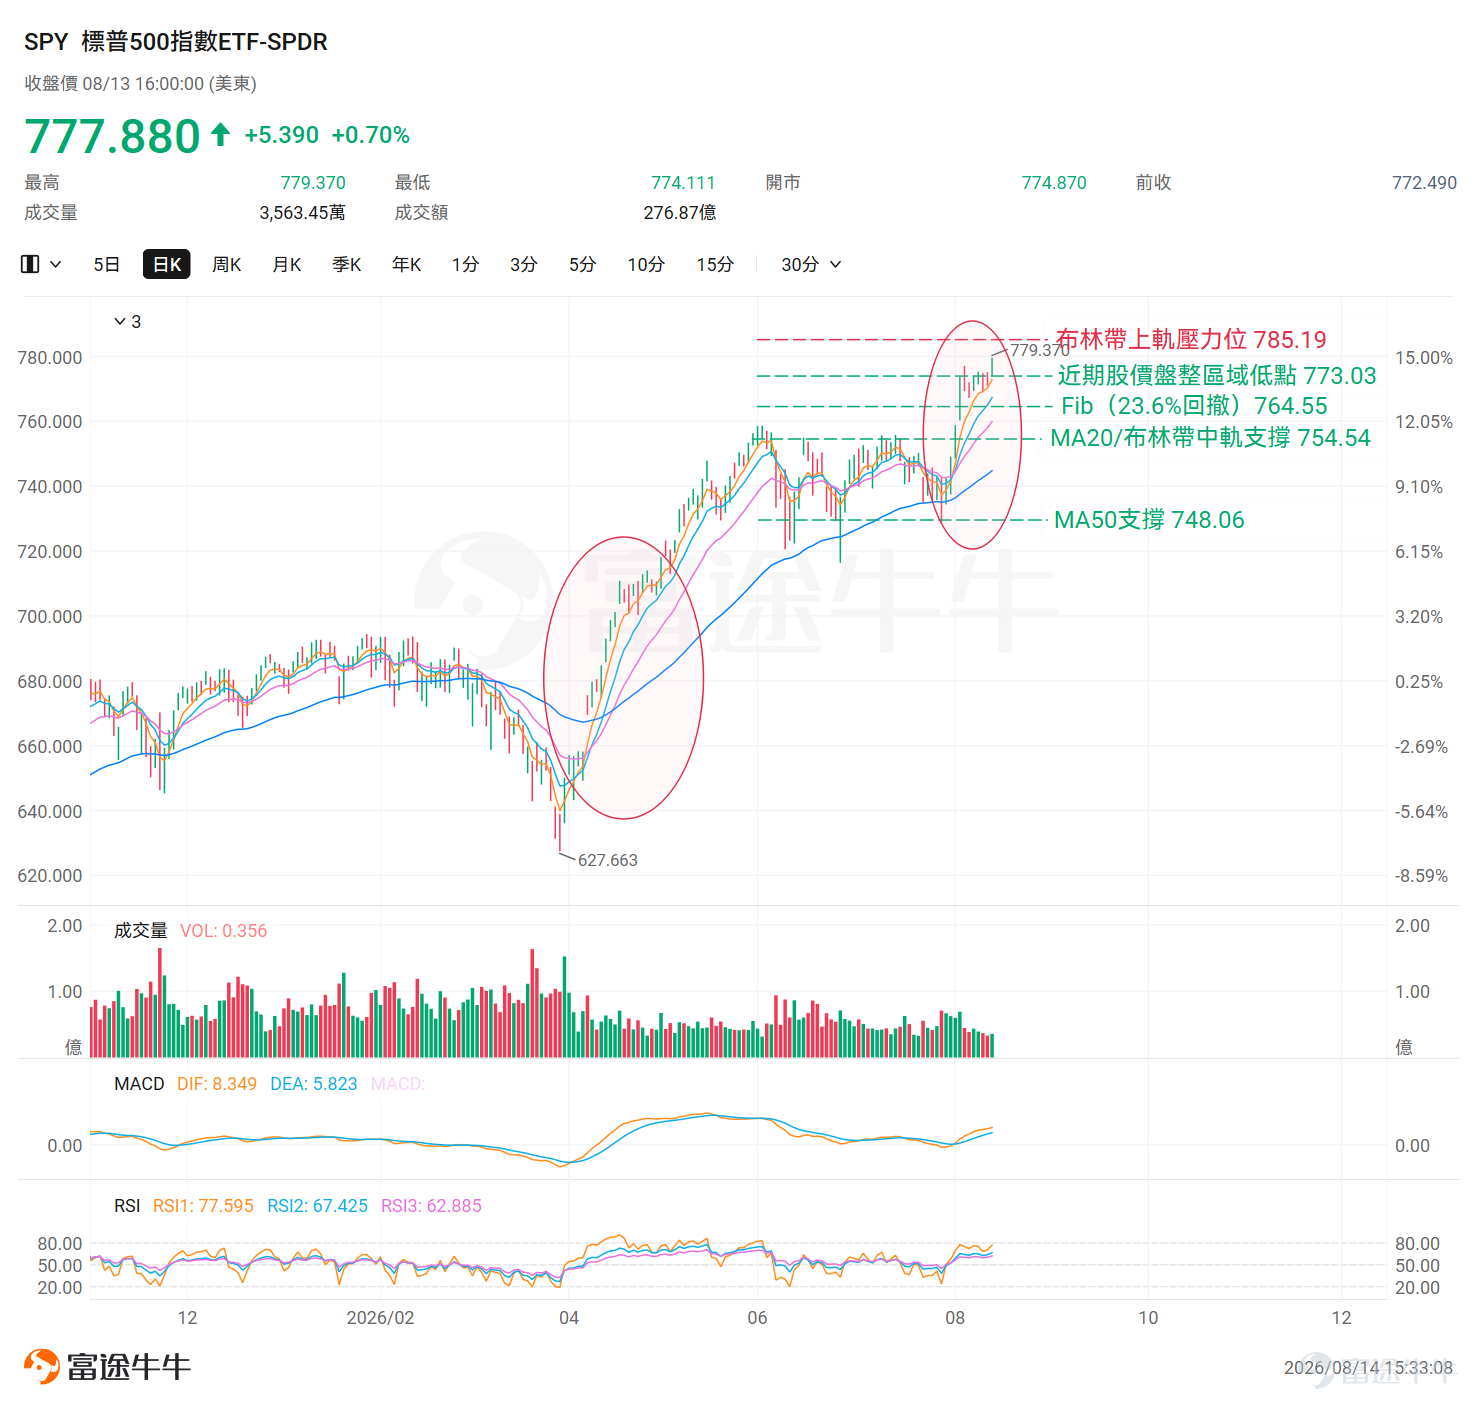
Taking $SPDR S&P 500 ETF (SPY.US)$ Taking [NVIDIA] as an example, the strong bullish candle on August 13 effectively broke through, confirming the end of the consolidation phase. Currently,the overall trend continues its upward trajectory.The EMA moving averages show a standard bullish alignment, with the latest closing price of $777.88 more than $33 above the 60-day EMA.The technical bull market structure remains intact.
Key Technical Indicator Analysis
EMA Moving Averages:EMA5 = $772.83, EMA10 = $767.33, EMA20 = $759.91, EMA60 = $744.77;All moving averages are in a bullish alignment, with short- to medium-term trends moving upward in unison.
RSI:At 67.43, located at the upper edge of the neutral zone; no bearish divergence detected.Momentum is strong, but upside potential is narrowing.
MACD:MACD line (8.35) > Signal line (5.82), indicating a golden cross; the histogram continues to expand, operating above the zero axis with upward momentum and no divergence.
Fibonacci:The current price is above the Fibonacci 23.6% level ($764.55), having broken through and stabilized.The Fibonacci 23.6% retracement level has shifted from resistance to support.
* Fibonacci retracement levels are automatically calculated based on the highest and lowest prices over the past 60 trading days, not manually selected swing points. Actual support/resistance effectiveness should be confirmed by market price action
Comprehensive assessment
On the support side, three levels of support provide varying degrees of downside buffer:$773.03 marks the low of the consolidation platform on August 10 and a recent high-volume trading zone.The chip distribution structure is intact, serving as the primary reference;$769.20 marks the intraday low on August 11 and the dynamic support level of the 10-day EMA,creating a resonance from these dual factors;$764.55 corresponds to the 23.6% Fibonacci retracement level,which offers strong buffering significance in the event of a deeper correction.
On the resistance side,$779.37 represents the high point of the recent 60-day range,it was touched during yesterday's session but failed to close firmly above it; whether it can break through and sustain this level is a key observation point;$785.19 is the upper band resistance of the Bollinger Bands,if the stock price effectively stabilizes above this level, the accelerating trend pattern will be further confirmed.
Looking back at the process from March to April, where US stocks experienced a significant pullback followed by a rapid recovery, rebound, and new highs, there are several similarities with the current swift rebound and new highs following this recent decline in terms of market drivers.
1. The triggers were both exogenous shocks—Both pullbacks were triggered by sentiment shocks stemming from geopolitical or policy-level developments;
2. Strong earnings from AI leaders served as a "reassurance," acting as the core catalyst for the market to confirm and initiate the reversal;
3. Fundamentals remained sound throughout—Neither sharp decline shook the core narrative of the AI industry chain. As a result, once the sentiment shock marginally subsided, capital inflows returned at an exceptionally rapid pace;
Key events to watch in the near term
However, US stocks are currently trading in a high-range zone,In the absence of definitive positive catalysts, the market is likely to enter a phase of high-level consolidation,The upside potential driven solely by sentiment repair is now quite limited.
The following key events in the near term deserve close attention:
1. Progress in US-Iran negotiations— Oil price trends directly influence inflation expectations and market sentiment;
2. NVIDIA will release its Q2 earnings after the market close on August 26 (Eastern Time)— As a core anchor for assessing AI capital expenditure and return cycles, its results will directly determine whether the main AI narrative can continue;
3. The Fed's September interest rate decision— Interest rates remain one of the most closely watched macro variables. Meanwhile, if long-term US Treasury yields continue to rise, high-valuation sectors will inevitably face pressure.

Risk Disclaimer: The above content only represents the author's view. It does not represent any position or investment advice of Futu. Futu makes no representation or warranty.Read more


Comments (4)
to post a comment
20
19