
Super Central Bank Week is here—will the Fed lean hawkish?

Options Market Statistics | Chasing AI Names, Hedging the Index: Positioning Into CPI Wednesday & FOMC Next Week
by Monta HONG, CFA | Options Strategist
Index Options
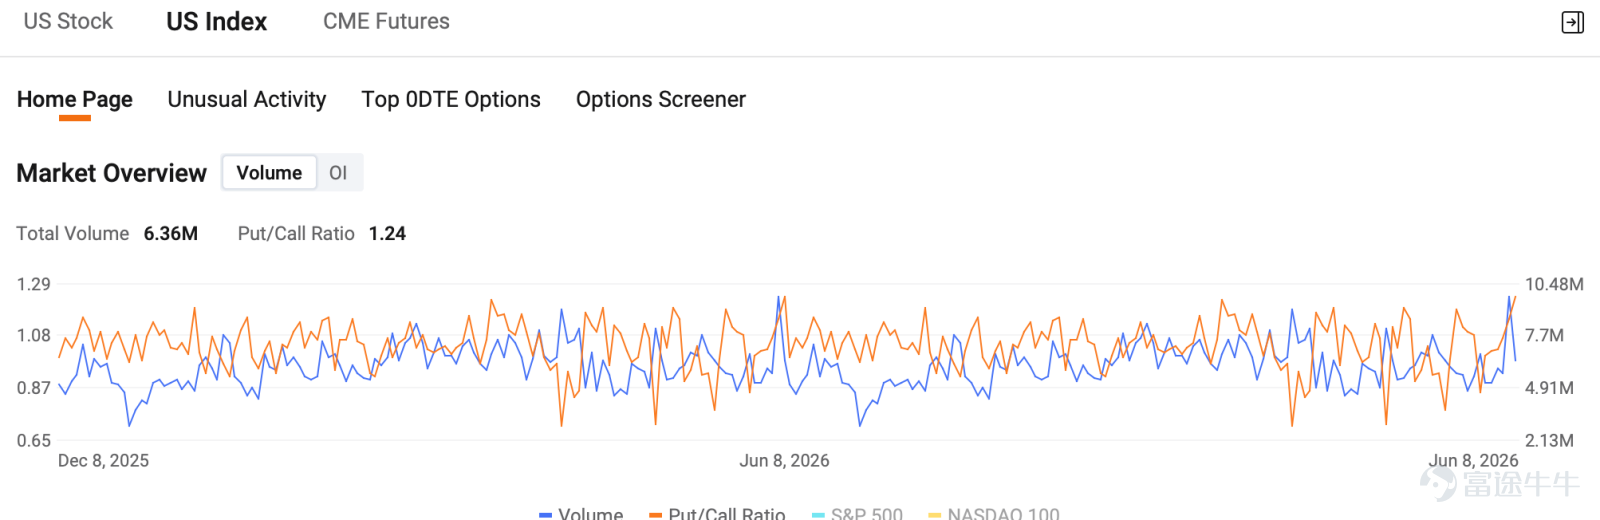
EST June 8, U.S. index options volume declined, totaling 6.36M contracts. The put/call ratio went up to 1.24.
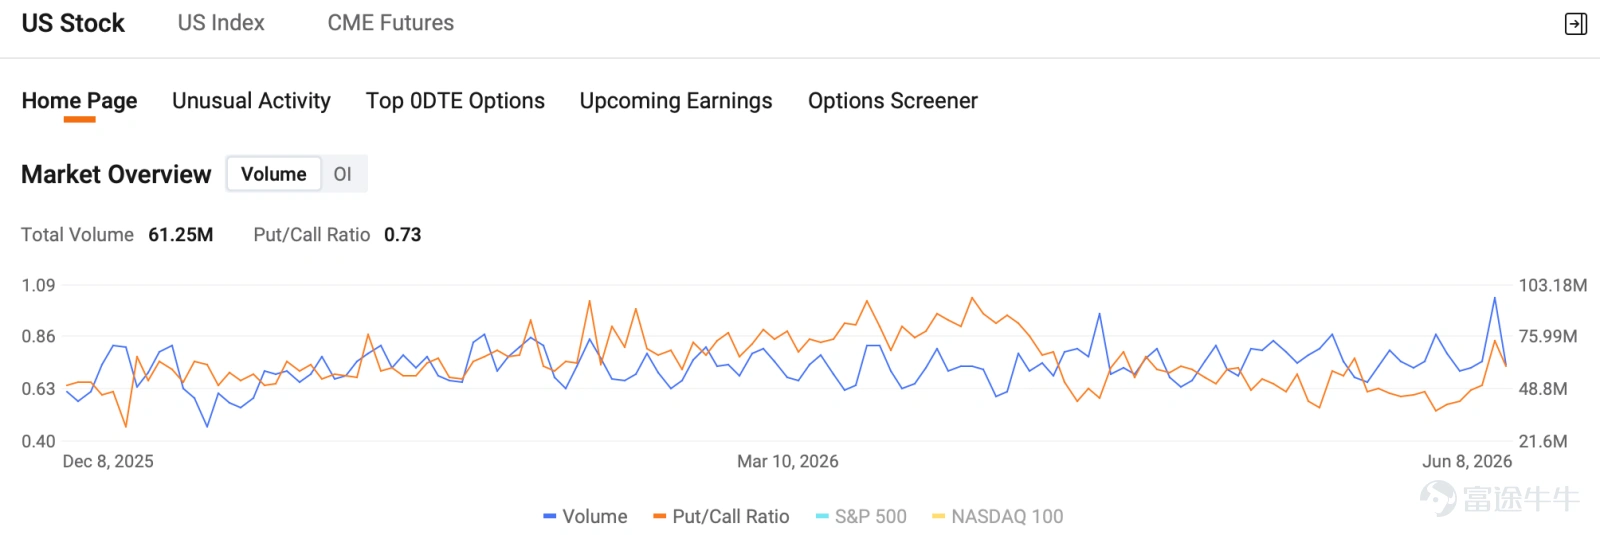
The market-wide P/C ratio has been grinding lower, while the index P/C ratio keeps climbing. That divergence is the whole story of the tape: market is chasing hot AI single names on the long side, while buying SPX puts to hedge the resulting concentration risk. The rally narrows, the index gets capped.
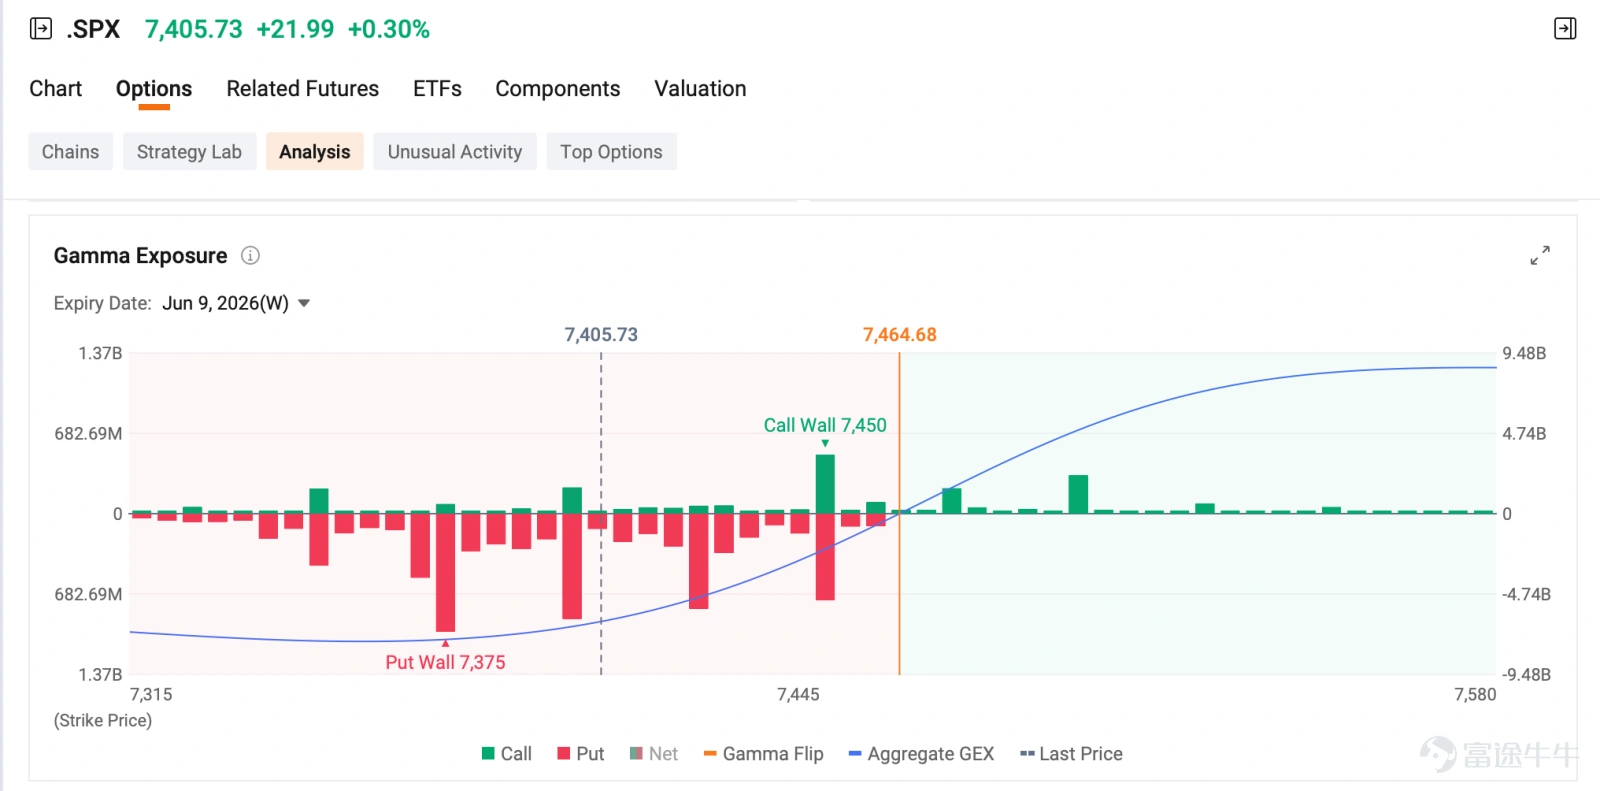
For $S&P 500 Index (.SPX.US)$ options expiring on next trading session, gamma structure shows: Put Wall at 7,375, Call Wall at 7,450, Gamma Flip at 7,464.68. With SPX closing at 7,405.73, the index sits below the flip and dealers are in negative gamma, where market makers sell into weakness and chase strength, amplifying any directional move.
Macro Setup - CPI This Wednesday, FOMC Next Wed
FOMC meeting at next Wednesday is Kevin Warsh's first as our new Fed chair.
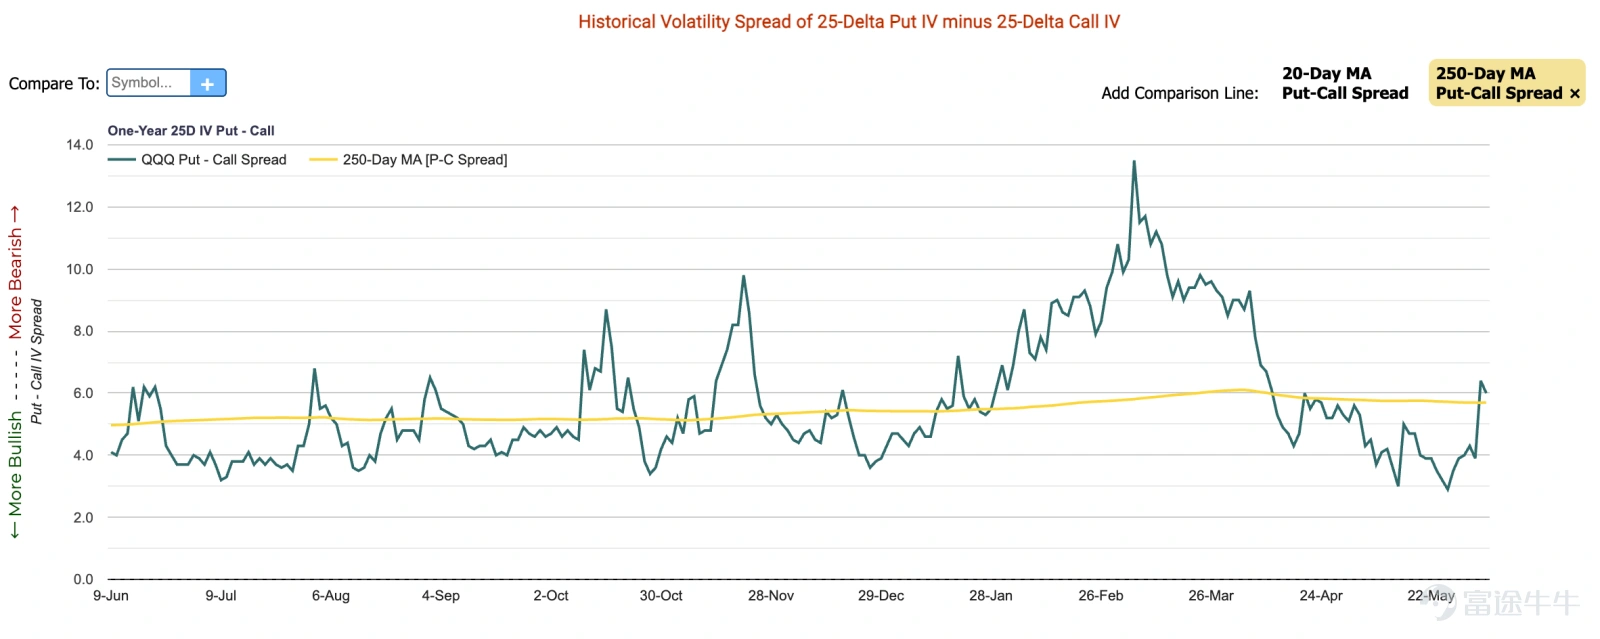
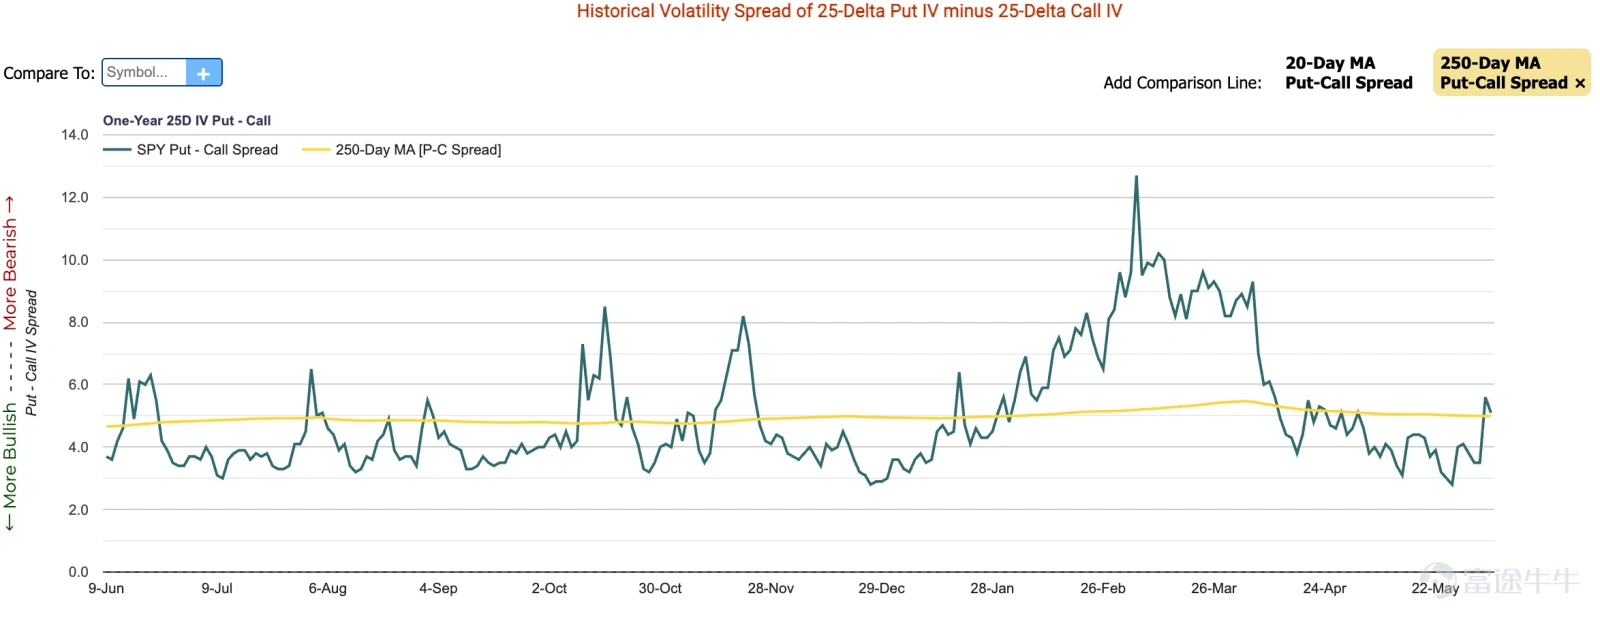
A week ago, the crowd was maximally long-and-calm and skew collapsed to year-lows. Today they're just starting to rebuild protection, but skew is nowhere near the Feb-Mar highs. Fear is not yet priced. This is the cost-effective hedging window before the crowd catches up.
$Invesco QQQ Trust (QQQ.US)$ 25D Put skew bounced from ~2.9 (year-low) back to ~6.3, just above its 250-day MA.
$SPDR S&P 500 ETF (SPY.US)$ 25D Put skew recovered from ~2.8(year-low) to ~5.5, above its 250-day MA.
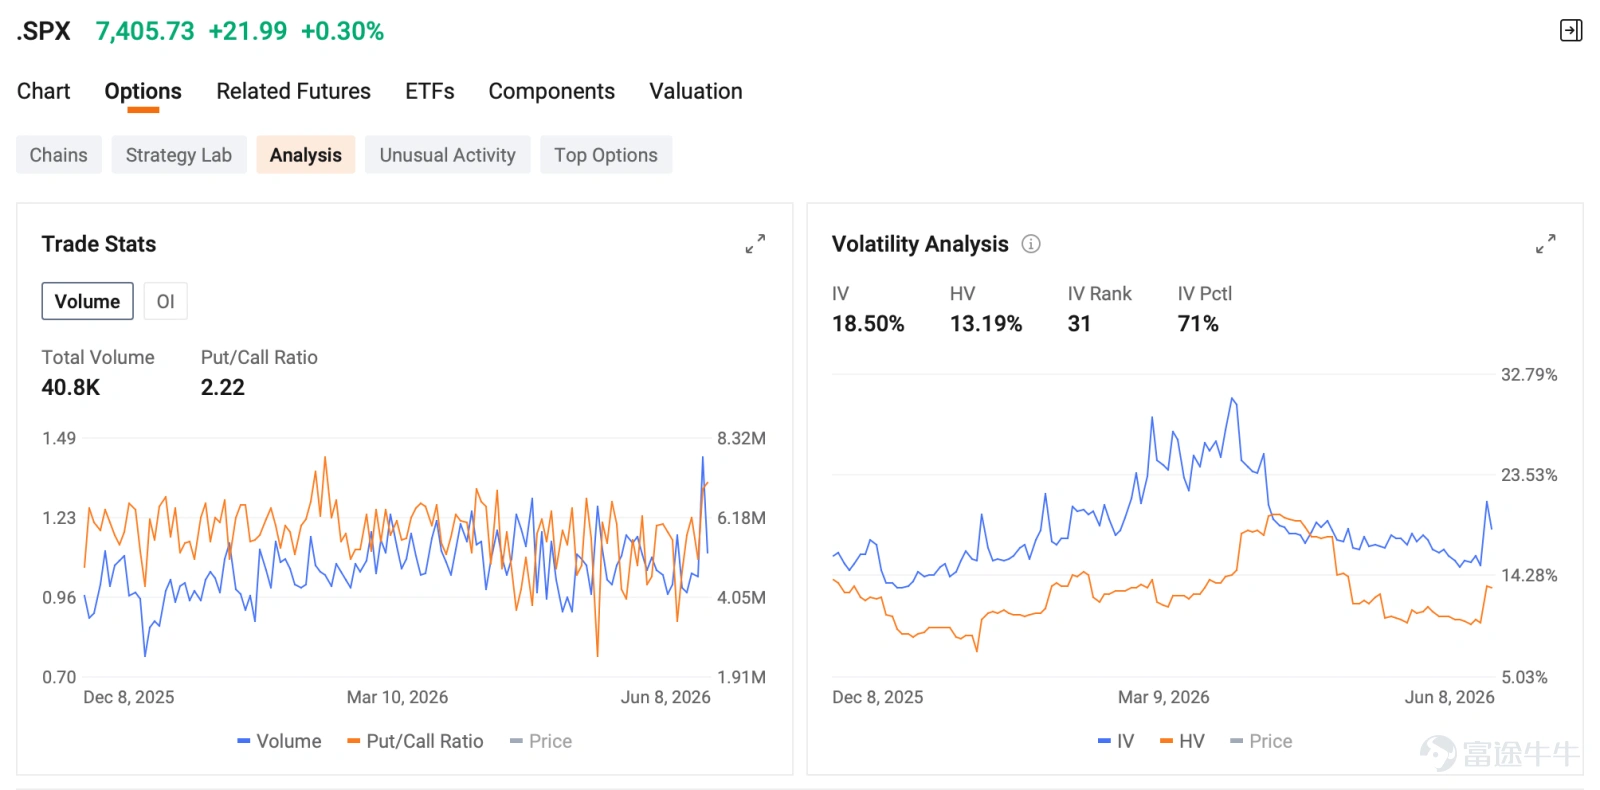
SPX IV 18.50% vs HV 13.19% (IV Pctl 71); SPX P/C 2.22 — extreme put-side flow.
Even on a benign CPI, vol won't fully collapse. FOMC event vol gets repriced into the term structure, keeping June premium rich vs July.
Calendar spreads (sell this or next week, buy next month) capture that bias. Tail hedgers: roll surviving downside hedges into FOMC week before vol re-bids.
Put spreads — OTM put IV is still well off Feb peaks, so skew expansion alone re-prices the structure.
Single Stocks Options
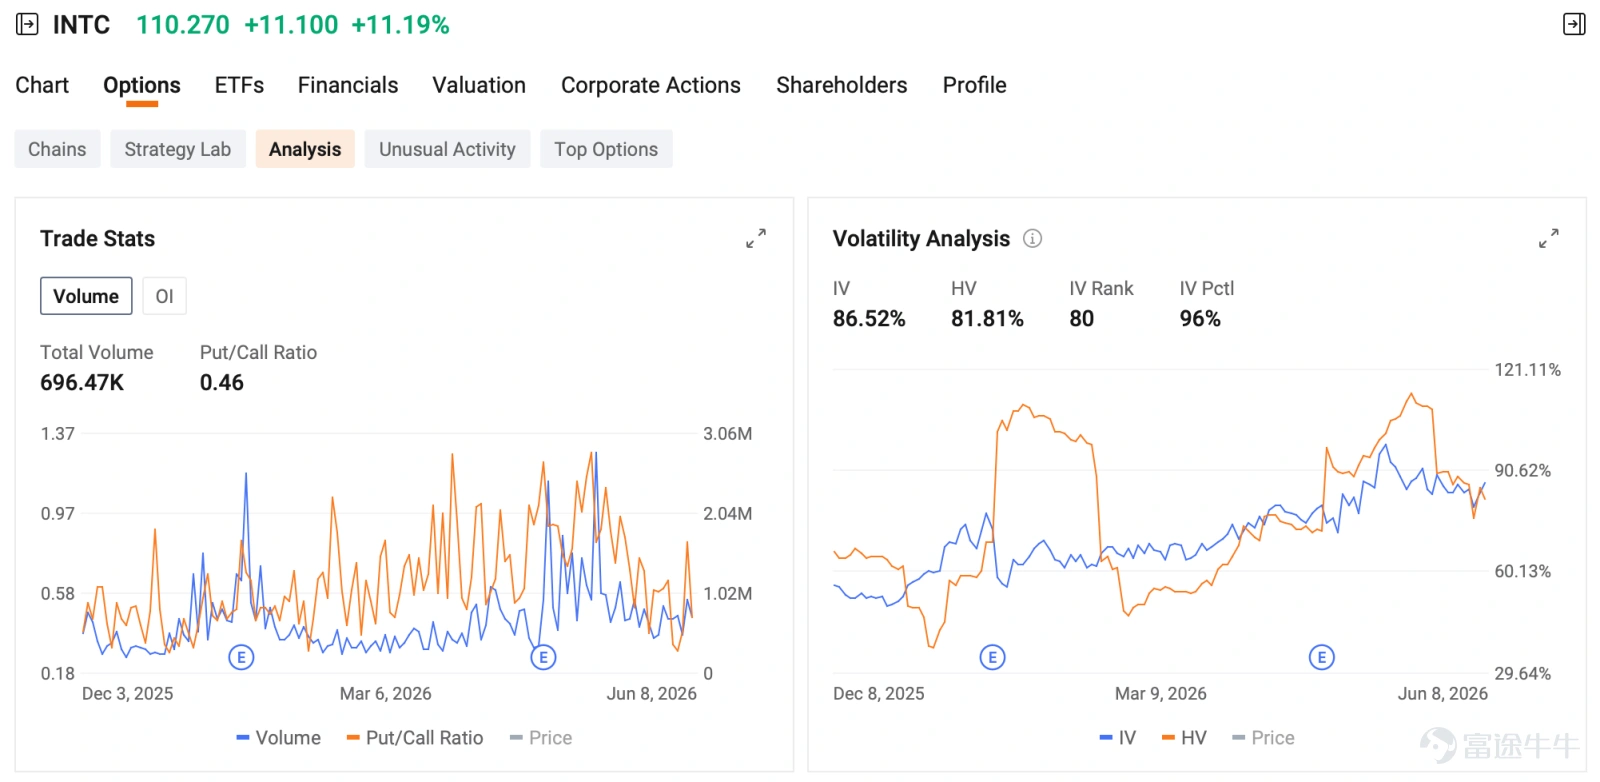
$Intel (INTC.US)$ closed up 11.19%, with 696.50K option contracts traded; the put/call ratio declined to 0.46. Intel shares surge 11% on Google's order for over 3 million AI chips. Buying calls pays elevated vol, while option sellers and call-spread sellers get richly compensated.
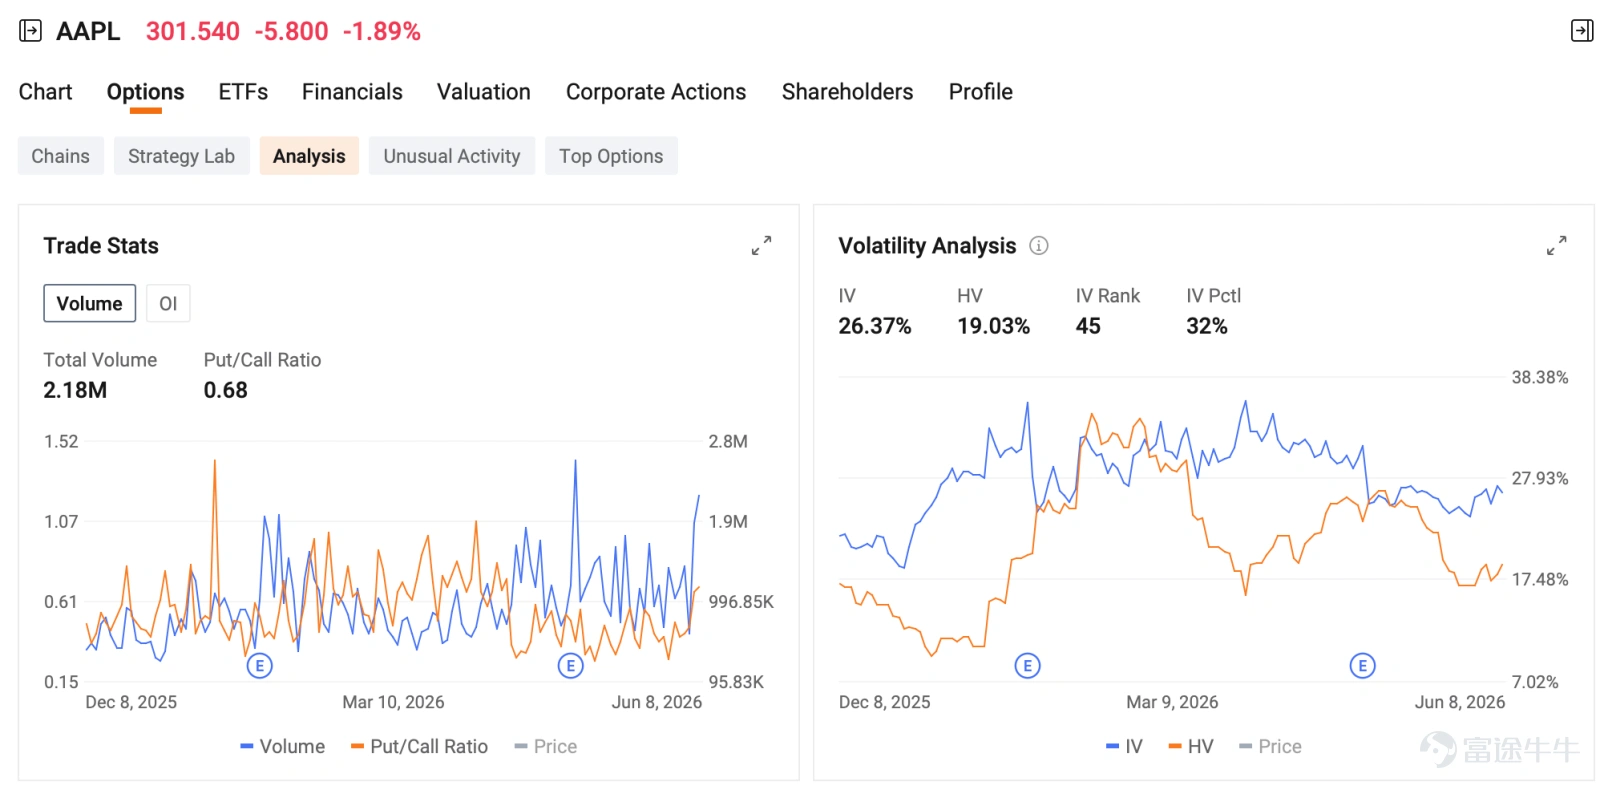
$Apple (AAPL.US)$ closed down 1.89%, with 2.18M option contracts traded; the put/call ratio climbed to 0.68. Apple unveiled upgraded Siri AI at WWDC but will exclude EU iPhone and iPad platforms due to regulatory requirements. For long AAPL holders, this is a low-cost window to roll on protective puts before the FOMC week.
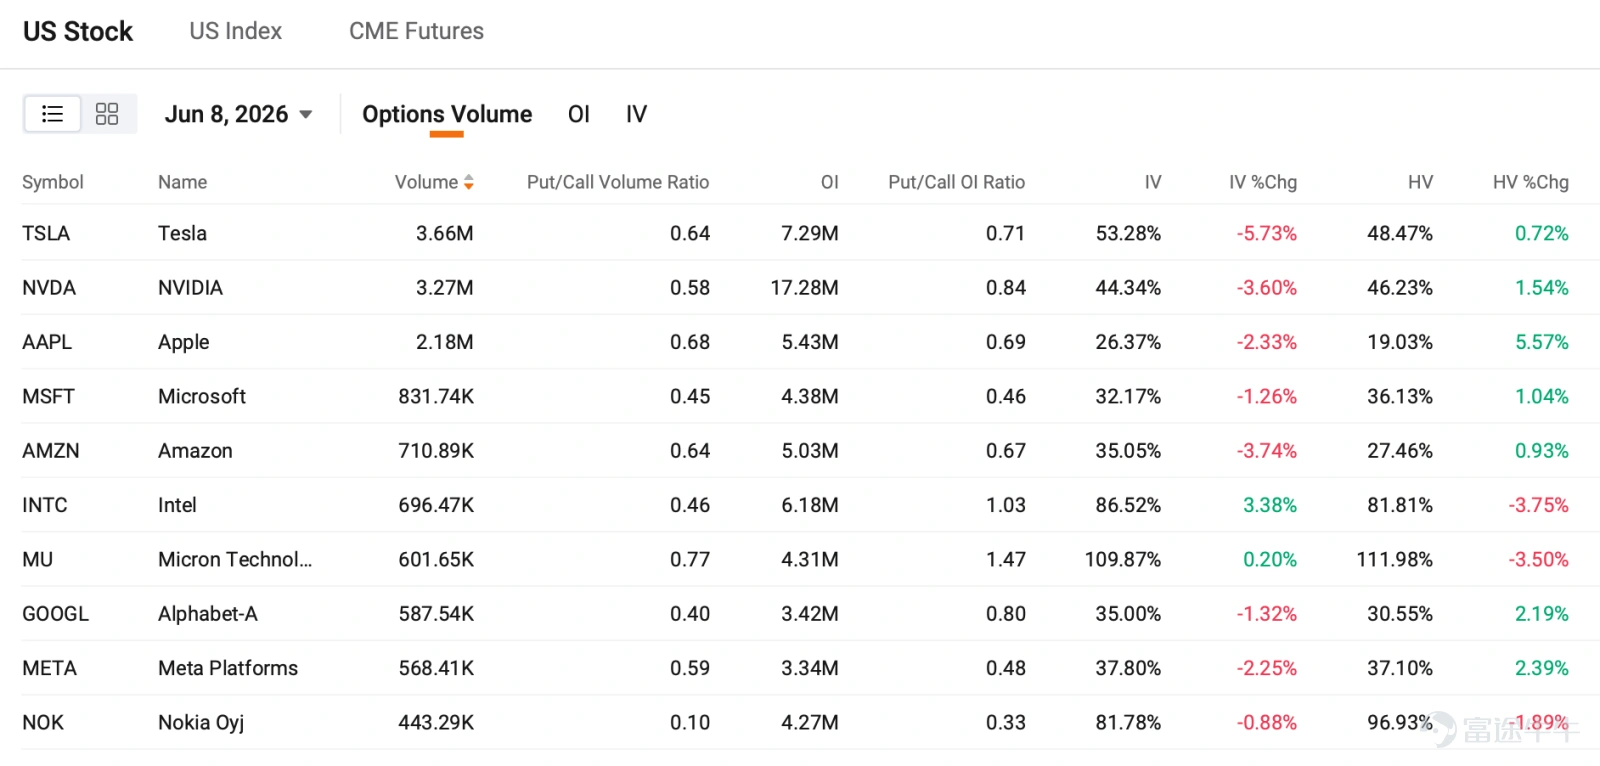
Top 10 Stocks With Highest Daily Options Volume
Among the top 10 stocks by options volume, $Micron Technology (MU.US)$ has the highest put/call trading volume ratio at 0.77. Micron Technology stock rebounds nearly 10% on Monday as analysts expect memory shortage to persist through end of 2028.
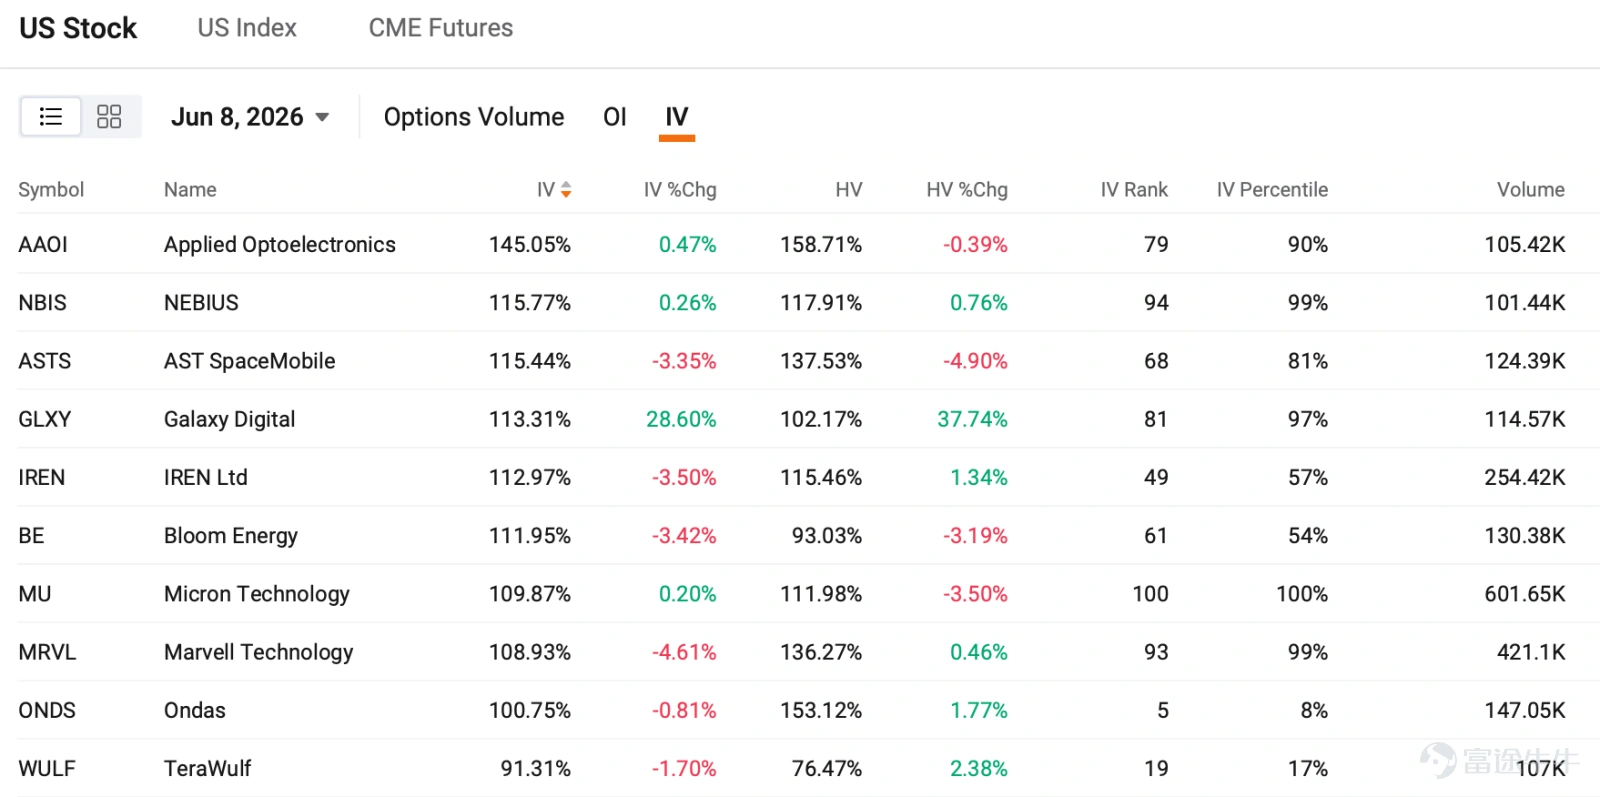
Top 10 Stocks With Highest Implied Volatility
$Applied Optoelectronics (AAOI.US)$ has the highest implied volatility at 145.05%, up 0.47% from the previous session. Applied Optoelectronics executives Chang Hung-Lun and Yeh Shu-Hua sold shares as the stock surged over 11% in optical communication sector rebound.
$Galaxy Digital (GLXY.US)$ implied volatility rose the most, reaching 113.31%, up 28.60% from the previous session. Galaxy Digital partners with Morgan Stanley on crypto lending services and CEO expects full 1.6 GW Texas data center capacity to be leased by summer.
Disclaimer: Options trading entails significant risk and is not appropriate for all customers. It is important that investors read the Characteristics and Risks of Standardized Options before engaging in any options trading strategies. Opening new options positions close to or on their expiration date comes with substantial risk of losses for reasons that include potential volatility of the underlying security and limited time to expiration. Options transactions are often complex and may involve the potential of losing the entire investment in a relatively short period. Certain complex option strategies carry additional risk, including potential losses that may exceed the original investment amount. If applicable, supporting documentation for any claims will be furnished upon request.
Risk Disclaimer: The above content only represents the author's view. It does not represent any position or investment advice of Futu. Futu makes no representation or warranty.Read more

Comments
to post a comment
3
2