Simultaneous pressure on the Red Sea and the Strait of Hormuz drives international oil prices higher

Oil prices remain high, global risk assets enter a rally! How to respond?
Yesterday, the U.S. stock market experienced a long-awaited surge amid important progress in U.S.-Iran negotiations$S&P 500 Index (.SPX.US)$After five consecutive weeks of decline and breaking below the 250-day moving average, the market finally saw a strong rebound. Today, the Asia-Pacific markets performed impressively, with major gains in Japanese and South Korean stock markets, as well as solid performances in Hong Kong stocks and mainland China's A-shares. Other major asset classes such as gold and silver also showed notable recovery.
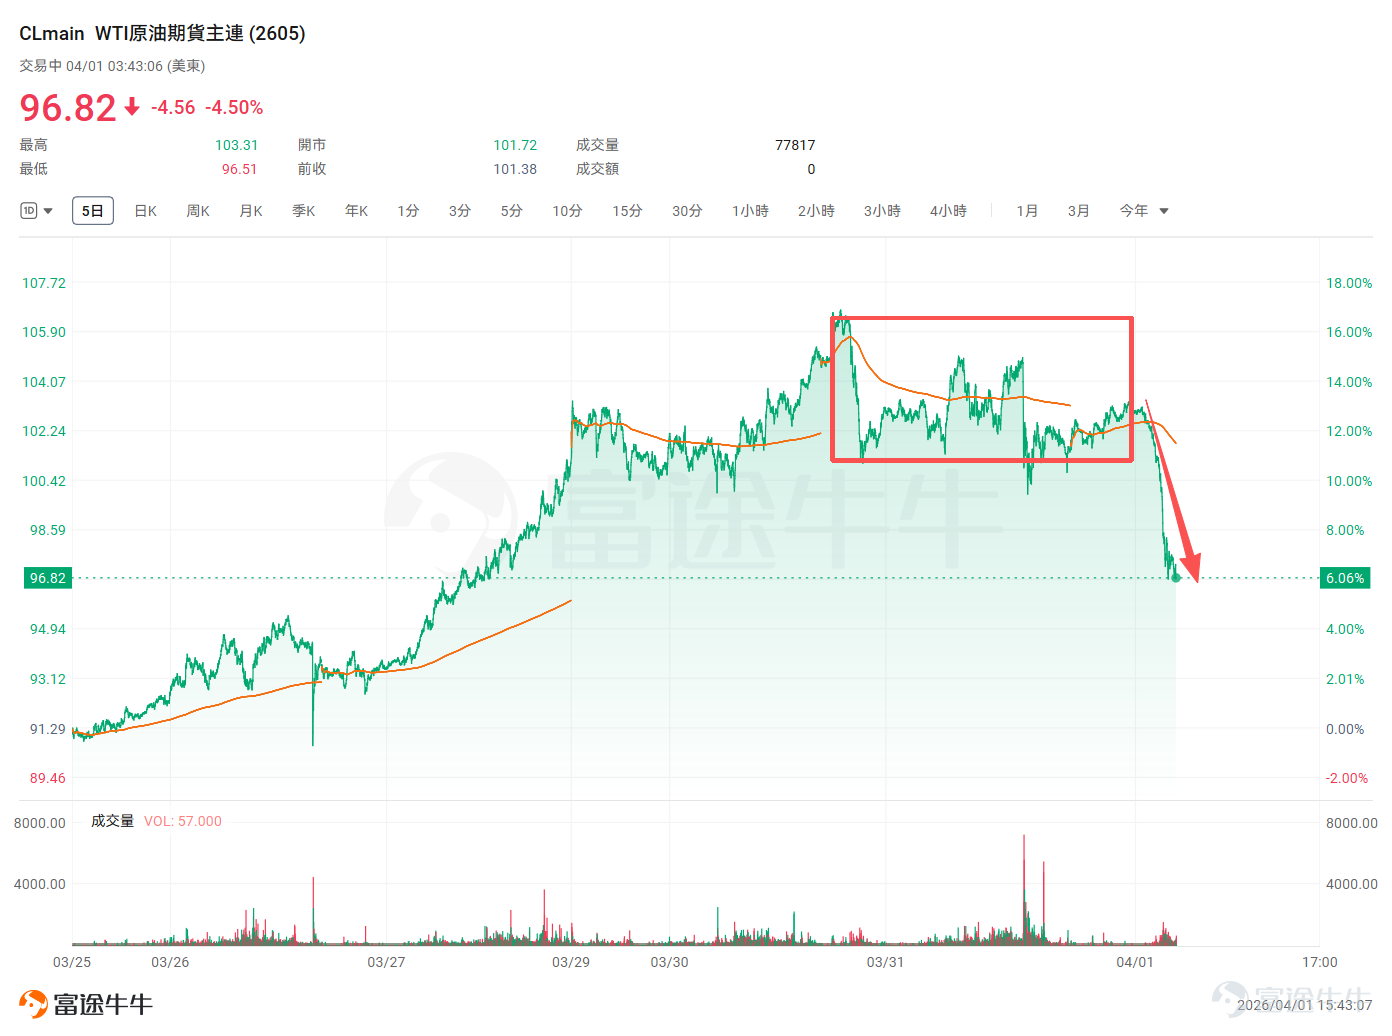
However, attentive investors may notice an 'anomaly':Yesterday, crude oil prices did not see much movement, $Crude Oil Futures (NOV6) (CLmain.US)$Prices remained stuck above $100 until a more noticeable pullback occurred this afternoon (Beijing time).
![Yesterday, the US stock market saw a long-awaited surge amid important progress in US-Iran negotiations. $S&P 500 Index (.SPX.US)$ After five consecutive weeks of decline and falling below the 250-day moving average, it finally rebounded strongly. The Asia-Pacific market today showed strong momentum, with significant gains in Japanese and South Korean stock markets, while Hong Kong stocks and A-shares also performed well. Other major asset classes such as gold and silver have also shown noticeable recovery. However, astute investors may notice an 'anomaly'.Yesterday, crude oil prices did not fluctuate significantly., $Crude Oil Futures (NOV6) (CLmain.US)$ They remained stuck above $100 until a more pronounced pullback occurred this afternoon (Beijing time). The market has been filled with mixed voices, with some institutions suggesting that this is merely a technical rebound after being oversold.The persistently high oil prices are seen by many institutions as a key signal that optimism will be difficult to sustain. Since the US-Iran conflict, 'watching oil to trade stocks' has become a strategy for many investors.What exactly happened in the crude oil market? Is the resurgence of risk assets a brief rally or a reversal of the trend? Crude oil: Near-term elevated, long-term already loosening We have previously provided a detailed analysis of the differences between the crude oil market and the precious metals market, explaining the significant impact of the term structure on the crude oil market and related ETF products like USO. Fellow investors who are interested can review it~ [Share Link: Hormuz, Term Structure, and USO: How to Navigate the Energy Storm] In simple terms: The proximal end (that is, the "..." we see in the news](https://nnqimage.futunn.com/sns_client_feed/999908/20260401/web-1775037859655-dDJwHELYLk.png/big?area=2&is_public=true&imageMogr2/ignore-error/1/format/webp)
Various opinions emerged in the market, with some institutions suggesting that this was merely a technical rebound after being oversold,The still-high oil prices were seen by multiple institutions as a key signal that optimism would be hard to sustain. Since the U.S.-Iran conflict, 'trading oil to play stocks' has become a choice for many investors.What exactly is happening in the crude oil market? Is the resurgence of risk assets a brief rally or a trend reversal?
Crude Oil: Short-term spike, long-term easing
We have previously provided a detailed analysis of the differences between the crude oil market and the precious metals market, explaining the significant impact of the term structure on the crude oil market and related ETF products like USO. Interested fellow investors can revisit it~
In simple terms:
The front end (the “oil price” we see in the news, corresponding to the 'main futures contract' on trading platforms)Reflects the "present"; navigation through the Strait of Hormuz is still in recovery, and actual physical supply disruptions have not been fully resolved, keeping short-term oil prices firm.
![Yesterday, the US stock market saw a long-awaited surge amid important progress in US-Iran negotiations. $S&P 500 Index (.SPX.US)$ After five consecutive weeks of decline and falling below the 250-day moving average, it finally rebounded strongly. The Asia-Pacific market today showed strong momentum, with significant gains in Japanese and South Korean stock markets, while Hong Kong stocks and A-shares also performed well. Other major asset classes such as gold and silver have also shown noticeable recovery. However, astute investors may notice an 'anomaly'.Yesterday, crude oil prices did not fluctuate significantly., $Crude Oil Futures (NOV6) (CLmain.US)$ They remained stuck above $100 until a more pronounced pullback occurred this afternoon (Beijing time). The market has been filled with mixed voices, with some institutions suggesting that this is merely a technical rebound after being oversold.The persistently high oil prices are seen by many institutions as a key signal that optimism will be difficult to sustain. Since the US-Iran conflict, 'watching oil to trade stocks' has become a strategy for many investors.What exactly happened in the crude oil market? Is the resurgence of risk assets a brief rally or a reversal of the trend? Crude oil: Near-term elevated, long-term already loosening We have previously provided a detailed analysis of the differences between the crude oil market and the precious metals market, explaining the significant impact of the term structure on the crude oil market and related ETF products like USO. Fellow investors who are interested can review it~ [Share Link: Hormuz, Term Structure, and USO: How to Navigate the Energy Storm] In simple terms: The proximal end (that is, the "..." we see in the news](https://nnqimage.futunn.com/sns_client_feed/999908/20260401/web-1775037859653-2sos2go0km.png/big?area=2&is_public=true&imageMogr2/ignore-error/1/format/webp)
Source: Bloomberg. As of March 31, 2026.
The long end reflects "expectations."—The market has begun pricing in an end to the conflict in the coming weeks.The decline in forward contracts indicates that traders are gradually unwinding positions that had bet on a prolonged conflict.
We can observe that the movement of long-dated contracts (CL 2612, the December 2026 WTI contract, blue line) over the past few days has beenSignificantly weaker than the main contract (green line).
![Yesterday, the US stock market saw a long-awaited surge amid important progress in US-Iran negotiations. $S&P 500 Index (.SPX.US)$ After five consecutive weeks of decline and falling below the 250-day moving average, it finally rebounded strongly. The Asia-Pacific market today showed strong momentum, with significant gains in Japanese and South Korean stock markets, while Hong Kong stocks and A-shares also performed well. Other major asset classes such as gold and silver have also shown noticeable recovery. However, astute investors may notice an 'anomaly'.Yesterday, crude oil prices did not fluctuate significantly., $Crude Oil Futures (NOV6) (CLmain.US)$ They remained stuck above $100 until a more pronounced pullback occurred this afternoon (Beijing time). The market has been filled with mixed voices, with some institutions suggesting that this is merely a technical rebound after being oversold.The persistently high oil prices are seen by many institutions as a key signal that optimism will be difficult to sustain. Since the US-Iran conflict, 'watching oil to trade stocks' has become a strategy for many investors.What exactly happened in the crude oil market? Is the resurgence of risk assets a brief rally or a reversal of the trend? Crude oil: Near-term elevated, long-term already loosening We have previously provided a detailed analysis of the differences between the crude oil market and the precious metals market, explaining the significant impact of the term structure on the crude oil market and related ETF products like USO. Fellow investors who are interested can review it~ [Share Link: Hormuz, Term Structure, and USO: How to Navigate the Energy Storm] In simple terms: The proximal end (that is, the "..." we see in the news](https://nnqimage.futunn.com/sns_client_feed/999908/20260401/web-1775037859656-Pvoq5yW7M3.png/big?area=2&is_public=true&imageMogr2/ignore-error/1/format/webp)
The loosening of the term structure, characterized by a strong front-end and a collapsing back-end, sends out a clear rebalancing signal:
Despite continuous news headlines, the dominant logic in the crude oil market has shifted from “geopolitical crisis game” to “declining risk expectations.” Previously, any news of escalating conflict drove up oil prices across all maturities; now, signs of easing can more swiftly and severely depress long-term prices, indicating a divergence within the bullish camp.
The bifurcation in the term structure reflects the complex situation where ‘spot battles continue while expectations of peace talks have begun.’ Near-term prices carry unresolved real supply risks, while far-end prices trade on optimistic expectations that the conflict may be nearing an end. This split is the result of the market conducting a detailed breakdown and pricing of the ‘war premium.’
Crude oil prices surged nearly 40% in March, accumulating a massive amount of long positions. The loosening of the term structure (sharp declines in the far end) provided an orderly exit path for these funds. Profit-taking tends to close out long positions in the far end first, as this portion’s ‘expectation premium’ is the most speculative, thereby exacerbating the collapse of far-end prices and creating intrinsic rebalancing pressure in the market.
US stocks: The ‘Bluff-Taco’ cycle was broken this week; focus on the bull-bear dividing line
The previous trading rhythm of the market exhibited a typical ‘Bluff-Taco’ pattern, meaning a decline on Friday due to concerns about an escalation over the weekend, followed by a rebound on Monday in response to potential easing signals. This pattern became a ‘barometer’ of short-term market sentiment amid the ongoing US-Iran conflict.
Bluff effect (Friday drop): 'Bluff' means 'bragging' or 'intimidation.' During conflicts, both sides often increase their bargaining power by making tough statements or exerting military deterrence before the weekend.As the weekend approaches each week, market participants tend to reduce their positions to avoid uncertainty risks due to concerns that the US-Iran situation may suddenly escalate or an uncontrollable event could occur during the market closure.This risk-averse selling pressure caused the market to decline on Friday, reflecting the 'panic trading' characteristics in the early stages of the conflict.
The 'Taco' effect (Monday's rise): After the two-day weekend, if the geopolitical situation does not deteriorate drastically, or shows potential 'easing signals' (for example, Trump's social media posts), market panic eases.This logic echoes the concept of 'TACO' (Trump Always Chickens Out), meaning that the market expects the conflicting parties will often retreat or negotiate after exerting maximum pressure, thus boosting risk appetite.
Since the outbreak of the US-Iran conflict,Every weekend in March has shown this cycle. From March 6th to 23rd, it happened for three consecutive weeks.
But this week was different. Last Friday (March 28th) saw another rout in US stocks as usual. According to the 'Taco pattern,' Monday should have rebounded, but instead, it fell further and then rebounded strongly on Tuesday (March 31st), surpassing expectations.
This level of rebound occurred as the three major US stock indexes broke below the MA 250 bull-bear dividing line. Breaking below it indicates a possible shift to a bearish mid-term trend.However, if there is a rapid recovery after a breakdown, it is often regarded as a 'false breakdown' or 'shakeout,' which instead becomes a strong buy signal from a technical perspective.
![Yesterday, the US stock market saw a long-awaited surge amid important progress in US-Iran negotiations. $S&P 500 Index (.SPX.US)$ After five consecutive weeks of decline and falling below the 250-day moving average, it finally rebounded strongly. The Asia-Pacific market today showed strong momentum, with significant gains in Japanese and South Korean stock markets, while Hong Kong stocks and A-shares also performed well. Other major asset classes such as gold and silver have also shown noticeable recovery. However, astute investors may notice an 'anomaly'.Yesterday, crude oil prices did not fluctuate significantly., $Crude Oil Futures (NOV6) (CLmain.US)$ They remained stuck above $100 until a more pronounced pullback occurred this afternoon (Beijing time). The market has been filled with mixed voices, with some institutions suggesting that this is merely a technical rebound after being oversold.The persistently high oil prices are seen by many institutions as a key signal that optimism will be difficult to sustain. Since the US-Iran conflict, 'watching oil to trade stocks' has become a strategy for many investors.What exactly happened in the crude oil market? Is the resurgence of risk assets a brief rally or a reversal of the trend? Crude oil: Near-term elevated, long-term already loosening We have previously provided a detailed analysis of the differences between the crude oil market and the precious metals market, explaining the significant impact of the term structure on the crude oil market and related ETF products like USO. Fellow investors who are interested can review it~ [Share Link: Hormuz, Term Structure, and USO: How to Navigate the Energy Storm] In simple terms: The proximal end (that is, the "..." we see in the news](https://nnqimage.futunn.com/sns_client_feed/999908/20260401/web-1775037859653-1Y9pr3E6ED.png/big?area=2&is_public=true&imageMogr2/ignore-error/1/format/webp)
The current situation reflects a technical rebound after breaking through key moving averages, coupled with an emotional rebound driven by easing geopolitical tensions. For most investors, moderate participation is possible, but chasing the rally with full positions should be avoided. If the S&P 500 fails to stabilize above the 250-day moving average within a week,警惕二次探底的风险警惕二次探底的风险警惕二次探底的风险 the risk of a double-bottom scenario needs to be heeded.
Key focus going forward: the evolution of geopolitical risks
Geopolitical developments remain the "master switch" for pricing all assets in the short term, and their trajectory will significantly influence the quality of this market rebound.
Iran's national mourning period will begin onApril 9, which is seen as a potential policy turning point. Meanwhile,出于国内政治考量driven by domestic political considerations, the U.S. also has incentives to push for peace talks aroundMid-to-late April. The next two weeks will be critical for observing whether the situation can shift from 'high-intensity conflict' to 'manageable confrontation.' The most likely scenario is one of 'fighting while negotiating,反复拉锯repeated tug-of-war.' Both sides will use military actions to gain leverage for negotiations, leading to alternating market sentiment volatility, while also being cautious of a negative cycle involving 'stalled negotiations and military escalation.'
In terms of specific observation indicators, there are several signals worth tracking continuously.
Firstly, actual navigation data for the Strait of HormuzThis is the hardest indicator to assess whether supply risks have truly been resolved, more truthful than any political statement. As long as shipping volumes have not returned to pre-conflict levels, oil prices will struggle to see a substantial decline.
Secondly, attention should be paid to whether the targets of both sides' strikes are spilling over.Currently, the conflict is mainly concentrated at the military facility level, but if the fighting spreads to energy infrastructures in major oil-producing countries such as Saudi Arabia and the UAE, it would immediately trigger an extreme scenario of surging oil prices and collapsing global risk assets. This is the biggest 'tail risk' at present.
The third aspect is the progress of diplomatic mediation.For instance, whether there has been a breakthrough declaration by a third-party mediator, which is often the catalyst for the situation to shift from 'fighting while talking' to a 'genuine ceasefire.'
Furthermore, investors looking to more keenly capture changes in market expectations are advised to monitor.the price trends of forward crude oil futures (contracts expiring in six months or more).As we analyzed earlier, near-term oil prices are supported by actual supply disruptions and will be difficult to significantly drop in the short term, but longer-dated contracts better reflect the market's true expectations regarding the direction of the conflict.
Options strategy
Geopolitical risks have not yet fully subsided. $SPDR S&P 500 ETF (SPY.US)$ and $Invesco QQQ Trust (QQQ.US)$ Index option ETFs such as SPY and QQQ are showing high IV premiums, with the current Put/Call Ratio being extremely high (SPY 1.71, QQQ 1.41), indicating strong market hedging demand.
![Yesterday, the US stock market saw a long-awaited surge amid important progress in US-Iran negotiations. $S&P 500 Index (.SPX.US)$ After five consecutive weeks of decline and falling below the 250-day moving average, it finally rebounded strongly. The Asia-Pacific market today showed strong momentum, with significant gains in Japanese and South Korean stock markets, while Hong Kong stocks and A-shares also performed well. Other major asset classes such as gold and silver have also shown noticeable recovery. However, astute investors may notice an 'anomaly'.Yesterday, crude oil prices did not fluctuate significantly., $Crude Oil Futures (NOV6) (CLmain.US)$ They remained stuck above $100 until a more pronounced pullback occurred this afternoon (Beijing time). The market has been filled with mixed voices, with some institutions suggesting that this is merely a technical rebound after being oversold.The persistently high oil prices are seen by many institutions as a key signal that optimism will be difficult to sustain. Since the US-Iran conflict, 'watching oil to trade stocks' has become a strategy for many investors.What exactly happened in the crude oil market? Is the resurgence of risk assets a brief rally or a reversal of the trend? Crude oil: Near-term elevated, long-term already loosening We have previously provided a detailed analysis of the differences between the crude oil market and the precious metals market, explaining the significant impact of the term structure on the crude oil market and related ETF products like USO. Fellow investors who are interested can review it~ [Share Link: Hormuz, Term Structure, and USO: How to Navigate the Energy Storm] In simple terms: The proximal end (that is, the "..." we see in the news](https://nnqimage.futunn.com/sns_client_feed/999908/20260401/web-1775037859651-U5LyOdcRWz.png/big?area=2&is_public=true&imageMogr2/ignore-error/1/format/webp)
(1) Opportunistic Bottom Fishing: Cash-Secured Put
The current market is in a technically rebound phase driven by expectations of easing geopolitical tensions. Investors can focus on deploying cash-secured puts near the MA 250 line mentioned above. This essentially presets a cost-effective entry point for a potential technical pullback while enhancing returns or cushioning potential losses through premium collection.
The strike price should be set at a strong support level where you are willing to take delivery of the underlying asset. For example, it can be positioned slightly below the MA 250. This provides a safety buffer for stock price fluctuations and aligns with the technical support zone that may come into play if the rebound fails.
It is important to note that in a highly volatile market environment, sufficient cash must be reserved to cover the exercise obligation, ensuring the 'cash-secured' nature of the strategy and eliminating margin risk.
![Yesterday, the US stock market saw a long-awaited surge amid important progress in US-Iran negotiations. $S&P 500 Index (.SPX.US)$ After five consecutive weeks of decline and falling below the 250-day moving average, it finally rebounded strongly. The Asia-Pacific market today showed strong momentum, with significant gains in Japanese and South Korean stock markets, while Hong Kong stocks and A-shares also performed well. Other major asset classes such as gold and silver have also shown noticeable recovery. However, astute investors may notice an 'anomaly'.Yesterday, crude oil prices did not fluctuate significantly., $Crude Oil Futures (NOV6) (CLmain.US)$ They remained stuck above $100 until a more pronounced pullback occurred this afternoon (Beijing time). The market has been filled with mixed voices, with some institutions suggesting that this is merely a technical rebound after being oversold.The persistently high oil prices are seen by many institutions as a key signal that optimism will be difficult to sustain. Since the US-Iran conflict, 'watching oil to trade stocks' has become a strategy for many investors.What exactly happened in the crude oil market? Is the resurgence of risk assets a brief rally or a reversal of the trend? Crude oil: Near-term elevated, long-term already loosening We have previously provided a detailed analysis of the differences between the crude oil market and the precious metals market, explaining the significant impact of the term structure on the crude oil market and related ETF products like USO. Fellow investors who are interested can review it~ [Share Link: Hormuz, Term Structure, and USO: How to Navigate the Energy Storm] In simple terms: The proximal end (that is, the "..." we see in the news](https://nnqimage.futunn.com/sns_client_feed/999908/20260401/web-1775037859654-QATRZlFYZI.png/big?area=2&is_public=true&imageMogr2/ignore-error/1/format/webp)
(The design images displayed on screen are for illustrative purposes only and do not constitute any investment advice or guarantees; market conditions fluctuate frequently, and the option prices shown do not represent real-world values.)
(2) Moderately Bearish: Bear Put Spread
If investors believe the market's shift from 'panic trading' to 'easing trading' will not happen overnight and may experience reversals along the way.Bear Put Spread StrategyBy simultaneously buying and selling put options with different strike prices at a limited cost, this strategy expresses a moderately bearish view, suitable for an environment where the market is expected to weaken or undergo a minor correction.
Buy a put option with a higher strike price (close to the current market price or slightly out-of-the-money) and simultaneously sell a put option with the same expiration date but a lower strike price (more out-of-the-money).
Compared to directly buying put options, this strategy significantly reduces premium costs and time value decay, improving capital efficiency and success rates in mildly declining markets. It locks both risk and reward within a limited range, making it a cost-controlled defensive/offensive choice in uncertain but slightly bearish volatile markets.
![Yesterday, the US stock market saw a long-awaited surge amid important progress in US-Iran negotiations. $S&P 500 Index (.SPX.US)$ After five consecutive weeks of decline and falling below the 250-day moving average, it finally rebounded strongly. The Asia-Pacific market today showed strong momentum, with significant gains in Japanese and South Korean stock markets, while Hong Kong stocks and A-shares also performed well. Other major asset classes such as gold and silver have also shown noticeable recovery. However, astute investors may notice an 'anomaly'.Yesterday, crude oil prices did not fluctuate significantly., $Crude Oil Futures (NOV6) (CLmain.US)$ They remained stuck above $100 until a more pronounced pullback occurred this afternoon (Beijing time). The market has been filled with mixed voices, with some institutions suggesting that this is merely a technical rebound after being oversold.The persistently high oil prices are seen by many institutions as a key signal that optimism will be difficult to sustain. Since the US-Iran conflict, 'watching oil to trade stocks' has become a strategy for many investors.What exactly happened in the crude oil market? Is the resurgence of risk assets a brief rally or a reversal of the trend? Crude oil: Near-term elevated, long-term already loosening We have previously provided a detailed analysis of the differences between the crude oil market and the precious metals market, explaining the significant impact of the term structure on the crude oil market and related ETF products like USO. Fellow investors who are interested can review it~ [Share Link: Hormuz, Term Structure, and USO: How to Navigate the Energy Storm] In simple terms: The proximal end (that is, the "..." we see in the news](https://nnqimage.futunn.com/sns_client_feed/999908/20260401/web-1775038345898-EaACZJY9hg.png/big?area=2&is_public=true&imageMogr2/ignore-error/1/format/webp)
(The design images displayed on screen are for illustrative purposes only and do not constitute any investment advice or guarantees; market conditions fluctuate frequently, and the option prices shown do not represent real-world values.)
Finally, here's a small perk for fellow investors—welcome to claim it!Options Beginner Pack
This event is exclusively for invited HK users, click to learn moreDetailed event rules >>
Futu's simulated trading challenge is now open for registration! Zero cost, zero risk, and you could win stock cash vouchers!For more details, click here
![Yesterday, the US stock market saw a long-awaited surge amid important progress in US-Iran negotiations. $S&P 500 Index (.SPX.US)$ After five consecutive weeks of decline and falling below the 250-day moving average, it finally rebounded strongly. The Asia-Pacific market today showed strong momentum, with significant gains in Japanese and South Korean stock markets, while Hong Kong stocks and A-shares also performed well. Other major asset classes such as gold and silver have also shown noticeable recovery. However, astute investors may notice an 'anomaly'.Yesterday, crude oil prices did not fluctuate significantly., $Crude Oil Futures (NOV6) (CLmain.US)$ They remained stuck above $100 until a more pronounced pullback occurred this afternoon (Beijing time). The market has been filled with mixed voices, with some institutions suggesting that this is merely a technical rebound after being oversold.The persistently high oil prices are seen by many institutions as a key signal that optimism will be difficult to sustain. Since the US-Iran conflict, 'watching oil to trade stocks' has become a strategy for many investors.What exactly happened in the crude oil market? Is the resurgence of risk assets a brief rally or a reversal of the trend? Crude oil: Near-term elevated, long-term already loosening We have previously provided a detailed analysis of the differences between the crude oil market and the precious metals market, explaining the significant impact of the term structure on the crude oil market and related ETF products like USO. Fellow investors who are interested can review it~ [Share Link: Hormuz, Term Structure, and USO: How to Navigate the Energy Storm] In simple terms: The proximal end (that is, the "..." we see in the news](https://nnqimage.futunn.com/sns_client_feed/999908/20260401/web-1775037859655-NmNVGSh2bA.webp/big?area=2&is_public=true&imageMogr2/ignore-error/1/format/webp)
Disclaimer
This content does not constitute any offer, solicitation, recommendation, opinion, or guarantee of any securities, financial products, or tools. The risk of loss in buying and selling options can be substantial. In some cases, your losses may exceed the initial margin amount deposited. Even if you set contingent orders, such as 'stop-loss' or 'limit' orders, these may not necessarily prevent losses. Market conditions may make these orders unexecutable. You might be required to deposit additional margin within a short period. If you fail to provide the required amount within the specified time, your open positions may be liquidated. However, you will still be responsible for any account deficit arising from this. Therefore, before trading, you should study and understand options and carefully consider whether such trading suits you based on your financial situation and investment objectives. If you trade options, you should be familiar with the procedures upon exercising options and at expiration, as well as your rights and obligations when exercising options and at expiration.
Risk Disclaimer: The above content only represents the author's view. It does not represent any position or investment advice of Futu. Futu makes no representation or warranty.Read more

Comment (1)
to post a comment
4
8