
Strong rebound in March non-farm payroll! Will there still be a rate cut this year?

[Harvest Macro] | Global Financial Markets Weekly Report 20260401
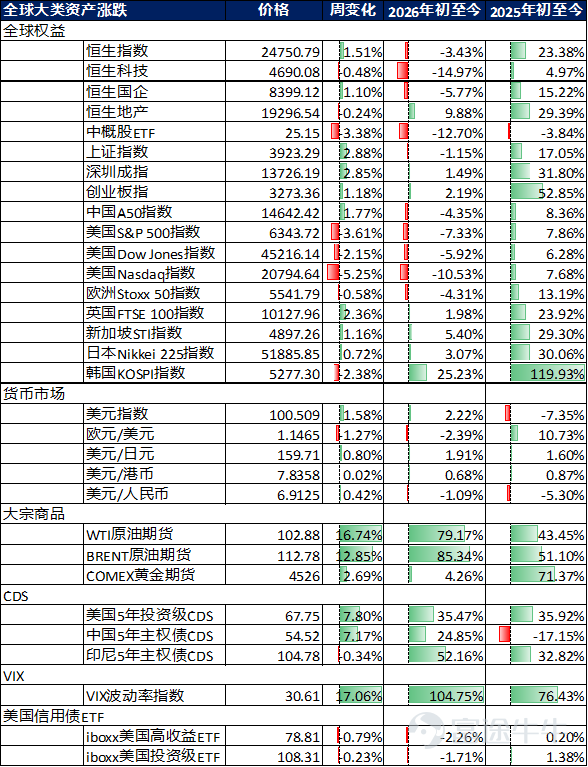
Market performance over the past week
Data Source: Bloomberg and HARVEST
Global capital flows
According to EPFR data, during the week of March 18 – March 25, global equity markets turned to net outflows, while the bond market recorded net inflows for the 48th consecutive week (last week’s net inflow was 2.75 billion USD). Specifically, mainland China's A-share market turned to net inflows (last week’s net inflow was 0.36 billion USD); Hong Kong stocks turned to net outflows last week (last week’s net outflow was 0.074 billion USD); emerging markets turned to net inflows (last week’s net inflow was 0.55 billion USD); the US stock market turned to net outflows (last week’s net outflow was 27.02 billion USD); developed European stock markets turned to net outflows (last week’s net outflow was 3.4 billion USD); Japan's stock market recorded net inflows for the 15th consecutive week (last week’s net inflow was 0.36 billion USD).
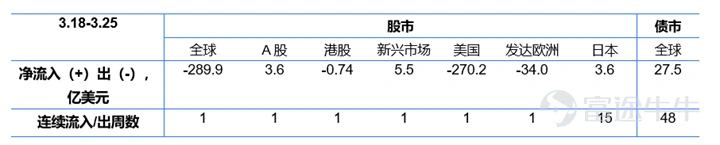
Data source: EPFR and Harvest
Stock market
Review and Outlook of the Past Week
United States:
This week (March 20 – March 27, 2026), the US stock market exhibited a triple dynamic of 'escalating geopolitical conflicts, persistent inflation, and contracting rate-cut expectations,' with the market continuing its weak downward trend amid intensifying selling pressure. The battle between bulls and bears intensified, with the bears taking the upper hand. Sector divergence eased slightly but the overall market experienced widespread declines, with both large-cap and small-cap stocks under pressure, resulting in a 'continued downturn and extended losses' pattern. By the end of the reporting period, the Nasdaq Composite Index closed at 20,948.357 points, falling by 3.23% this week. Impacted by the pullback in AI-related sectors, valuation pressures on tech giants, and soaring energy prices, the index showed a 'unilateral decline and weak rebound' characteristic, with volatility widening further compared to last week, leading among the three major indices; the Dow Jones Industrial Average closed at 45,166.64 points, declining by 0.90% this week, marking its fifth consecutive weekly drop. Industrials and financial sectors remained under pressure, compounded by cost pressures from high oil prices and risk-off sentiment due to geopolitical tensions, causing component stocks to test new lows, with sporadic minor rebounds that failed to sustain; the Standard & Poor's 500 Index closed at 6,368.85 points, declining by 1.67% this week, also recording five straight weeks of losses. Both large-cap and small-cap stocks retreated in tandem, with defensive sectors such as consumer staples and healthcare providing little support, unable to offset concentrated sell-offs in technology and cyclical sectors, exhibiting an 'overall weakening and lack of support' pattern. In terms of style, small-cap value stocks held up relatively better, while large-cap growth stocks initiated a new round of declines, particularly led by M7. On the sector level, materials, energy, and utilities within HALO industries rose, while communications and information technology fell sharply.
In the short term, four core risk factors require close attention. First, the risk of policy expectation revision: if subsequent Fed officials issue more hawkish signals or if persistently surging oil prices trigger a rebound in inflation data, it may further suppress market expectations for rate cuts, triggering further corrections in tech stocks and exacerbating broad market volatility. Second, rising stagflation risks: if economic data continues to weaken and inflationary pressures mount, it could escalate concerns about stagflation, prompting further capital flight and worsening market declines. Third, geopolitical and energy price risks: continued escalation in the Middle East could keep pushing oil prices higher, reinforcing sticky inflation, while a strong dollar index might further weigh on risky assets, creating dual disturbances that will continue to impact market risk appetite. Fourth, structural risks in the market: extreme concentration in US equities, AI bubbles, and high leverage in options have not yet fully unwound, potentially triggering concentrated corrections in certain sectors, which could then spread across the entire market. From a pricing perspective, the current market bears similarities to 2022—unlike the worst-case scenario in April 2025 that triggered a one-time panic sell-off, at this stage, facing geopolitical uncertainty, US equities are unlikely to quickly price in extreme pessimism but will gradually adjust based on geopolitical developments, Fed stance, and economic data. Unlike Asia-Pacific and Europe, the direct impact of oil prices on production in the US is limited; the key variable lies in interest rate trends and their effects on AI financing and investment, which form the biggest fundamental backdrop for US equities today. The duration of hawkish interest rate pricing is a drain on US equities, and going forward, two layers of博弈 need monitoring: first, the duration of oil price increases—in the absence of a meaningful retreat in Brent crude, market sentiment is unlikely to improve significantly; second, the Fed’s attitude toward high oil prices, where differing policy orientations among Fed members will affect quarterly-level interest rate pricing. The market currently fears Powell remaining in office while Wash's nomination stalls. The timeline for smooth progress includes the DOJ withdrawing its lawsuit against Powell by early April, the Senate voting through as early as mid-to-late April, and Wash taking office after May 15. A DOJ shift could temporarily boost market optimism, but uncertainties remain. Overall, if geopolitical conflict does not escalate to ground troop advances, the market's oversold rebound potential could be substantial; conversely, if conflict continues to escalate, the market will reduce positions and slowly decline, awaiting temporary relief after Wash is nominated, with true respite possibly arriving only by mid-June after his first speech. Upcoming releases of key US Core PCE price indices, more earnings reports from tech giants, and speeches from Fed officials will become critical variables influencing market movements. In summary, the short-term market remains entangled in a quadruple logic of 'hawkish policy solidification, rising stagflation risks, increasing geopolitical disturbances, and accumulating structural risks,' with index declines and continuous downtrends unlikely to reverse quickly, and the three major indices likely to remain in a weak adjustment phase.
Japan:
This week (March 20 – March 27, 2026), Japan's stock market exhibited a three-phase characteristic of 'core index rebounding, tech sectors stabilizing and warming up, and easing of bull-bear battles.' The core drivers revolved around marginal improvements in global memory chip demand, stabilization of the yen exchange rate, and reversal of foreign capital flows, coupled with the release of earlier oversold rebound momentum and sector rotation recovery, forming a balanced bull-bear contest and volatile upward trend, ultimately closing the week with significant gains, reversing the previous weak momentum. This week's core issues focused on three dimensions: first, the structural contradiction between improving sentiment in memory chips and AI tech sectors versus sluggish recovery in traditional industries; second, the contradiction between the stabilization of the yen exchange rate and profit recovery for export-oriented companies; third, the contradiction between policy-driven support and the dual constraints of high debt and high interest rates. At the broader market level, the overall trend showed 'oversold rebound and resilient recovery,' with investor sentiment shifting from cautiousness to optimism, evident signs of capital inflows, and large-scale foreign purchases effectively easing market selling pressure. Regarding core indices, the Nikkei 225 performed strongly throughout the week, closing at 53,373.07 points, gaining 1,857.58 points from last week, narrowing year-to-date losses to -0.83%, ending the prior continuous downtrend. Driven by the tech sector's recovery and foreign capital inflows, the index consistently rose, showing 'volatile recovery and strong rebound' characteristics. On March 25, it surged by 2.87% in a single day, marking the largest daily gain of the week, peaking at 54,175.80 points. Despite brief pullbacks, the upward trend was clear, successfully recovering some lost ground. Sector performance displayed 'differentiated recovery, distinct strength and weakness': the tech sector led the market, with semiconductors and AI-related stocks posting significant gains. Kioxia's share price rose more than 5% cumulatively during the week, effectively boosting the index movement. Traditional industries performed differently, with utilities and pharmaceuticals sectors warming up simultaneously, while traditional manufacturing and export-oriented sectors remained pressured by US tariff policies. The consumer sector relied on domestic demand recovery to show moderate growth, becoming a crucial market support, effectively offsetting selling pressures in some sectors.
Eurozone:
This week (March 20-27), European stock markets exhibited core characteristics of a 'broad-based weakening across the pan-European indices, divergent declines among core national indices, and escalating multi-directional battles.' The implementation of the EU-US trade agreement, stable ECB policies, and structural strength in the renewable energy sector provided phased support. Simultaneously, prolonged Middle Eastern conflicts pushed up energy prices, weak recovery in Germany's manufacturing sector, and latent negative impacts from the EU-US trade deal acted as major suppressive factors. Coupled with sector rotation divergence (renewable energy and green tech sectors strengthened while traditional industrial and energy sectors faced pressure), this formed a pattern of 'pan-European declines amid volatility and exacerbated national-level divergence.' Market caution continued to spread, worries about economic recovery further intensified, and capital showed features of 'structural positioning and pronounced risk aversion.' At the pan-European level, the Stoxx 600 index weakened throughout the week, closing slightly lower at 574.92 points, down 1.86 points from last week, with year-to-date losses expanding to -6.01%, failing to maintain the previous trend of stabilization amidst volatility, and upward momentum continued to weaken. Market data also showed that global funds maintained a cautious stance towards European stocks, with risk-averse funds continuously flowing out of cyclical sectors, and bearish sentiment somewhat rising. Core national indices showed 'divergent declines with clear strengths and weaknesses,' unable to form a unified trend to halt the fall: the UK FTSE displayed relatively resilient performance, closing slightly higher for the week at 9967.35 points, up 73.20 points from last week, with year-to-date losses narrowing to -3.32%, supported by warming in the renewable energy sector and a slight retreat in inflation data, showing an overall 'volatile consolidation with relatively strong resilience.' The French CAC40 index declined amidst volatility, closing at 7701.95 points, down 24.25 points from last week, with year-to-date losses widening to -6.51%, weighed down by weak domestic consumption data, pressure on export sectors, and rising energy prices, showing an overall 'volatile consolidation with weak rebound.' The German DAX index plummeted, closing at 22300.75 points, down 353.11 points from last week, with year-to-date losses widening to -8.94%, affected by obstructed manufacturing recovery and surging energy costs, compounded by lagging effects of rising logistics costs due to blocked shipping routes in the Middle East, showing 'testing new lows amidst volatility and increasing selling pressure,' breaking through short-term support levels multiple times during the week. The Italian MIB index rose against the trend, closing at 43379.10 points, up 189.30 points from last week, with year-to-date losses narrowing to -5.33%, benefiting from rising expectations of domestic infrastructure investment and continuous EU policy support, alleviating market selling pressure, showing 'recovering amidst volatility with prominent resilience.'
Emerging Markets:
South Korea
This trading week, South Korean stock markets exhibited core characteristics of 'AI valuation recovery—foreign capital returning to buy the dip—volatile rebound,' with the core contradiction focused on the deep game between 'AI valuation recovery momentum and external disturbance pressures.' Bullish and bearish forces waxed and waned, ultimately leading to increased volatility and overall gains, gradually reviving upward momentum and reversing the previous weak trend. On one hand, the global AI industry chain continued to recover, marginal improvement in semiconductor industry demand, and export benefits brought by the depreciation of the Korean won provided strong support, compounded by phased positive news release in the semiconductor sector. Leading companies like Samsung Electronics and SK Hynix continued to perform strongly, reinforcing the technology track's supportive role to some extent, driving market sentiment recovery. On the other hand, fluctuations in foreign holdings triggered market volatility; concerns over AI bubbles had not completely dissipated, and high sector valuations brought technical correction pressures. Additionally, this week saw alternating phases of foreign capital inflows and profit-taking, with significant daily trading volume fluctuations, further exacerbating short-term market volatility, highlighting the balanced tug-of-war situation, forming a stark contrast to the previous pattern of continuous foreign outflows and local capital bottom-fishing. Moreover, the retreat of international oil prices from highs alleviated inflation concerns, somewhat boosting AI-related stock performance—these stocks' high valuations made them increasingly sensitive to changes in interest rates and liquidity expectations, with easing inflationary pressures further releasing upward potential for the technology sector. The South Korean government's continuation of the 'oil price cap system,' coupled with the stabilization of the Korean won exchange rate, effectively alleviated energy cost pressures, gradually boosting market sentiment and providing support for the stock market recovery. Regarding core indices, the KOSPI index performed strongly, recovering amidst volatility throughout the week, closing at 5438.87 points, up 33.12 points from last week, with year-to-date gains narrowing to +5.33%, officially reversing the year's phased weak trend, displaying a fluctuation characteristic of 'bottom exploration-recovery-volatile consolidation-mild rise' during the week, successfully recovering some previously lost ground.
India
This trading week, the core contradictions in Indian stock markets revolved around the deep game between 'external liquidity improvement-domestic demand support recovery.' Expectations of marginal easing in Fed policy triggered a reversal in foreign capital flows, and the recovery momentum of domestic economic growth provided primary support, while only IT sector corrections and energy price fluctuations formed minor suppression, ultimately presenting a 'volatile recovery, end-of-day rally' trend, with indices closing sharply higher and year-to-date losses narrowing somewhat, gradually shaking off the worst start of the year in a decade. Market caution eased somewhat, investor wait-and-see sentiment marginally improved, trading volumes moderately increased, buying power gradually outweighed selling pressure, and the bull-bear tug-of-war showed a 'strong equilibrium' characteristic. Influenced by valuation recovery, improved earnings expectations, and easing geopolitical risks, foreign investors, after record capital outflows in 2025, saw their first large-scale return, further alleviating downward market pressure, and expectations of Modi's government introducing new economic growth catalysts continued to rise, further boosting market sentiment. Regarding core indices, the Nifty 50 index exhibited a three-phase characteristic of 'low opening-high running-volatile recovery-end-of-day rally,' closing at 22819.60 points, up 306.95 points from last week, with year-to-date losses narrowing to -11.01%, reversing the previous continuous downtrend. Sector performance showed 'polarization, the strong staying strong'; the financial sector continued its strong upward trend, becoming the core driver of index recovery; the consumer sector steadily recovered, with support gradually strengthening, and domestic economic recovery momentum boosted the performance of domestic demand-related sectors; IT, energy, and raw material sectors slightly retreated, dragging down index performance, with the IT sector affected by global tech sector differentiation and insufficient marginal improvement in external demand, showing relatively weak performance, highlighting the high external dependency of India's tech industry.
Vietnam.
This trading week, the core contradictions in Vietnam's stock market focused on the game between 'foreign capital inflow recovery and external disturbances, industrial shortcomings constraints,' with bullish and bearish forces gradually moving towards equilibrium, eventually resulting in a volatile recovery and sharp gains, returning to the robust pattern of regional markets and ending recent weak trends. On one hand, under the backdrop of global supply chain restructuring, foreign capital inflows warmed up, and increased domestic policy support formed strong backing, compounded by the benefits from some manufacturing enterprises' capacity release, effectively relieving market selling pressure. News such as Yangjie Technology's Vietnamese plant continuing full production and sales and Yadea Group's new factory in Vietnam smoothly starting operations continuously boosted sentiment in related sectors, driving the manufacturing sector's recovery. On the other hand, Vietnam's high dependence on low-end contract manufacturing and slow industrial upgrading shortcomings remained unimproved, compounded by Southeast Asian stock market differentiation and short-term market fluctuations, leaving upward momentum still insufficient to support a unilateral index rise. Meanwhile, marginal improvements in global demand further alleviated pressure on Vietnam's export-oriented industries, reducing market selling pressure. Regarding core indices, the Ho Chi Minh Index recovered amidst volatility, closing at 1672.80 points, up 81.63 points from last week, with year-to-date losses narrowing to -6.16%, weekly volatility gradually narrowed, overall showing a 'volatile recovery, powerful rebound' trend. From a capital perspective, foreign inflows significantly increased compared to before, effectively supporting index rises, with capital flight pressures markedly relieved, and foreign capital's supportive role in Vietnam's stock market continuously strengthened. Sector performance improved, with domestic low-end contract manufacturing industries influenced by marginal improvements in global demand, related export-oriented sectors gradually stabilizing and recovering, and core sectors like traditional manufacturing and textiles gradually improving, temporarily overshadowing the slow industrial upgrade shortcomings by market recovery sentiment. Defensive sectors steadily strengthened, forming effective support, ultimately leading to a substantial index gain, returning to the average level of regional markets.
Bond market
Past Week Review
Last week, the SOFR curve within a year showed mixed movements; US Treasury yields fell 2.4 bps for the 2-year term and rose 0.6 bps for the 10-year term. In terms of Chinese interest rates, the 3-year government bond yield dropped by 5.7 bps, and the 10-year government bond yield fell by 3.5 bps. The inversion of the China-US 10-year yield spread was 254 bps.
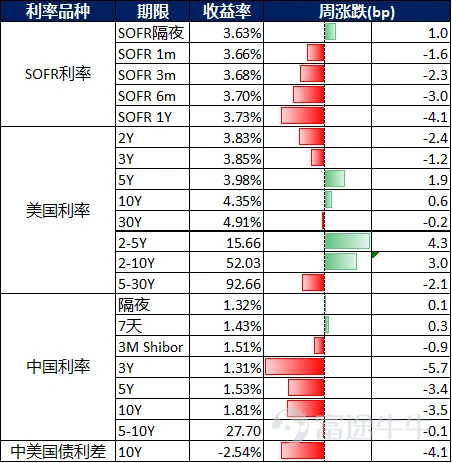
Data Source: Bloomberg and HARVEST
Government Bonds:Regarding the US dollar, the situation in the Middle East continued to develop, with the US Dollar Index rising approximately 0.7% on the week, returning above the 100 mark, having already accumulated more than a 2% increase in March. We assess that the probability of a further escalation in short-term Middle Eastern geopolitical conflicts is relatively high. On one hand, the Bab-el-Mandeb Strait may come under the control of the Houthis, exacerbating the potential upside risk for oil prices; on the other hand, the significant differences in core demands among the US, Israel, and Iran are unlikely to be resolved in the short term, with the possibility of promoting talks through conflict remaining relatively high. We expect that until the situation becomes clear and oil prices see a turning point, the US Dollar Index may continue to reflect geopolitical risk pricing, potentially breaking through the previous high of 100.5. In the medium to long term, once the conflict shows clear signs of de-escalation, vigilance against the rapid return of 'de-dollarization' trades will be necessary.
Credit bonds:Due to the escalation of geopolitical conflicts in the Middle East and the impact of market risk aversion sentiment, the issuance scale of offshore public bonds by Chinese entities in the primary market last week dropped significantly, with only one issuance totaling 1.22649 billion RMB.
Outlook:The preliminary reading of the US S&P Composite PMI for March fell to a near one-year low of 51.4. Although the manufacturing PMI unexpectedly remained in expansion territory for eight consecutive months, the services sector was significantly constrained by high uncertainty caused by the US-Iran conflict and high interest rates dampening demand, also retreating to a near one-year low. The employment indicator recorded its first decline since February 2025. Additionally, the surge in energy prices led to the largest increase in average input costs in nearly ten months, which further transmitted to the sales end, pushing the average sales price increase to a four-year high. This means that the US has shown signs of 'growth falling + inflation rising.' We believe that whether inflation expectations become 'unanchored' is the key factor influencing the Federal Reserve's policy shift at this stage, because if the energy supply shock merely pushes up short-term prices without spilling over to core prices such as services and wages, then prematurely initiating rate hikes would bring unnecessary volatility risks. Recently, the private credit sector highly tied to the US AI industry also showed risk signals, and once liquidity tightens, it might trigger a chain reaction in the financial field. Trump postponed the strike on Iran's energy facilities by another 10 days and repeatedly signaled readiness to engage in dialogue with Iran, but Iran explicitly denied starting negotiations and rejected the ceasefire proposals put forward by the US. Currently, there are significant differences in strategic objectives among the US, Israel, and Iran. Unless one party makes a 'major concession,' the room for reconciliation remains limited. While the US seeks a prudent conclusion, it continues to strengthen regional deployments and expand the scope of strikes to include civilian infrastructure like power plants, aiming to weaken Iran's national operation and resistance capabilities, significantly increasing the risk of conflict escalation. Additionally, the Houthis have formally intervened in the conflict, raising the risk of blocking the Bab-el-Mandeb Strait. The Bab-el-Mandeb Strait handles about 12% of global crude oil transportation and is also a critical alternative route for Saudi oil exports once the Strait of Hormuz is controlled. If blocked, oil prices could soar above $120 per barrel. We believe that Trump can no longer unilaterally dominate the direction of the situation, and the market has become desensitized to his statements. Whether the conflict can substantially 'de-escalate' and whether crude oil supplies can begin to recover in the short term are likely to be key factors dominating market trends.
Foreign exchange market
Offshore Renminbi: Last week's market focus was on the progress of US-Iran negotiations. Both the US and Iran proposed ceasefire conditions, but given that substantive negotiations have not started and the conflict has further escalated, market sentiment continued to worsen, and it gradually became desensitized to Trump's unilateral TACO signals. Oil prices and US Treasury yields remained highly volatile, and the US Dollar Index stabilized again above the 100 mark. Offshore RMB spot tested the 6.92 level on Monday and once retreated below 6.88, but the rise in risk aversion sentiment and oil prices led to concentrated forex purchases, combined with the strengthening of the US Dollar Index, and the spot rebounded to the 6.92 line on Friday. Regarding swaps, US Treasury yields remained highly volatile, compounded by the continued increase in Dim Sum bond supply, and the long end of the swap curve continued to face selling pressure, with the one-year rate once falling to a low of -1740 on Friday. Offshore liquidity remained abundant, with T/N and O/N returning below -5/day later in the week, and the implied yield for within one month falling to a phased low of 1%, possibly driving the market to take profits or position for a short-term rebound. Due to further escalation of the Middle Eastern geopolitical conflict, the market may start pricing in the risk of oil prices nearing $150 per barrel in the short term, and even if the conflict cools down, the oil price and inflation shocks are unlikely to quickly recede. We believe that the current market sentiment remains fragile, and vigilance is needed against sudden cooling of risk aversion sentiment triggering considerable stop-losses followed by a rebound.
US Dollar:Regarding the US dollar, the situation in the Middle East continued to develop, with the US Dollar Index rising approximately 0.7% on the week, returning above the 100 mark, having already accumulated more than a 2% increase in March. We assess that the probability of a further escalation in short-term Middle Eastern geopolitical conflicts is relatively high. On one hand, the Bab-el-Mandeb Strait may come under the control of the Houthis, exacerbating the potential upside risk for oil prices; on the other hand, the significant differences in core demands among the US, Israel, and Iran are unlikely to be resolved in the short term, with the possibility of promoting talks through conflict remaining relatively high. We expect that until the situation becomes clear and oil prices see a turning point, the US Dollar Index may continue to reflect geopolitical risk pricing, potentially breaking through the previous high of 100.5. In the medium to long term, once the conflict shows clear signs of de-escalation, vigilance against the rapid return of 'de-dollarization' trades will be necessary.
Macroeconomics
China:
International oil prices remain high, with domestic energy prices and some chemical product prices continuing to rise. High-frequency port indicators show strong export growth. The secondary housing market continues to improve, especially with the 'small spring' in first-tier cities' real estate markets extending. Production and infrastructure activities have marginally declined year-over-year. The 'price surge' from January to February drove industrial enterprise profit growth back up to 15.2%, but downstream profits (except for electronics) have somewhat declined, indicating cost pressures are becoming evident. Attention should be paid to the marginal impact of high oil prices on external demand and China's exports.
In terms of high-frequency economic activity, last week saw a decline in residents' travel activity, while industrial production showed mixed results. Transactions in the secondary housing market continued to improve, but new home sales were still declining. Exports gradually improved after the holidays, and logistics performed well. Regarding travel, subway passenger volumes in 18 cities and domestic flight numbers fell by 2.2% and 2.8% year-on-year respectively last week. In terms of industrial production, coking plant operating rates increased by 2.2 percentage points year-on-year, while blast furnace, semi-steel tire, aluminum profile, and asphalt company operating rates fell by 1.1, 4.8, 5.0, and 7.4 percentage points respectively, with construction steel trading volumes falling by an expanded 19.1%. For exports and logistics, the HDET high-frequency indicator showed that exports rose year-on-year to about 9.7% in March, while railway freight volumes increased by 1.0%, possibly boosted by a 'rush to export' ahead of the cancellation of export tax rebates in industries such as photovoltaics in April. In real estate, the area of new home transactions in 44 cities fell from -20.2% year-on-year the previous week to -25.5%, while the year-on-year decline in the area of second-hand home transactions in 22 cities narrowed, turning from -6.3% the previous week to basically flat. The year-on-year change in the area of new and second-hand home transactions in first-tier cities rebounded from -22.3%/2.5% the previous week to -24.3%/9.0%.
In terms of financial markets and funding costs, interbank liquidity was tight and the RMB/USD exchange rate fell. Interbank interest rates generally rose, with DR007/R007 increasing by 1.9/3.0 basis points respectively. The yield curve for government bonds flattened. Last week, net issuance of interest rate bonds and equity financing both fell year-on-year, while financing through real estate bonds increased year-on-year. Regarding the exchange rate, the RMB depreciated by 0.26% against the USD but appreciated by 0.12% against a basket of currencies.
Regarding important economic data and macro events: Data: 1) Industrial enterprise profit growth from January to February rebounded to 15.2% from -5.7% in Q4 of 2025, with revenue growth also rising from -2.3% in Q4 2025 to 5.3%, and the profit margin (seasonally adjusted) rising from 5.2% in Q4 2025 to 5.7%. Events: 1) The Political Bureau of the Central Committee held a meeting on March 27 to review the 'Regulations on the Work of Local Committees of the Chinese Communist Party'. 2) The Ministry of Commerce decided to initiate a trade barrier investigation into certain US practices and measures starting from March 27, 2026, to firmly safeguard the interests of related Chinese industries.
United States:
This week, four factors—ongoing escalation of geopolitical conflicts in the Middle East, lingering effects of the Federal Reserve’s interest rate decision, persistent inflation data, and a strengthening dollar index—collectively dominated market movements. The most critical issues were the Fed's increasingly hawkish stance and fears of stagflation triggered by geopolitical tensions, replacing previous policy divergence concerns to become the core variable affecting market sentiment and trends. On the Fed side, following the FOMC interest rate decision on March 19, its hawkish signals continued to ferment, driving this week's market adjustments. The meeting decided to keep the federal funds rate target range unchanged between 3.5% and 3.75%, marking the second consecutive hold this year, in line with market expectations. The dot plot clearly indicated that members widely expect only one rate cut (totaling 25 basis points) in 2026; seven out of 19 FOMC members predicted no rate cuts this year, up from six in December, further shrinking the 'dovish' camp. The long-term equilibrium rate was raised from 3.0% to 3.1%, suggesting that the Fed’s high-rate environment will persist longer, likely delaying rate cuts further. Current implied rate expectations point to the first rate cut by the end of 2027, with the probability of a rate hike in 2026 rising to 40%. Against a backdrop of a weak U.S. job market (with non-farm payrolls plummeting by 92,000 in February, unemployment climbing to 4.4%, and economic growth momentum weakening), this pricing is quite hawkish. The 10-year U.S. Treasury yield surged to 4.7% on Friday before quickly retreating, reflecting some concerns about future fundamentals. Fed Chair Powell explicitly stated in the press conference that short-term energy price increases would push up overall inflation, with uncertainty remaining regarding its scope and duration. Without substantial improvement in inflation, there would be no rate cuts, and rate hikes could not be ruled out. Monetary policy has no predetermined path and will be decided meeting-by-meeting based on economic data. Additionally, the potential impact of Trump nominating Kevin Warsh as Fed Chair continued to ferment, with markets worried that his appointment might adjust the policy pace, adding to policy uncertainty. CME’s 'FedWatch' tool showed that the market's bet on no rate cuts this year rose to 56.1%, with a 3.6% chance of a rate hike, further contracting rate cut expectations and suppressing risk assets.
Japan:
This week, three factors—the fluctuation of the yen exchange rate, Bank of Japan monetary policy, and marginal improvement in the tech industry’s business conditions—jointly shaped market dynamics. Core contradictions included the structural disparity between improving storage chips and AI tech sectors versus sluggish traditional industries, the conflict between the yen stabilizing and exporters’ earnings recovery, and the dual constraints of policy support versus high debt and high interest rates. These contradictions intertwined, guiding market sentiment, driving index volatility, and alleviating downward pressure. On the monetary front, the stabilization of the yen dominated market sentiment, with BOJ policies maintaining stability and expectations converging, further reducing market volatility. This week, the yen stabilized against both the dollar and the yuan, driven by narrowing U.S.-Japan interest rate differentials and expectations of easing global dollar liquidity, directly impacting Japanese exporters’ earnings and stock performance. The stabilization of the yen temporarily eased uncertainties over exporters’ profitability. Coupled with the gradual digestion of the impact of U.S. tariffs on Japanese exporters, expectations for earnings recovery among export companies warmed, boosting related stock performances. Regarding key economic and market dynamics, the marginal improvement in the tech sector became a significant positive driver. Global demand for memory chips gradually recovered, with price declines easing, alongside a revival in the AI supply chain, leading to marginal order improvements for Japanese semiconductor firms and boosting the entire tech sector. This became a core driver of index gains. Meanwhile, foreign capital flows reversed notably, with large-scale purchases of Japanese stocks this week, ending the prior trend of continuous withdrawals, further supporting the market rebound. Market data showed that foreign investors bought over a trillion yen worth of Japanese stocks in a single week, focusing on semiconductors and AI-related tech stocks. Additionally, the impact of U.S. tariffs on Japanese exporters gradually faded. Despite earlier profit losses for most exporting firms among 42 Japanese listed companies—seven major automakers losing a combined 2.7 trillion yen—with the yen stabilizing and overseas demand marginally improving, export companies’ earnings expectations gradually recovered, and related sectors began to stabilize and rebound. However, note that Japan’s traditional industries still face recovery pressures, with unresolved dual constraints of high debt and high interest rates, and sluggish domestic consumer demand, constraining upward market movement. Combined with uncertainties in global economic recovery, the market’s rebound momentum requires further validation.
Europe:
This week, five factors—the ECB’s monetary policy meeting, the formal passage of the EU-U.S. trade agreement, prolonged Middle East conflicts pushing up energy prices, weak German manufacturing data, and upward revisions to Eurozone inflation expectations—jointly shaped market dynamics. The key contradictions were the tension between the ECB’s policy stability and weak economic recovery, and between external shocks (energy prices, trade agreement negatives) and internal fundamental weaknesses, continuously disturbing market sentiment and constraining market upside.
Regarding key economic and market dynamics, the implementation of the EU-U.S. trade agreement became a significant market disturbance this week. On March 26 local time, the European Parliament plenary session approved the EU-U.S. trade agreement. The deal secures a 15% tariff treatment for most EU goods exported to the U.S., while the EU must eliminate tariffs on U.S.-produced industrial goods and offer preferential market access for U.S. seafood and agricultural products. Although the agreement avoided a large-scale trade war, bringing some stability, markets generally viewed it as imbalanced. The EU’s additional $600 billion investment commitment and large-scale procurement of U.S. military technology were seen as unfavorable for European local employment and industry development. Some European politicians criticized it as a 'political, economic, and moral disaster,' with latent negatives continuing to suppress Europe’s export-oriented industries. Meanwhile, prolonged Middle East conflicts continued to disrupt European energy supplies, with U.S.-Israel joint strikes on Iran causing regional conflict and driving international oil prices higher. London Brent crude futures rose over 40% in a month, Dutch TTF natural gas futures climbed nearly 80%, and the EU’s oil and gas import bill increased by about 6 billion euros, further raising inflation stickiness and exacerbating corporate cost pressures. Germany and Italy, countries heavily reliant on energy, were hit hardest. German industrial firms faced growing operational pressures due to high energy costs and rising logistics costs (about a 40% increase from rerouting raw material transport), hindering the manufacturing recovery. Moreover, the Eurozone consumer market remained weak, with rising energy prices reducing household purchasing power, squeezing other consumer spending, and further slowing economic recovery. Combined with global hedge funds’ cautious attitude towards European equities, market risk appetite remained under pressure.
Global cyclical phase synchronization indicators:
China remains on the edge of recession; the probability of a US recession is low; Europe emerges from recession.
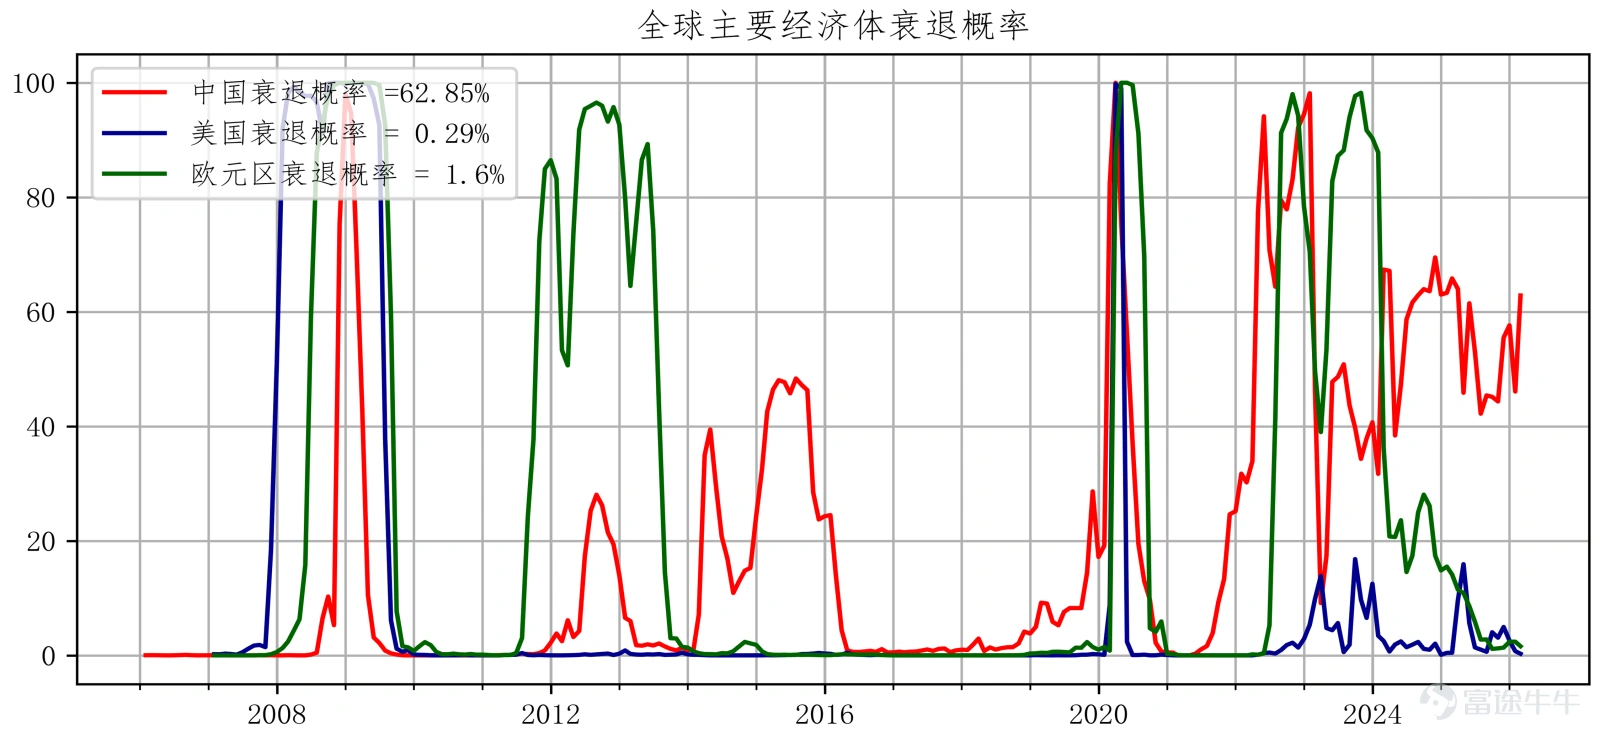
Data Source: Bloomberg and HARVEST
– China:Year-over-year real estate sales, year-over-year new real estate starts, year-over-year M1, year-over-year electricity generation, PMI new orders, auto sales
– United States:Unemployment-related indicators, real estate pre-sale permits, auto sales, consumer expectations, investor sentiment, new orders, stock drawdowns
– Eurozone:Economic activity indicators, real estate pre-sale permits, consumer confidence, manufacturing PMI, services PMI, credit spreads, stock drawdowns
Leading Indicators of Global Corporate Earnings Cycle
Growth LEI: Q1 China's economy may recover; European corporate earnings growth has stabilized; US corporate earnings growth is upward.
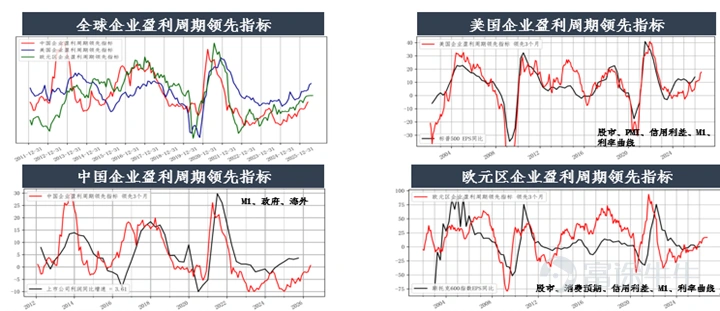
Data Source: Bloomberg and HARVEST
Key economic data from last week (Source: Bloomberg and Harvest Fund:
• [U.S. January Construction Spending]: Decreased by 0.3% (the consensus expectation was 0.1%); the previous forecast was revised from 0.3% to 0.8%. The economic weakness was mainly due to a decline in private residential spending, which is considered a chain reaction of labor shortages and rising interest rates.
• [US Q4 Productivity]:Revised to grow by 1.8% (consensus expectation was 2.5%); the previous revision was 4.9%, previously 2.8%; Q4 unit labor costs – revised to grow by 4.4% (consensus expectation was 3.1%); the previous revision was -1.9%, previously 2.8%. The contradiction between falling productivity and rising unit labor costs will make the latter a factor that discourages the Fed from cutting interest rates in the near term.
• [US March S&P Global US Manufacturing Purchasing Managers' Index (PMI)]:Preliminary reading of 52.4; previous reading was 51.6.
• [US March S&P Global US Services PMI]:Preliminary reading of 51.1; previous reading was 51.7.
• [US February PPI]:February PPI at 0.7% (expected 0.3%); previous value 0.5%, February core PPI at 0.5% (expected 0.4%); previous value 0.8%. Producer price increases were reflected in both goods (+1.1%) and services (+0.5%). This higher inflation occurred before the conflict with Iran and the subsequent spike in energy prices, which will exacerbate concerns about worsening inflation trends.
• [US Q4 Current Account Balance]:-190.7 billion USD (expected -242.3 billion USD); prior data revised from -226.4 billion USD to -239.1 billion USD. February import prices rose 1.3%; prior data revised from 0.2% to 0.6%.
• [US Weekly Initial Jobless Claims]:210,000 people (expected 210,000 people); previous value 205,000 people, weekly continuing claims 1,819,000 people; prior value revised from 1,857,000 to 1,851,000 people.
• [University of Michigan US Consumer Sentiment Index for March]: Final reading dropped from the preliminary 55.5 to 53.3 (consensus expectation was 55.5). The final reading for February was 56.6. In the same period last year, the index stood at 57.0. Following the Iran war, confidence among middle- and high-income consumers fell sharply due to rising gasoline prices and falling stock prices.
Disclaimer:
Investment involves risks, including possible loss of principal. Past performance or any forecasts or expectations do not indicate future performance. Before making investment decisions, investors should review relevant sales documents, including risk disclosures. Investment returns not denominated in Hong Kong dollars or US dollars are subject to exchange rate fluctuations.
The interests of this company are not offered or sold in Hong Kong through advertisements, invitations, or any other documents, except in cases where it does not constitute a public offering. This document has not been approved under the Securities and Futures Ordinance or the Companies Ordinance and is intended solely for authorized persons. It must not be distributed to unauthorized persons in Hong Kong or to unauthorized persons in any other jurisdiction. This material has not been reviewed by the Securities and Futures Commission of Hong Kong. For the purposes of this statement, 'authorized persons' shall mean professional investors as defined under the Securities and Futures Ordinance whose ordinary business involves purchasing, selling, or holding securities (whether as principals or agents). Distribution of this material may be restricted in certain jurisdictions.
In cases where it would be illegal to make an offer to any person within a jurisdiction, this document shall not be deemed as an offer or invitation to such persons. This document is for reference only and does not constitute any investment advice or recommendation, nor does it constitute an offer or invitation. It is not a basis for contracts involving the purchase or sale of any securities or instruments, nor is it a basis for Harvest Fund Management Co., Ltd., Harvest Global Investments Limited, or their affiliates to enter into or arrange any type of transaction based on the information contained herein.
Although the third-party information provided above is sourced from what should be reliable sources, neither Harvest Fund Management Co., Ltd., Harvest Global Investments Limited, their authorized issuers, affiliates, nor any of their directors or employees shall bear any responsibility for any errors or omissions therein. The information and opinions expressed herein are for reference only and may be adjusted without notice, and therefore should not be relied upon for making investment decisions. You should consult your investment advisor before making any investment decision.
The issuer of this document is Harvest Global Investments Limited. This document belongs to Harvest Global Investments Limited, which holds the copyright. Further circulation of this document is prohibited without the written consent of Harvest Global Investments Limited. All rights reserved.
All rights reserved ©2026 Harvest Global Investments Limited
Risk Disclaimer: The above content only represents the author's view. It does not represent any position or investment advice of Futu. Futu makes no representation or warranty.Read more

Comments
to post a comment
1