
BTC surpasses $75,000! Has the upward channel been fully opened?

Priced for rising inflation and economic recession, BTC continues to pull back | Bitcoin | Deep Bear Market | Research Report | Cryptocurrency Market Analysis
Following the failed rebound from the previous week, this week $Bitcoin (BTC.CC)$ continued its downward trend with a weekly drop of 3.76%, and the 7-day average trading volume decreased by 1.66%, indicating insufficient support at higher levels and a lack of new capital inflows. Limited by the 'deep bear market' $Bitcoin (BTC.CC)$ , it is still in the process of clearing out.
On the macro level, as the conflict between the U.S., Israel, and Iran escalates, the Strait of Hormuz is nearing a blockade, causing crude oil futures prices to soar. The market has started pricing in 'prolonged conflict and secondary inflation.' Although the Federal Reserve's liquidity remains marginally expansive (+0.85%), it has been offset by rising interest rates and a strengthening dollar (10Y +1.28%, DXY +0.71%), tightening financial conditions. Together, these factors form a combination of 'macro constraints + internal capital contraction,' putting pressure on the U.S. stock market, gold, and crypto markets.
This week’s core BTC narrative: In the context of tightening financial conditions, internal funds were unable to hedge macro pressures, leading to price declines. The liquidation of long leveraged positions amplified price volatility.
Geopolitics
This week, the U.S.-Israel-Iran conflict entered a critical phase of 'controlled escalation but failed negotiations': military confrontation continued to intensify while diplomatic pathways significantly narrowed. The differences in negotiation terms between both sides are structurally opposed. The U.S. proposed multiple demands including ceasefire, restrictions on nuclear and missile capabilities, and constraints on regional proxy activities. Iran explicitly rejected these and counter-proposed: demanding that the U.S. and Israel stop all strikes and 'targeted eliminations', provide future security guarantees, compensate for war losses, halt multi-front attacks on its allies, and even require acknowledgment of its sovereignty and control over the Strait of Hormuz. This set of conditions essentially touches upon America’s core strategic interests in the Middle East, leaving little overlapping negotiation space in the short term, meaning that the conflict will remain primarily military-driven with diplomacy playing a secondary role at this stage.
At the military level, the conflict exhibits characteristics of 'bidirectional limitation but spillover effects.' Iran continues to strike Gulf nations through missiles and drones, expanding targets from purely military bases to energy facilities and key industrial nodes. Though these attacks claim to target U.S. military-related objectives, they have evidently affected civilian economic infrastructure, demonstrating an intent of 'strategic pressure.' Meanwhile, the U.S. and Israel have expanded their strikes within Iran, moving from initial nuclear and missile facilities to industrial infrastructure, energy nodes, and even urban areas. While both sides nominally still focus on military targets, the line between military and civilian is becoming blurred.
These strikes on civilian infrastructure carry three layers of strategic implications: First, enhancing economic warfare—by disrupting energy, industry, and transportation nodes, increasing the opponent’s war costs and societal pressures; Second, deterrence spillover—sending a signal to Gulf states and regional neutrals that 'participation leads to damage'; Third, continuously pushing the gray boundary of conflict escalation—while not entering full-scale war, it goes beyond the traditional scope of 'precise military strikes.' Particularly, strikes near nuclear power plants and key energy nodes have raised international concerns about potential systemic risks.
In terms of key geopolitical nodes, the Strait of Hormuz has not been completely blockaded, but risks have significantly risen, affecting about 2,000 vessels and 20,000 seafarers who face delays or uncertainties in passage. Iran is creating a 'quasi-blockade' effect by attacking tankers and surrounding infrastructure, while also advancing legislative intentions to impose charges and exert control over the strait, indicating an attempt to transform military threats into long-term strategic leverage. This situation means that global energy supplies have not yet been disrupted, but the market has entered a 'risk premium pricing' phase.
On the political front, Trump's rhetoric has marginally softened, shifting from an early emphasis on strong retaliation to avoiding full-scale war and controlling costs, which has somewhat dampened market expectations of extreme escalation. However, his administration continues to push forward with a strategy of simultaneous military actions and limited diplomatic attempts, reflecting a typical 'fight and talk' game structure. While signaling negotiation intentions, the U.S. has been increasing troop deployments to the Middle East, adding significant pressure to the market.
Overall, the core characteristics of this phase of conflict can be summarized as: continuous escalation at the military level, structural deadlock at the diplomatic level, expanding damage to civilian infrastructure, and rising risks to energy channels—creating an atmosphere of 'dark clouds looming' without yet triggering a systemic crisis. The key variable that will determine the next phase remains whether a qualitative event occurs—such as the complete blockade of the Strait of Hormuz, systematic strikes against core facilities within Iran, fatal disruptions to the Gulf energy system, or the initiation of ground warfare by U.S. forces. Until these thresholds are triggered, the conflict will remain within a 'high-intensity but controllable' game range, and the market will stay within a risk premium rather than crisis pricing framework.
Macro Finance
Macro finance presents a typical 'quantitative easing, price tightening' mismatch structure. The Federal Reserve’s net liquidity increased by 0.85% month-over-month, showing continued expansion in base liquidity; however, SOFR rose by 0.83% to 3.65%, with 2Y and 10Y yields climbing to 3.926% and 4.436%, respectively, alongside DXY rising to 100.202, tightening both funding costs and dollar liquidity. This combination implies that the supply of liquidity has not effectively translated into demand for risky assets, making the discount rate the dominant variable.
The PPI year-over-year increase released the previous week rose from 2.9% to 3.4%, while the month-over-month increase climbed from 0.5% to 0.7%. This week, the University of Michigan Consumer Sentiment Index fell from 56.6 to 53.3, forming a stagflation-like structure of 'rising inflation + weakening demand.' This directly reinforces market expectations of policy remaining tight, providing intrinsic logic supporting rising interest rates.
Expectations for interest rate cuts within the year have now dropped to zero, with traders beginning to price in macro-financial tightening and even potential economic recession caused by secondary inflation.
The performance of risky assets aligns consistently with this:$Nasdaq (NDAQ.US)$Down 3.23%,$S&P 500 Index (.SPX.US)$A decline of 2.12% reflects the negative feedback of valuation-sensitive assets to rising interest rates. In this context,$Bitcoin (BTC.CC)$ It is closer to interest-rate-sensitive assets rather than purely liquid assets, with its short-term pricing driven by tighter financial conditions.
Following last week's drop to the critical 200-day moving average, the three major U.S. indices continued breaking down this week and, as of Friday, have moved far below the 200-day moving average, temporarily placing them in a 'technical bear market.' Retail buying power has faded, and hedge funds have started transitioning from hedging to spot selling. Unless there is substantial improvement in Middle Eastern tensions, the U.S. stock crisis will be difficult to resolve in the short term, and the market is likely to continue downward to find support.
Crypto Market
From a market structure perspective, this week’s price action was not driven by concentrated spot selling but instead displayed a combination of 'insufficient spot absorption + leveraged amplification.'
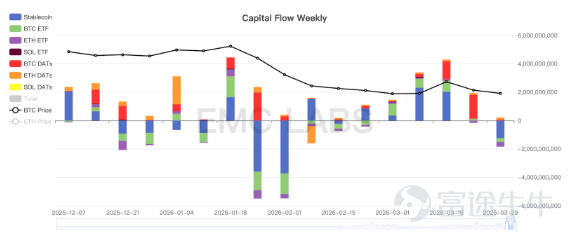
Firstly, spot demand contracted significantly. Bitcoin ETFs, which had previously seen inflows, turned into net outflows of $2.66 billion, with a single-day maximum outflow reaching $2.175 billion. The supply of stablecoins decreased by $12.28 billion (-0.45%). The simultaneous contraction of these two core funding channels indicates that both off-exchange allocation capital and on-exchange buying power weakened, directly reducing the marginal absorption capacity of the spot market.

Crypto Market Fund Flow Statistics (Weekly)
Secondly, on-chain supply did not shift to active selling. Exchange Bitcoin balances decreased by 4,586 coins, with a net outflow of 12,212 coins, indicating that tokens are still leaving exchanges rather than returning to form sell pressure. Therefore, the price decline was not due to concentrated spot dumping but rather a passive adjustment under insufficient absorption.
The key variable shifted toward the derivatives market. Open interest increased by $5.077 billion (+9.84%), with total liquidations reaching $2.655 billion, of which 68% were long liquidations. This combination shows that leverage accumulated during the decline, with shorts dominating price discovery in the second half of the week and forcing some liquidation of long positions.
From profitability and behavioral indicators, the market remains stuck in the 'loss-clearing' phase of a deep bear market. The overall MVRV dropped to 1.22, while short-term holders' MVRV fell to 0.80, entering the loss-making zone. SOPR dropped to 0.98, with long-term holders even lower at 0.72, indicating that most on-chain transactions were realized at a loss.
eMerge OS on-chain data suggests that the market is still in the 'long-hand clearing' stage of a deep bear market. The current market is in a delicate balance: on one hand, despite ongoing macroeconomic downturns, holders have not significantly increased panic selling, indicating that the current price has yet to erode their patience and determination. On the other hand, outflows from exchanges are also decreasing, meaning buyers are adopting a more cautious approach. In a volatile external environment, this fragile equilibrium implies either a sharp rebound if external conditions improve dramatically or another internal collapse if external conditions deteriorate further. If the latter occurs, Bitcoin's price will likely fall below $60,000, entering the third leg of this cycle’s decline, potentially the final leg.
Market Outlook
The macro financial environment and internal market structure remain the key perspectives in determining future market trends.
If the US-Iran conflict can be clearly resolved, capital will flow back, $Bitcoin (BTC.CC)$ there is hope to establish a line of defense at the $65,000 level, then move upwards to challenge the resistance around $75,000 again.
If the conflict cannot be resolved in the short term and macro financial conditions worsen further, once bullish confidence collapses, the internal crypto market will likely experience another round of intensive selling, leading to the third round of declines in this cycle.
The above analysis is provided by EMC Labs.
———————————————————————
About EMC Labs
EMC Labs is a partner of Victory Securities, and together they launched the only virtual asset fund approved by the SEC that accepts stablecoin subscriptions — the Victory EMC BTC Cycle Fund. EMC Labs was co-founded by experienced virtual asset investors and data scientists, with a core team from JD.com Finance, Bell Labs, Marsbit, and other companies. EMC Labs has invested substantial resources into building professional engines to analyze BTC on-chain data and technical indicators.
Disclaimer
Investing involves risks, and investors should be aware. The value of securities and investments can rise or fall, and there is no guarantee. Investors may not recover their initial investment amount; past performance does not necessarily predict future results. The securities trading services of Victory Securities are provided by Victory Securities Limited (hereinafter referred to as 'Victory Securities'). This document was prepared and authorized for release on this platform by Victory Securities Limited. The information contained herein is for reference purposes only, and Victory Securities reserves the right to change or terminate without prior notice. All information provided on this platform cannot be reproduced, linked, reposted, or otherwise used by any media, website, or individual without prior written authorization from Victory Securities. Authorized users must attribute the source of this document to Victory Securities and commit to complying with relevant laws and internet usage practices worldwide, refraining from illegal purposes or methods. Violators will bear all related legal and financial responsibilities. Data cited in this document may be sourced from third parties; Victory Securities does not guarantee the accuracy, fairness, timeliness, completeness, or correctness of any data, forecasts, and/or opinions contained herein, nor does it assume legal responsibility for any benchmarks upon which such forecasts and/or opinions are based. Any forward-looking statements in this document should not be considered guarantees of future performance, and actual developments may differ significantly. This document is neither an offer nor a solicitation for the purchase or sale of any securities or investment decision-making basis, nor should it be interpreted as professional advice. Readers or those making investment decisions should fully understand the risks and the associated legal, tax, and accounting implications, and decide whether investing aligns with their personal objectives and risk tolerance, seeking appropriate professional advice if necessary. In certain countries, dissemination and distribution of this document may be restricted by law, and recipients are responsible for compliance with such restrictions.
Risk Disclaimer: The above content only represents the author's view. It does not represent any position or investment advice of Futu. Futu makes no representation or warranty.Read more
Comments
to post a comment