

First quarterly turnaround from loss to profit! Has XPeng reached a turning point?

XPeng Motors Rises for Six Consecutive Days, Key Resistance at HKD 80 Becomes Battleground for Bulls and Bears
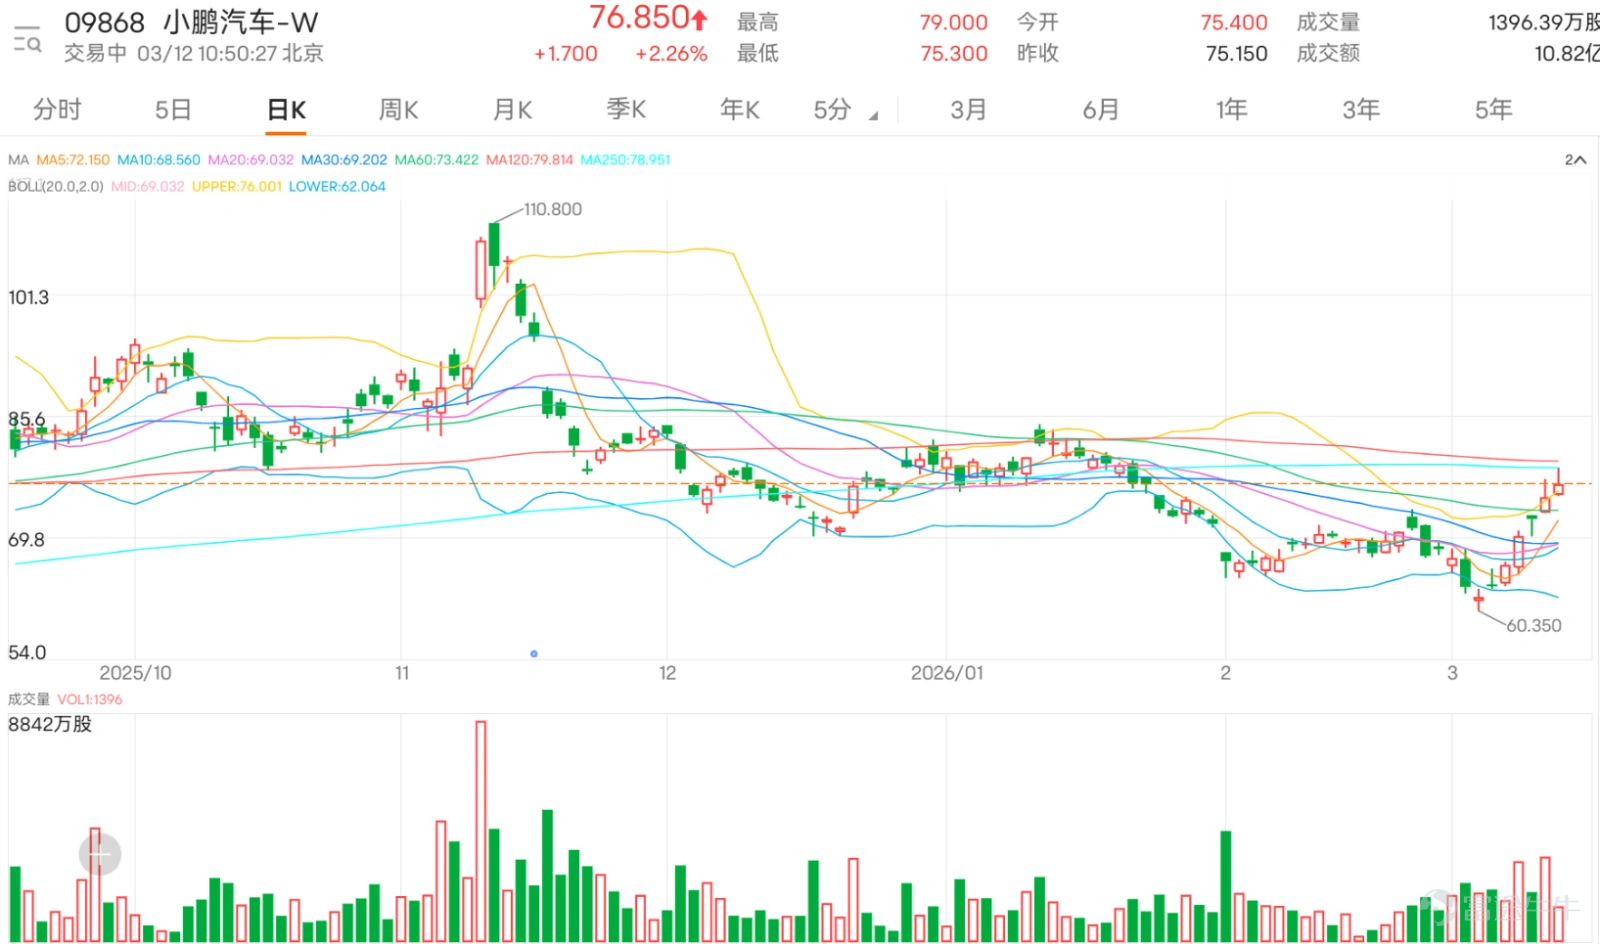
The recent trend has been strong, with the stock price rising for six consecutive days. It reached an intraday high of 79 yuan today, hitting a one-month peak. Observing from the trend structure, the stock price has successfully broken through multiple key moving averages such as the 10-day (67.63 yuan), 30-day (69.09 yuan), and 60-day (73.41 yuan) lines, forming a short-term bullish pattern. The technical setup has clearly strengthened.
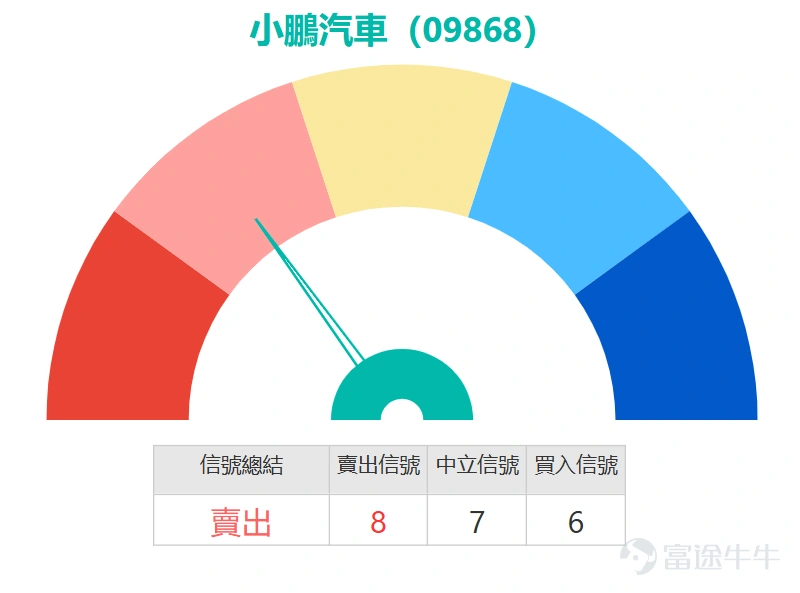
However, detailed technical signals show divergence between bulls and bears. Both the Stochastic Oscillator and Williams %R indicators suggest that the stock is in overbought territory, issuing short-term sell signals, implying potential technical pullback pressure after the recent sharp rise. The RSI indicator is at 60, close to the overbought threshold but still neutral, reflecting that upward momentum has not become extreme. Meanwhile, several medium- to long-term and market sentiment indicators are showing positive signals: Psychological Line Indicator, VR Volume Ratio Indicator, Ichimoku Cloud, MACD, and Bollinger Bands all point to buying. Notably, the buy signal from the MACD often indicates the possibility of a trend reversal towards strength; combined with the recent 19% 5-day volatility, the buy signal from Bollinger Bands suggests expanding volatility, and the price may be entering a critical phase of directional selection.
In terms of key price levels, the first resistance above is at the HKD 80 round number level, with the second resistance at HKD 85.7. The initial support below is at HKD 68.4, near the convergence zone of short-term moving averages, with the second support at HKD 64.6. The current stock price has moved out of the dense moving average area and is trending upwards, but is now facing a test at the key resistance zone.
In comprehensive analysis, although some short-term oscillation indicators suggest overbought risks, more indicators reflecting trends and intrinsic market momentum (such as MACD and volume-related indicators) have simultaneously strengthened. Moreover, prices have broken through multiple moving averages on high volume, creating conditional buy signals in the current environment. The core issue is whether the stock price can effectively break through and stabilize above the HKD 80 resistance level with corresponding trading volume, confirming the continuation of upward momentum.
XPeng Motors (09868) Derivatives Data
The open interest is highly concentrated in the strike price ranges of 98-100 and 108-110, accounting for a combined 74.3% of the total open interest. The range with the most trading activity for call warrants is 88-90, representing 47.6% of the total call warrant turnover. Meanwhile, put warrant trading is concentrated in the 78-80 range, accounting for 82.1%. Call warrants in the 88-90 range have an average out-of-the-money percentage of 16.0%, making them moderately out-of-the-money compared to the current stock price of approximately 76.7, with an actual leverage of about 5.2 times, a hedge value of 39%, implied volatility of 67.6%, and expiry dates mostly around 2.7 months. Put warrants in the 78-80 range are slightly in-the-money products with an average out-of-the-money percentage of -2.5%, actual leverage of about 2.8 times, a hedge value of -45%, implied volatility of 68.1%, and expiry time around 3.4 months.
For bull and bear certificates, the two recovery price ranges with the highest concentration of open interest are currently 58-60 and 52-54 for bull certificates, together accounting for 68.7% of the total open interest. The range with the most trading activity for bull certificates is 58-60, representing 97.2% of the total bull certificate turnover, while bear certificate trading is concentrated in the 84-86 range, accounting for 84.3%. Bull certificates in the 58-60 range have an average recovery distance of 23.7% and an actual leverage of about 3.7 times, with expiry dates mostly in July-October 2026. Bear certificates in the 84-86 range have an average recovery distance of 10.1%, actual leverage of about 8 times, with expiry dates concentrated in April-May 2028.
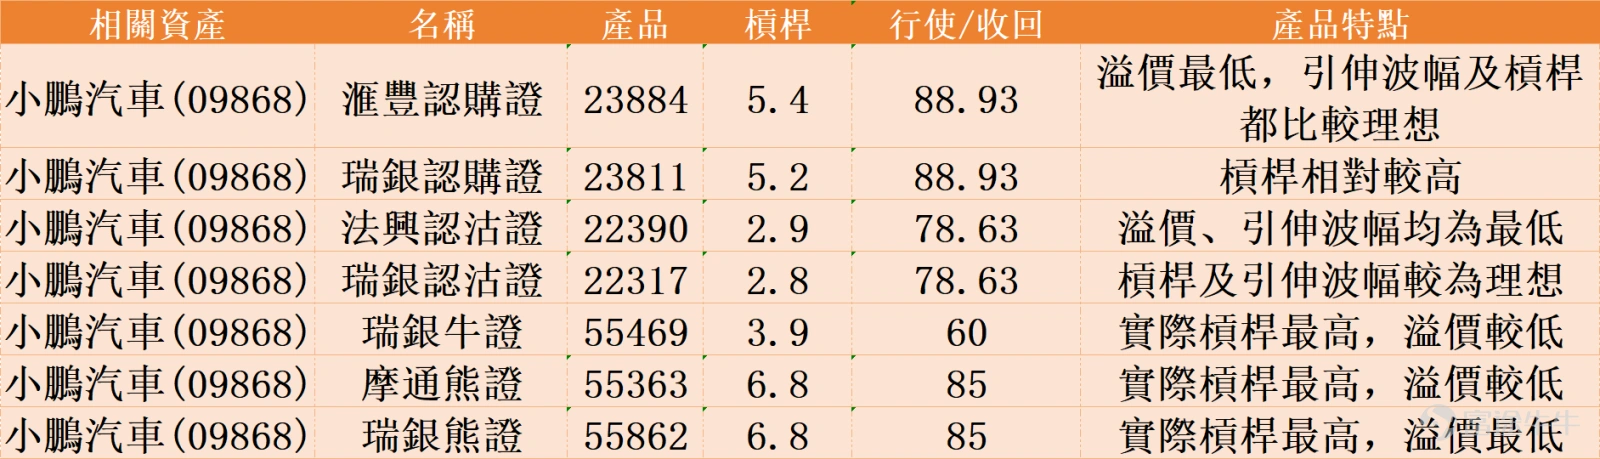
For investors optimistic about XPeng Motors breaking through resistance and continuing its upward trend, they can consider call warrants and bull certificates. Among these, $HSXPENG@EC2606B.C (23884.HK)$ with a strike price of 88.93 has the lowest premium level among similar products, and its implied volatility and leverage ratio (approximately 5.4 times) combination is relatively ideal. It suits investors looking to capture potential upside in the underlying stock at a lower cost. For those seeking higher leverage, they might consider $UBXPENG@EC2606B.C (23811.HK)$ , which also has a strike price of 88.93 but offers a relatively higher leverage ratio (about 5.2 times), providing more significant return potential when the underlying stock rises. Additionally, if investors believe the stock price will steadily rise and want to avoid the impact of time decay, $UB#XPENGRC2607A.C (55469.HK)$ is another high-leverage option with a recovery price set at 60, offering actual leverage of about 3.9 times and a low premium, providing an efficient tool for directly tracking the performance of the underlying stock.
For investors expecting a technical pullback in the stock price or seeking to hedge, put warrants and bear certificates can be considered. Regarding put warrants, $SGXPENG@EP2606A.P (22390.HK)$ with a strike price of 78.63 has the lowest premium and implied volatility among existing products, offering a clear cost advantage. Meanwhile, $UBXPENG@EP2606A.P (22317.HK)$ , with the same strike price of 78.63, provides a relatively balanced combination of leverage ratio (around 2.8 times) and implied volatility. If investors are pessimistic about the outlook and seek higher leverage, they can turn to bear certificates. $JP#XPENGRP2805G.P (55363.HK)$ and $UB#XPENGRP2804D.P (55862.HK)$ have recovery prices set at 85, both offering the market's highest actual leverage of about 6.8 times and relatively low premiums. Among these, UBS Group’s bear certificate (55862) has the lowest premium in its category, making it a highly efficient choice for bearish operations.
In the new energy vehicle sector, which stock do you currently favor more, XPeng Motors$LI AUTO-W (02015.HK)$ Still $NIO-SW (09866.HK)$'s technical trend? If XPeng's share price reaches the resistance level of 80 yuan, would you choose to take profit, add to your position, or stay on the sidelines? Feel free to share your insights in the comment section. For more market analysis, keep following 'HK Stock Warrants Jenny' for daily updates!
Reminder: This article does not constitute any investment advice.
This article is for reference only and does not constitute any investment advice. The market data, opinions, and analysis contained herein may change at any time without prior notice. We are not responsible for any loss or damage caused by reliance on the information in this article. Technical analysis only shows whether certain technical conditions are met; a comprehensive assessment of asset performance should be conducted using additional data. Decisions to trade should not be based solely on this article. Please note that past performance is not indicative of future results.
#HongKongStocks #HangSengIndex #RealTimeAnalysis #WarrantsSelection #WarrantsStrategy #DerivativesHedging #HongKongWarrantsJenny #XiaopengMotors #09868 #TechnicalAnalysis$Hang Seng TECH Index (800700.HK)$$Hang Seng Index (800000.HK)$
Risk Disclaimer: The above content only represents the author's view. It does not represent any position or investment advice of Futu. Futu makes no representation or warranty.Read more

Comments
to post a comment
1