English
Back
Open Account
BTC surpasses $75,000! Has the upward channel been fully opened?

米股研究
joined discussion · Mar 11 15:14

Technical Analysis of Cryptocurrencies and Related Stocks (March 11): Bitcoin/Ethereum/HOOD/COIN/MSTR/CRCL/IREN/CIFR/BMNR/MARA/RIOT

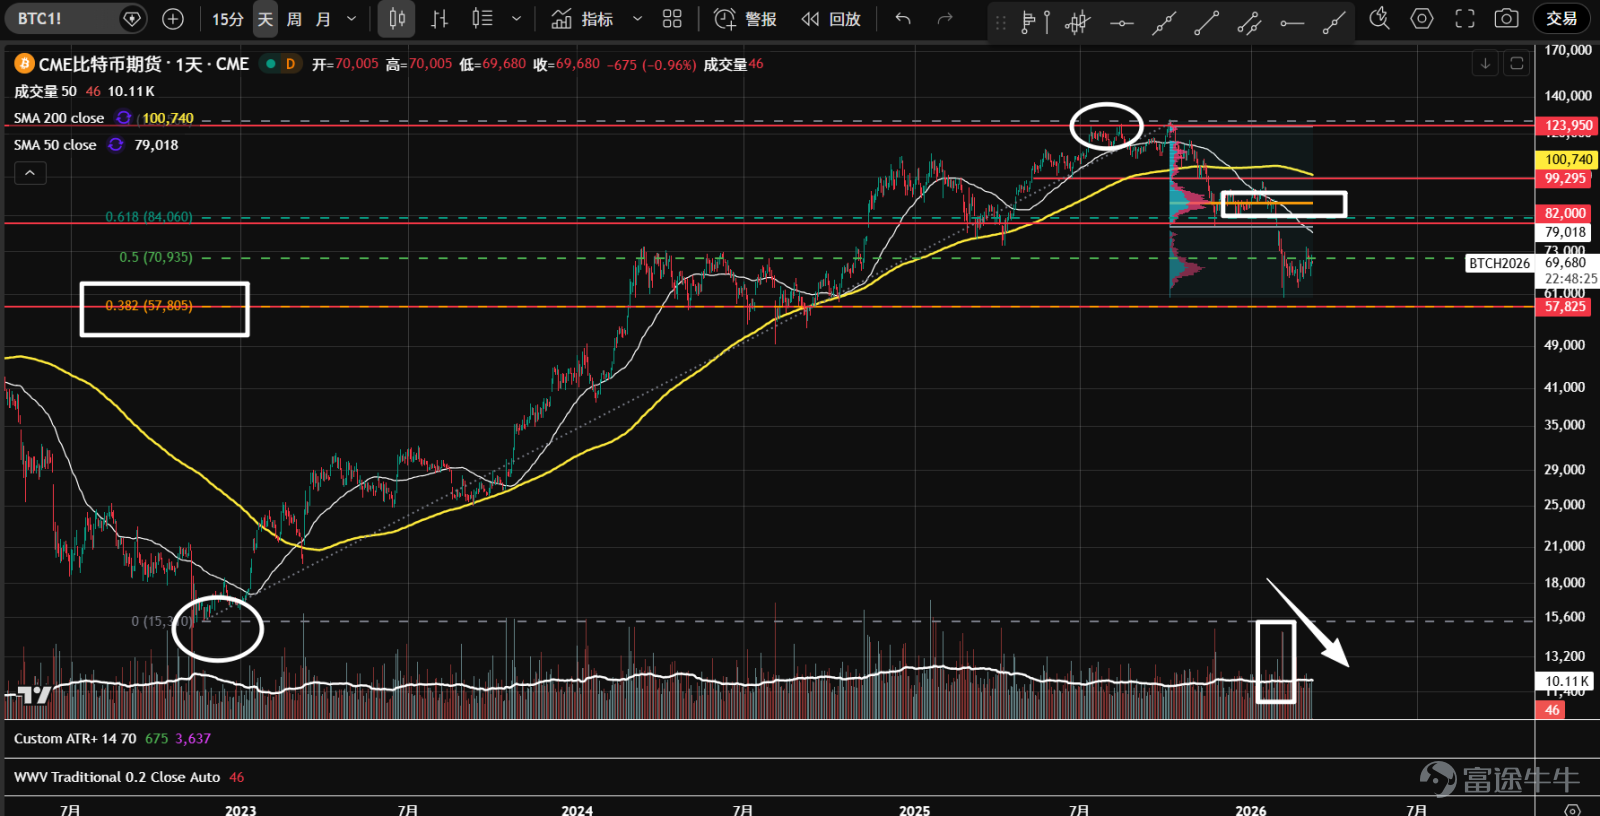
1、 $Bitcoin (BTC.CC)$ Futures experienced consecutive sharp declines at the end of January and beginning of February. Panic selling occurred near the support level of 57,800, followed by a strong rebound. The 57,800 level represents the 38.2% retracement from the bear market of 2022 and is also the last line of defense below the 60,000 mark. A low-volume second test has now been completed; the market may continue to consolidate and form a b-type volume distribution. It is not advisable to chase highs for now.
1、 $Bitcoin (BTC.CC)$ Futures experienced consecutive sharp declines at the end of January and beginning of February. Panic selling occurred near the support level of 57,800, followed by a strong rebound. The 57,800 level represents the 38.2% retracement from the bear market of 2022 and is also the last line of defense below the 60,000 mark. A low-volume second test has now been completed; the market may continue to consolidate and form a b-type volume distribution. It is not advisable to chase highs for now.  2、 $Ethereum (ETH.CC)$ After breaking below the consolidation range from November of last year to January this year, futures accelerated with heavy volume in a downward trend, triggering panic selling. Subsequently, prices naturally rebounded from the support at 1,761, but the rebound was weak, less than the 61.8% retracement of the most recent decline, showing overall weak technical characteristics.   3、 $Robinhood (HOOD.US)$ After breaking below the top triangle, panic selling occurred at the 68.1 support level, followed by a low-volume second test. From the highest point at the top until now, trading volume has formed a b-type distribution. The rebound only reached the 61.8% retracement level of the latest sharp decline, still indicating relative weakness.  4、 $Coinbase (COIN.US)$ After an accelerating selloff on high volume, panic selling emerged at the 146 support level, followed by a natural rebound reaching the...
2、 $Ethereum (ETH.CC)$ After breaking below the consolidation range from November of last year to January this year, futures accelerated with heavy volume in a downward trend, triggering panic selling. Subsequently, prices naturally rebounded from the support at 1,761, but the rebound was weak, less than the 61.8% retracement of the most recent decline, showing overall weak technical characteristics.
1、 $Bitcoin (BTC.CC)$ Futures experienced consecutive sharp declines at the end of January and beginning of February. Panic selling occurred near the support level of 57,800, followed by a strong rebound. The 57,800 level represents the 38.2% retracement from the bear market of 2022 and is also the last line of defense below the 60,000 mark. A low-volume second test has now been completed; the market may continue to consolidate and form a b-type volume distribution. It is not advisable to chase highs for now.  2、 $Ethereum (ETH.CC)$ After breaking below the consolidation range from November of last year to January this year, futures accelerated with heavy volume in a downward trend, triggering panic selling. Subsequently, prices naturally rebounded from the support at 1,761, but the rebound was weak, less than the 61.8% retracement of the most recent decline, showing overall weak technical characteristics.   3、 $Robinhood (HOOD.US)$ After breaking below the top triangle, panic selling occurred at the 68.1 support level, followed by a low-volume second test. From the highest point at the top until now, trading volume has formed a b-type distribution. The rebound only reached the 61.8% retracement level of the latest sharp decline, still indicating relative weakness.  4、 $Coinbase (COIN.US)$ After an accelerating selloff on high volume, panic selling emerged at the 146 support level, followed by a natural rebound reaching the...
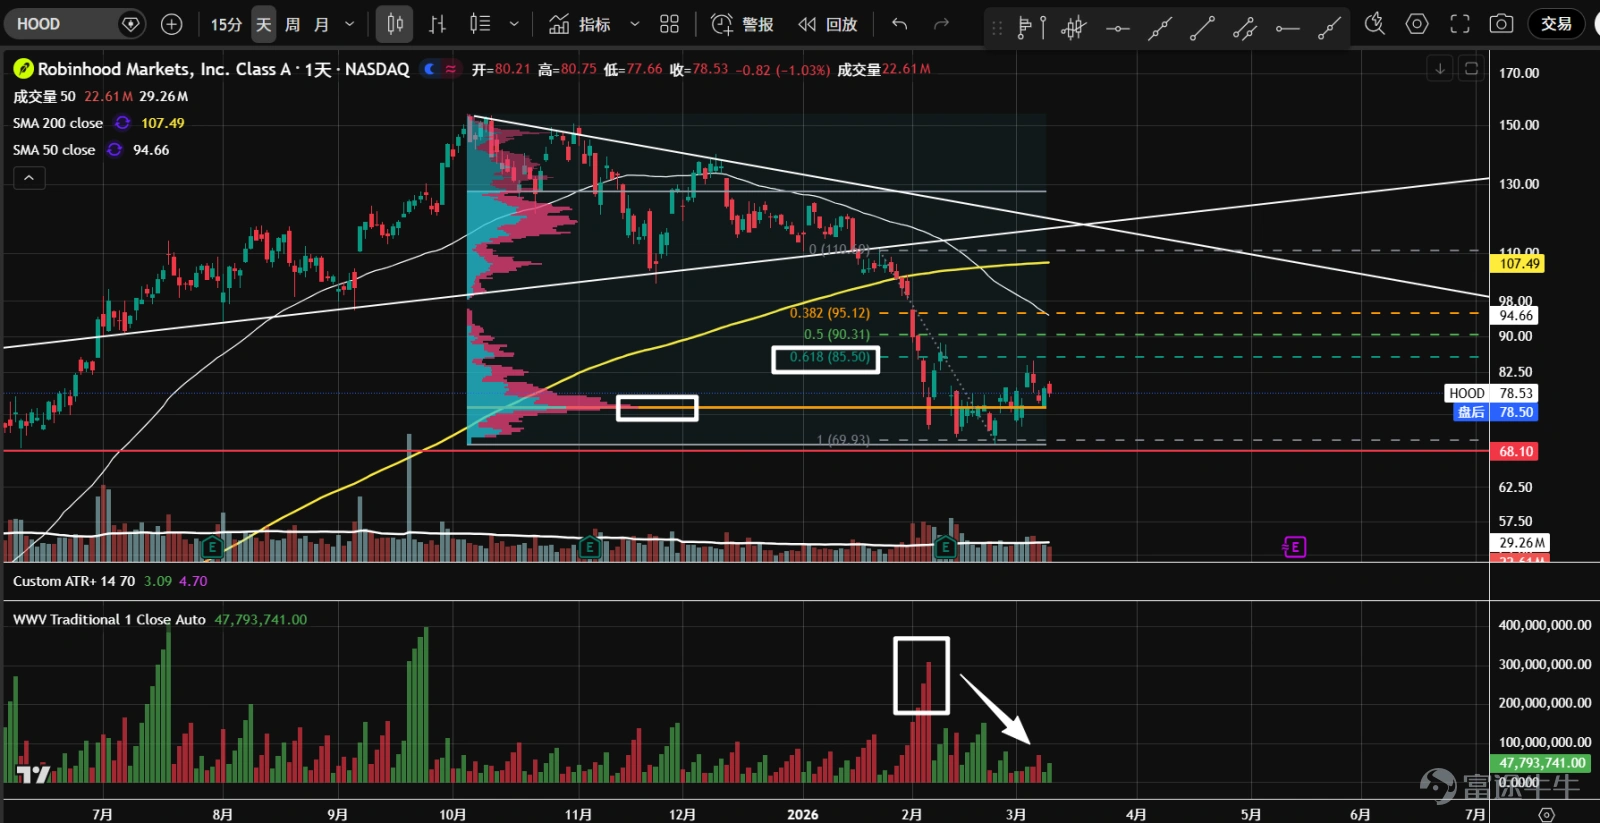
3、 $Robinhood (HOOD.US)$ After breaking below the top triangle, panic selling occurred at the 68.1 support level, followed by a low-volume second test. From the highest point at the top until now, trading volume has formed a b-type distribution. The rebound only reached the 61.8% retracement level of the latest sharp decline, still indicating relative weakness.
1、 $Bitcoin (BTC.CC)$ Futures experienced consecutive sharp declines at the end of January and beginning of February. Panic selling occurred near the support level of 57,800, followed by a strong rebound. The 57,800 level represents the 38.2% retracement from the bear market of 2022 and is also the last line of defense below the 60,000 mark. A low-volume second test has now been completed; the market may continue to consolidate and form a b-type volume distribution. It is not advisable to chase highs for now.  2、 $Ethereum (ETH.CC)$ After breaking below the consolidation range from November of last year to January this year, futures accelerated with heavy volume in a downward trend, triggering panic selling. Subsequently, prices naturally rebounded from the support at 1,761, but the rebound was weak, less than the 61.8% retracement of the most recent decline, showing overall weak technical characteristics.   3、 $Robinhood (HOOD.US)$ After breaking below the top triangle, panic selling occurred at the 68.1 support level, followed by a low-volume second test. From the highest point at the top until now, trading volume has formed a b-type distribution. The rebound only reached the 61.8% retracement level of the latest sharp decline, still indicating relative weakness.  4、 $Coinbase (COIN.US)$ After an accelerating selloff on high volume, panic selling emerged at the 146 support level, followed by a natural rebound reaching the...
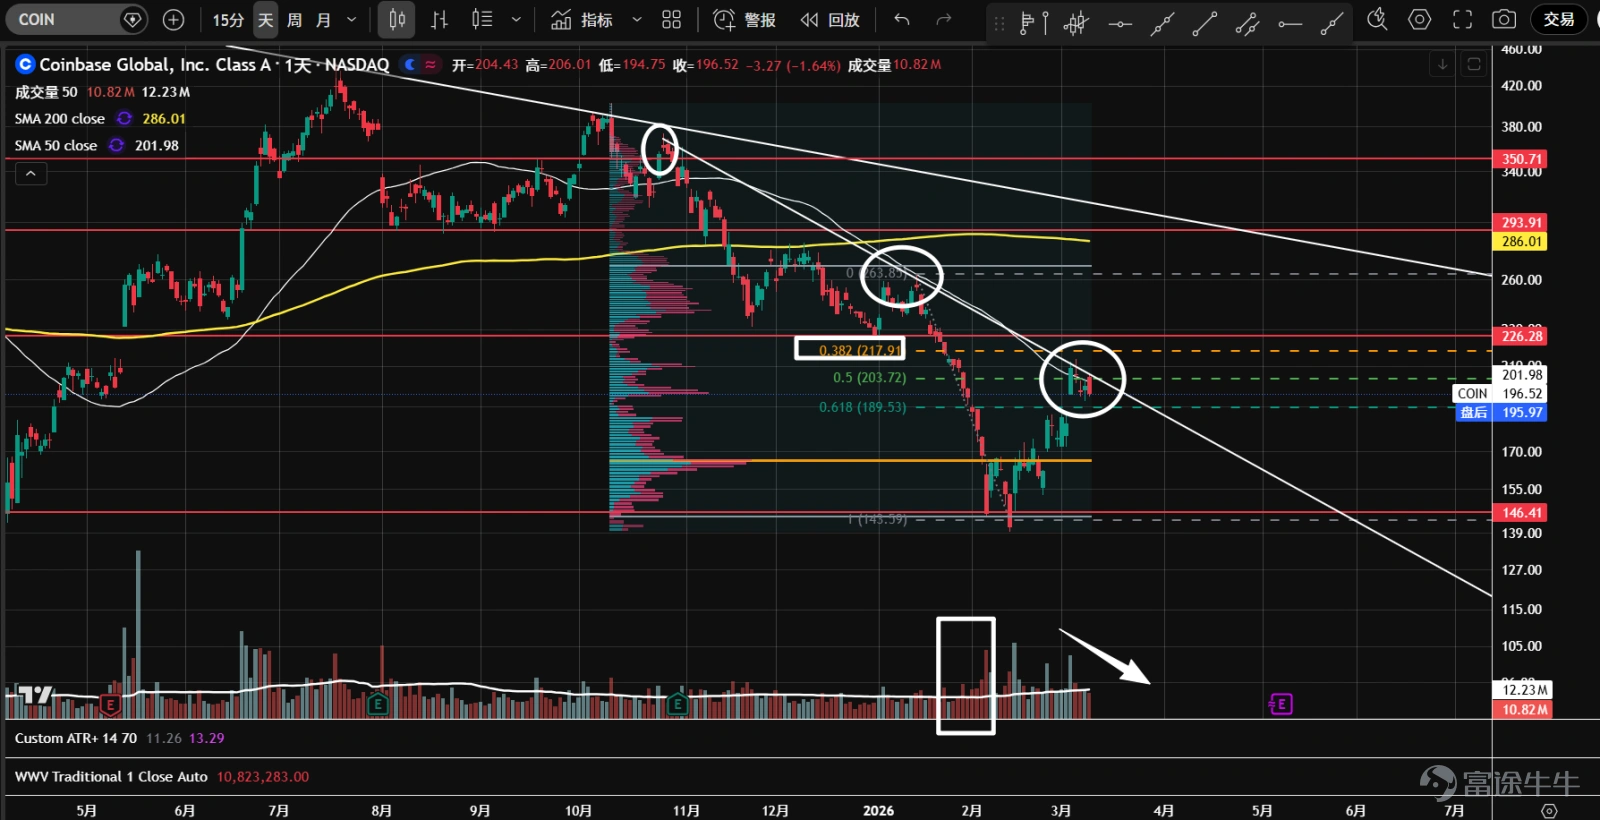
4、 $Coinbase (COIN.US)$ Following an accelerating selloff on high volume, panic selling emerged at the 146 support level, followed by a natural rebound that reached the 38.2% retracement of the most recent decline, demonstrating relatively strong technical characteristics. In the short term, the price remains suppressed by a downward trend line, awaiting opportunities for buying on dips.
1、 $Bitcoin (BTC.CC)$ Futures experienced consecutive sharp declines at the end of January and beginning of February. Panic selling occurred near the support level of 57,800, followed by a strong rebound. The 57,800 level represents the 38.2% retracement from the bear market of 2022 and is also the last line of defense below the 60,000 mark. A low-volume second test has now been completed; the market may continue to consolidate and form a b-type volume distribution. It is not advisable to chase highs for now.  2、 $Ethereum (ETH.CC)$ After breaking below the consolidation range from November of last year to January this year, futures accelerated with heavy volume in a downward trend, triggering panic selling. Subsequently, prices naturally rebounded from the support at 1,761, but the rebound was weak, less than the 61.8% retracement of the most recent decline, showing overall weak technical characteristics.   3、 $Robinhood (HOOD.US)$ After breaking below the top triangle, panic selling occurred at the 68.1 support level, followed by a low-volume second test. From the highest point at the top until now, trading volume has formed a b-type distribution. The rebound only reached the 61.8% retracement level of the latest sharp decline, still indicating relative weakness.  4、 $Coinbase (COIN.US)$ After an accelerating selloff on high volume, panic selling emerged at the 146 support level, followed by a natural rebound reaching the...
5、 $Strategy (MSTR.US)$ A panic sell-off and natural rebound occurred at the major support level of 103.5 in early February. The pullback during the second test was very shallow, and the most recent decline has also noticeably narrowed compared to the drop at the end of last year. These signs indicate that the balance of power between buyers and sellers may be shifting. The short-term resistance at the 155 axis is not far, and the market may form a bottom accumulation zone going forward.
1、 $Bitcoin (BTC.CC)$ Futures experienced consecutive sharp declines at the end of January and beginning of February. Panic selling occurred near the support level of 57,800, followed by a strong rebound. The 57,800 level represents the 38.2% retracement from the bear market of 2022 and is also the last line of defense below the 60,000 mark. A low-volume second test has now been completed; the market may continue to consolidate and form a b-type volume distribution. It is not advisable to chase highs for now.  2、 $Ethereum (ETH.CC)$ After breaking below the consolidation range from November of last year to January this year, futures accelerated with heavy volume in a downward trend, triggering panic selling. Subsequently, prices naturally rebounded from the support at 1,761, but the rebound was weak, less than the 61.8% retracement of the most recent decline, showing overall weak technical characteristics.   3、 $Robinhood (HOOD.US)$ After breaking below the top triangle, panic selling occurred at the 68.1 support level, followed by a low-volume second test. From the highest point at the top until now, trading volume has formed a b-type distribution. The rebound only reached the 61.8% retracement level of the latest sharp decline, still indicating relative weakness.  4、 $Coinbase (COIN.US)$ After an accelerating selloff on high volume, panic selling emerged at the 146 support level, followed by a natural rebound reaching the...
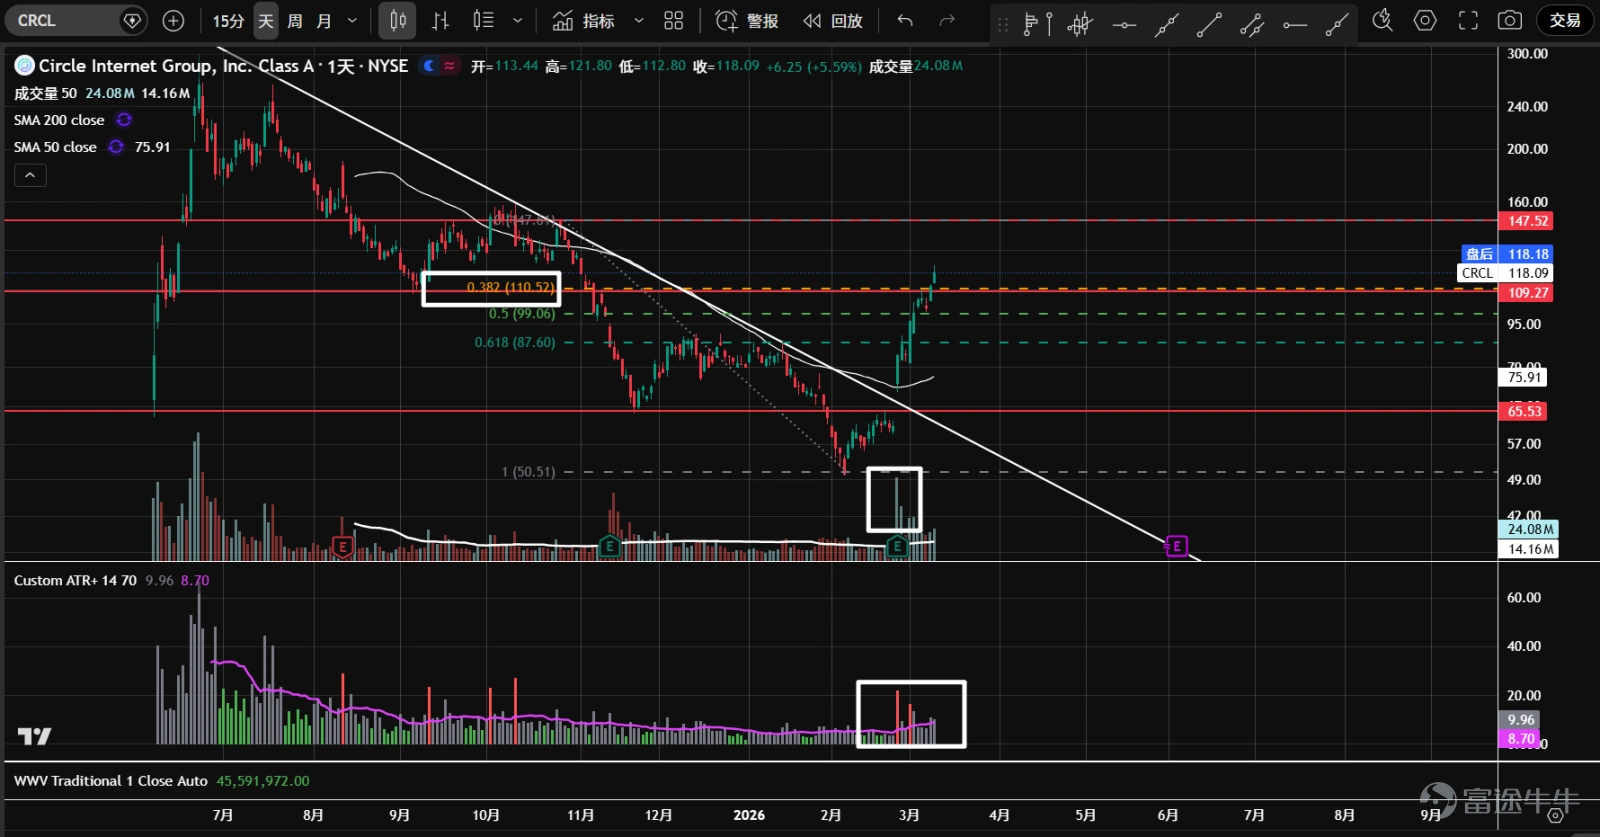
6、 $Circle (CRCL.US)$ Following the earnings report release, there was a sharp gap-up, breaking through the downward trendline. However, the recent surge in price came with extremely high trading volume. Currently, it is attempting to break through the resistance at 109, which is also the 38.2% retracement level of the sharp decline since November of last year. It is not advisable to chase the upward momentum.
1、 $Bitcoin (BTC.CC)$ Futures experienced consecutive sharp declines at the end of January and beginning of February. Panic selling occurred near the support level of 57,800, followed by a strong rebound. The 57,800 level represents the 38.2% retracement from the bear market of 2022 and is also the last line of defense below the 60,000 mark. A low-volume second test has now been completed; the market may continue to consolidate and form a b-type volume distribution. It is not advisable to chase highs for now.  2、 $Ethereum (ETH.CC)$ After breaking below the consolidation range from November of last year to January this year, futures accelerated with heavy volume in a downward trend, triggering panic selling. Subsequently, prices naturally rebounded from the support at 1,761, but the rebound was weak, less than the 61.8% retracement of the most recent decline, showing overall weak technical characteristics.   3、 $Robinhood (HOOD.US)$ After breaking below the top triangle, panic selling occurred at the 68.1 support level, followed by a low-volume second test. From the highest point at the top until now, trading volume has formed a b-type distribution. The rebound only reached the 61.8% retracement level of the latest sharp decline, still indicating relative weakness.  4、 $Coinbase (COIN.US)$ After an accelerating selloff on high volume, panic selling emerged at the 146 support level, followed by a natural rebound reaching the...
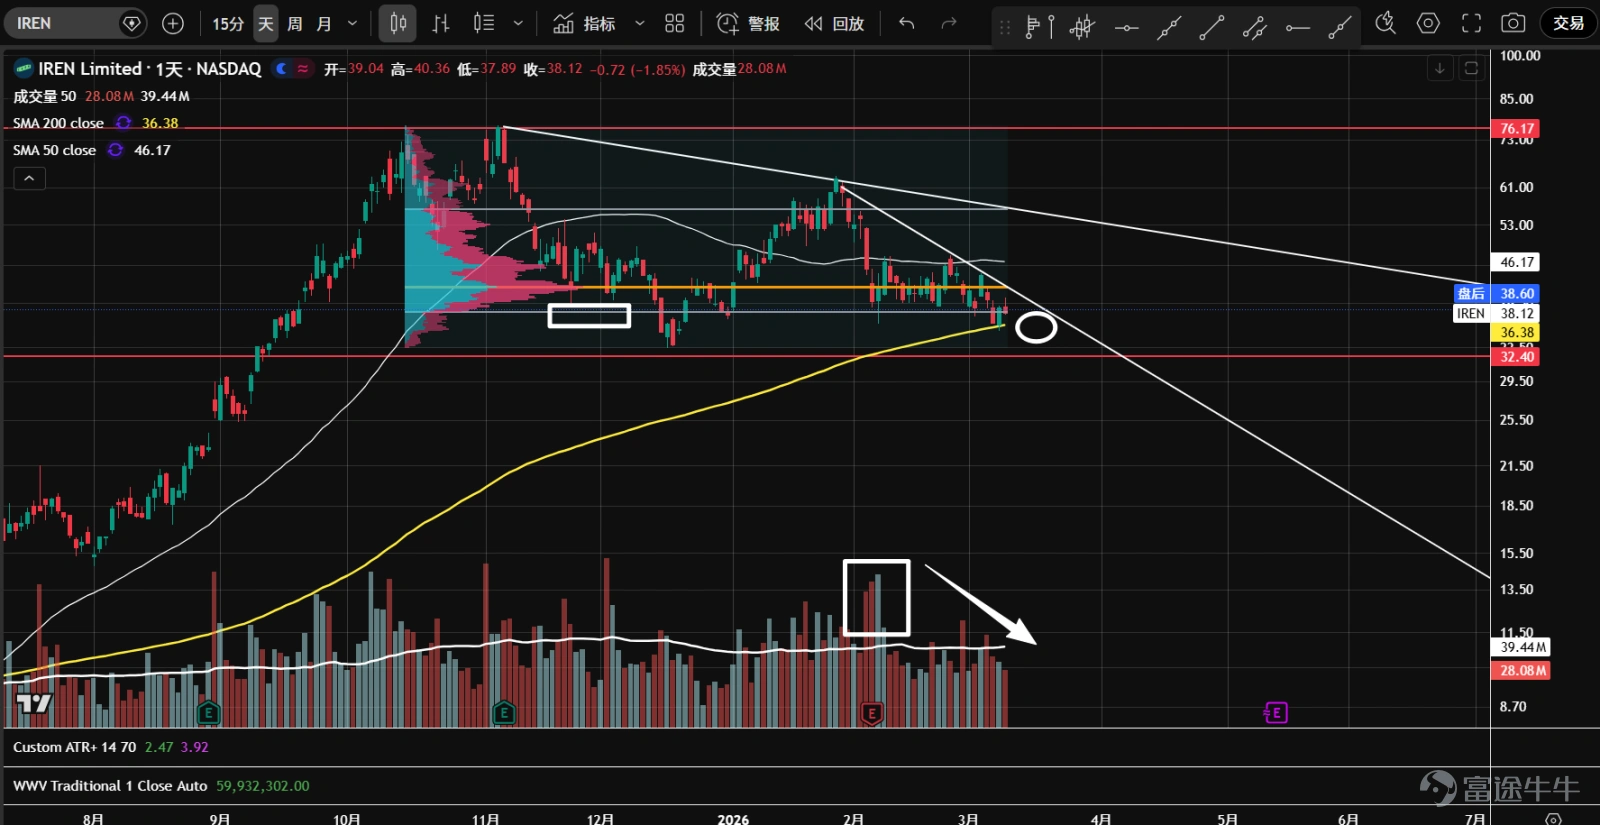
7、 $IREN Ltd (IREN.US)$ The stock exited the triangle pattern. A panic sell-off with reduced volume occurred on the support line at the end of February during a second test, with overall trading volume declining. Subsequently, there was a spike in volume on a decline, but without follow-through. The share price is currently supported by the annual moving average and the lower boundary of the value range, heading toward the apex position. The risk-reward ratio looks favorable.
1、 $Bitcoin (BTC.CC)$ Futures experienced consecutive sharp declines at the end of January and beginning of February. Panic selling occurred near the support level of 57,800, followed by a strong rebound. The 57,800 level represents the 38.2% retracement from the bear market of 2022 and is also the last line of defense below the 60,000 mark. A low-volume second test has now been completed; the market may continue to consolidate and form a b-type volume distribution. It is not advisable to chase highs for now.  2、 $Ethereum (ETH.CC)$ After breaking below the consolidation range from November of last year to January this year, futures accelerated with heavy volume in a downward trend, triggering panic selling. Subsequently, prices naturally rebounded from the support at 1,761, but the rebound was weak, less than the 61.8% retracement of the most recent decline, showing overall weak technical characteristics.   3、 $Robinhood (HOOD.US)$ After breaking below the top triangle, panic selling occurred at the 68.1 support level, followed by a low-volume second test. From the highest point at the top until now, trading volume has formed a b-type distribution. The rebound only reached the 61.8% retracement level of the latest sharp decline, still indicating relative weakness.  4、 $Coinbase (COIN.US)$ After an accelerating selloff on high volume, panic selling emerged at the 146 support level, followed by a natural rebound reaching the...
8、 $Cipher Digital (CIFR.US)$ The stock continues its sideways consolidation movement and has stabilized again at the $13 support level. Toward the latter part of the range, trading volume has gradually declined, but the highs have also been progressively lower. Bears are controlling both price and volume, and the stock is heading toward the apex. There may be some short-term range opportunities, but trend traders are advised to wait for bulls to show strong volume.
1、 $Bitcoin (BTC.CC)$ Futures experienced consecutive sharp declines at the end of January and beginning of February. Panic selling occurred near the support level of 57,800, followed by a strong rebound. The 57,800 level represents the 38.2% retracement from the bear market of 2022 and is also the last line of defense below the 60,000 mark. A low-volume second test has now been completed; the market may continue to consolidate and form a b-type volume distribution. It is not advisable to chase highs for now.  2、 $Ethereum (ETH.CC)$ After breaking below the consolidation range from November of last year to January this year, futures accelerated with heavy volume in a downward trend, triggering panic selling. Subsequently, prices naturally rebounded from the support at 1,761, but the rebound was weak, less than the 61.8% retracement of the most recent decline, showing overall weak technical characteristics.   3、 $Robinhood (HOOD.US)$ After breaking below the top triangle, panic selling occurred at the 68.1 support level, followed by a low-volume second test. From the highest point at the top until now, trading volume has formed a b-type distribution. The rebound only reached the 61.8% retracement level of the latest sharp decline, still indicating relative weakness.  4、 $Coinbase (COIN.US)$ After an accelerating selloff on high volume, panic selling emerged at the 146 support level, followed by a natural rebound reaching the...
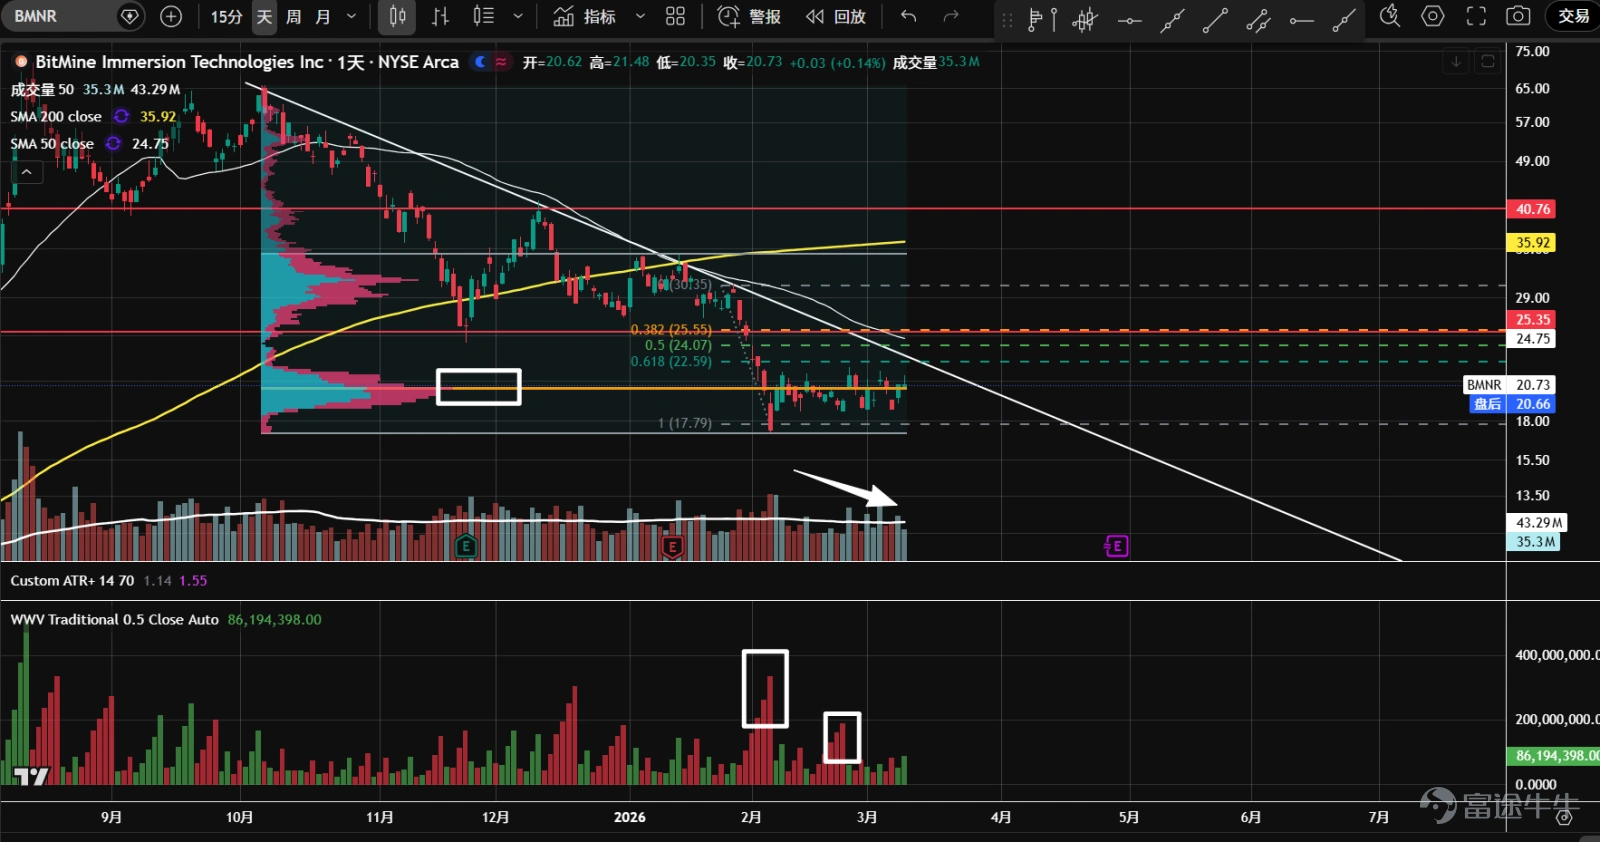
9、 $Bitmine Immersion Technologies (BMNR.US)$ Since February, there has been a surge in volume breaking below the secondary distribution zone formed at the end of November last year. From the perspective of wave volume, there has been a recent panic sell-off followed by a natural rebound. The low-volume second test may now be complete. Since the peak, a B-shaped volume distribution has formed, and the stock is currently near the volume control point (orange). Direction remains unclear, so temporary observation is recommended.
1、 $Bitcoin (BTC.CC)$ Futures experienced consecutive sharp declines at the end of January and beginning of February. Panic selling occurred near the support level of 57,800, followed by a strong rebound. The 57,800 level represents the 38.2% retracement from the bear market of 2022 and is also the last line of defense below the 60,000 mark. A low-volume second test has now been completed; the market may continue to consolidate and form a b-type volume distribution. It is not advisable to chase highs for now.  2、 $Ethereum (ETH.CC)$ After breaking below the consolidation range from November of last year to January this year, futures accelerated with heavy volume in a downward trend, triggering panic selling. Subsequently, prices naturally rebounded from the support at 1,761, but the rebound was weak, less than the 61.8% retracement of the most recent decline, showing overall weak technical characteristics.   3、 $Robinhood (HOOD.US)$ After breaking below the top triangle, panic selling occurred at the 68.1 support level, followed by a low-volume second test. From the highest point at the top until now, trading volume has formed a b-type distribution. The rebound only reached the 61.8% retracement level of the latest sharp decline, still indicating relative weakness.  4、 $Coinbase (COIN.US)$ After an accelerating selloff on high volume, panic selling emerged at the 146 support level, followed by a natural rebound reaching the...
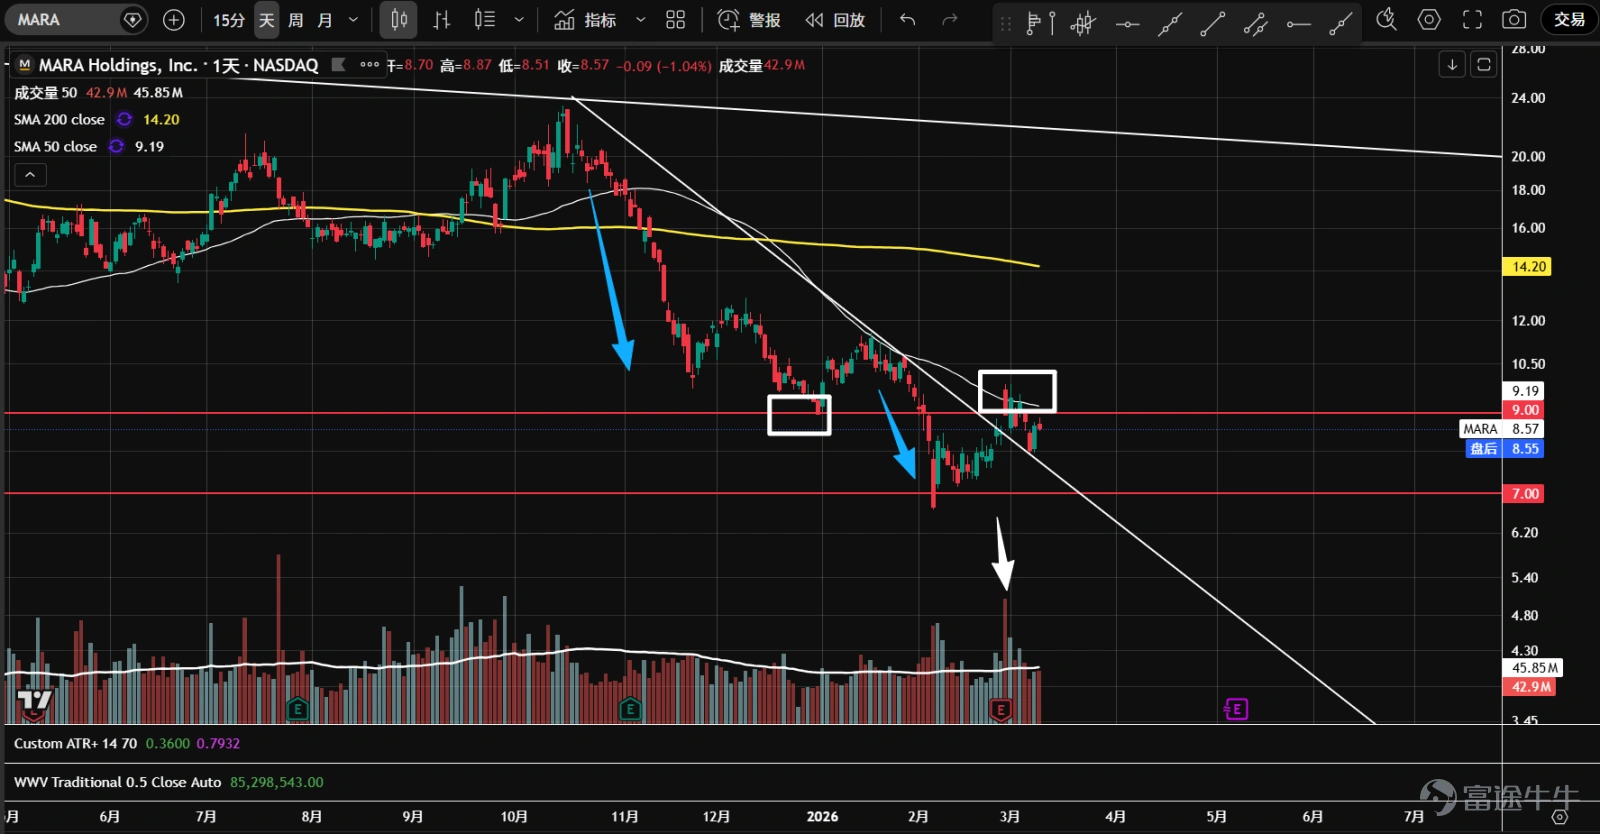
10、 $MARA Holdings (MARA.US)$ In early February, a panic sell-off occurred at the $7 support level, followed by a natural rebound that broke through the downward trendline. At the $9 resistance level, heavy volume impeded further progress, and the stock is currently undergoing a second test. This latest decline has significantly narrowed compared to the October-November period last year, while the rebound has been substantial, indicating strengthening bullish momentum.
1、 $Bitcoin (BTC.CC)$ Futures experienced consecutive sharp declines at the end of January and beginning of February. Panic selling occurred near the support level of 57,800, followed by a strong rebound. The 57,800 level represents the 38.2% retracement from the bear market of 2022 and is also the last line of defense below the 60,000 mark. A low-volume second test has now been completed; the market may continue to consolidate and form a b-type volume distribution. It is not advisable to chase highs for now.  2、 $Ethereum (ETH.CC)$ After breaking below the consolidation range from November of last year to January this year, futures accelerated with heavy volume in a downward trend, triggering panic selling. Subsequently, prices naturally rebounded from the support at 1,761, but the rebound was weak, less than the 61.8% retracement of the most recent decline, showing overall weak technical characteristics.   3、 $Robinhood (HOOD.US)$ After breaking below the top triangle, panic selling occurred at the 68.1 support level, followed by a low-volume second test. From the highest point at the top until now, trading volume has formed a b-type distribution. The rebound only reached the 61.8% retracement level of the latest sharp decline, still indicating relative weakness.  4、 $Coinbase (COIN.US)$ After an accelerating selloff on high volume, panic selling emerged at the 146 support level, followed by a natural rebound reaching the...
11、 $Riot Platforms (RIOT.US)$ At the end of November last year, the stock entered a sideways consolidation phase. In early February, there was a brief surge in volume as it broke below the lower support level, but it quickly rebounded. It was once again rejected by the downward trendline, and the decline showed follow-through. Although overall trading volume was not large, the price fluctuations were still significant. The stock is currently near the volume control point (orange), and observation is advised.
1、 $Bitcoin (BTC.CC)$ Futures experienced consecutive sharp declines at the end of January and beginning of February. Panic selling occurred near the support level of 57,800, followed by a strong rebound. The 57,800 level represents the 38.2% retracement from the bear market of 2022 and is also the last line of defense below the 60,000 mark. A low-volume second test has now been completed; the market may continue to consolidate and form a b-type volume distribution. It is not advisable to chase highs for now.  2、 $Ethereum (ETH.CC)$ After breaking below the consolidation range from November of last year to January this year, futures accelerated with heavy volume in a downward trend, triggering panic selling. Subsequently, prices naturally rebounded from the support at 1,761, but the rebound was weak, less than the 61.8% retracement of the most recent decline, showing overall weak technical characteristics.   3、 $Robinhood (HOOD.US)$ After breaking below the top triangle, panic selling occurred at the 68.1 support level, followed by a low-volume second test. From the highest point at the top until now, trading volume has formed a b-type distribution. The rebound only reached the 61.8% retracement level of the latest sharp decline, still indicating relative weakness.  4、 $Coinbase (COIN.US)$ After an accelerating selloff on high volume, panic selling emerged at the 146 support level, followed by a natural rebound reaching the...
Risk Disclaimer: The above content only represents the author's view. It does not represent any position or investment advice of Futu. Futu makes no representation or warranty.Read more
Thumbs Up
9
Heart
1
Sob
1
683K Views
Report
Comments
Write a Comment...
11
1