
BTC surpasses $75,000! Has the upward channel been fully opened?

Technical Analysis of Cryptocurrencies and Related Stocks (March 4): Bitcoin/Ethereum/HOOD/COIN/MSTR/CRCL/IREN/CIFR/BMNR/MARA/RIOT
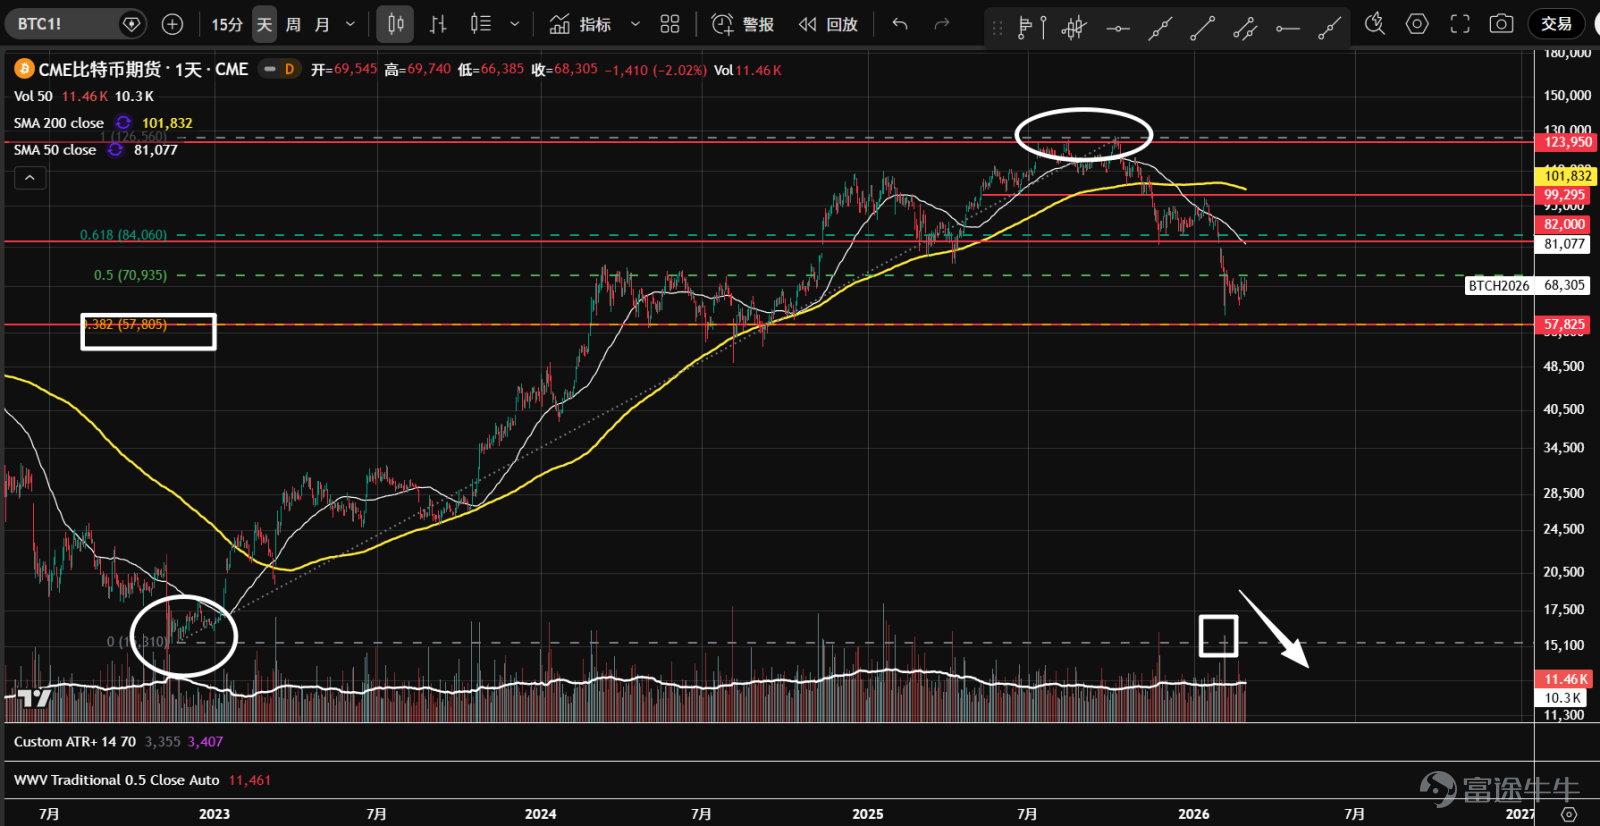
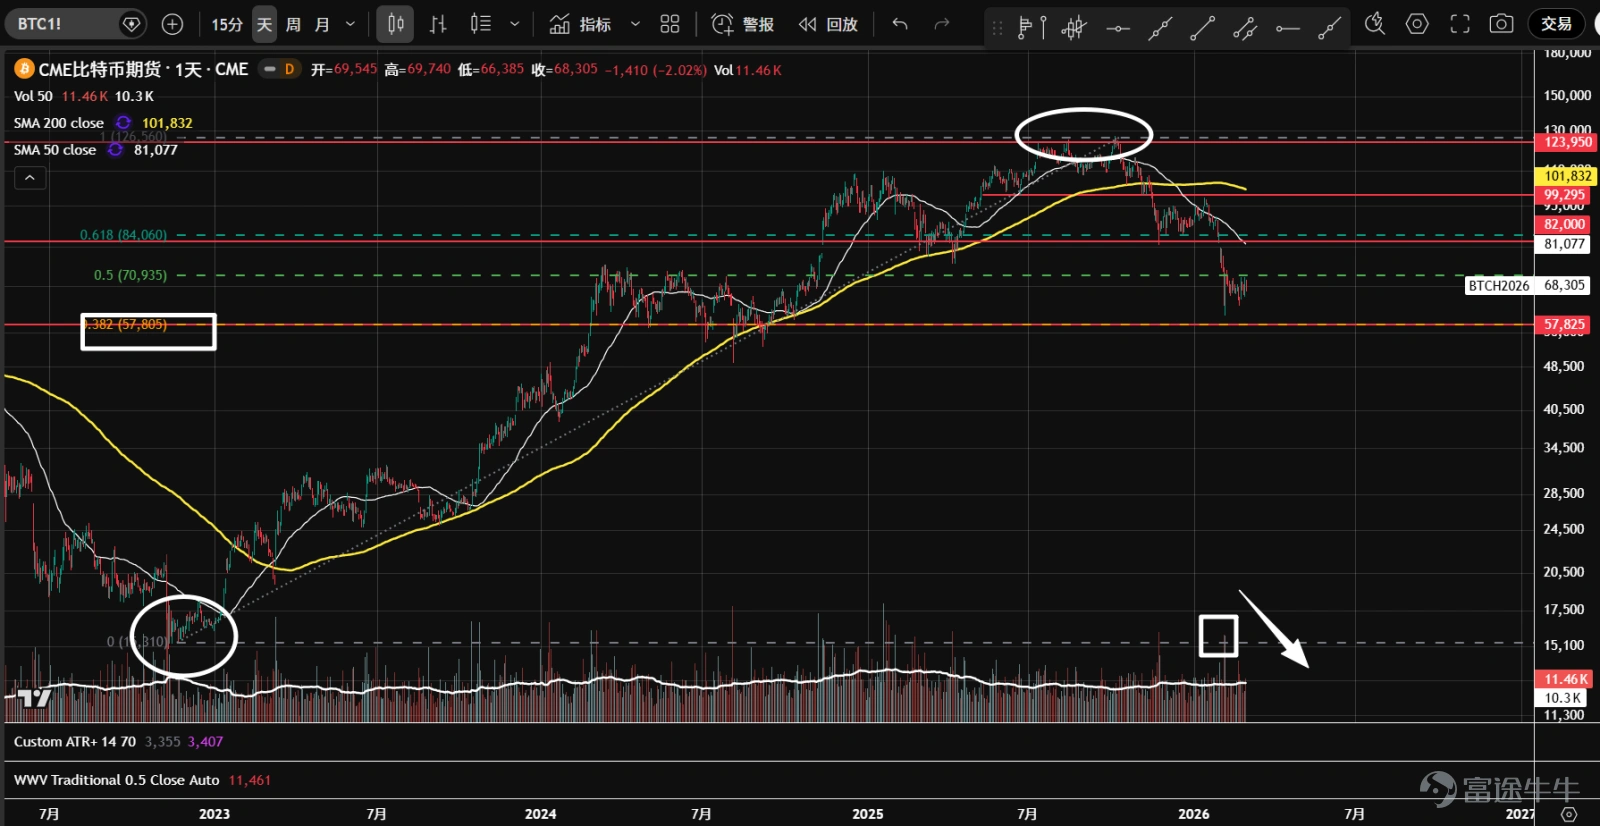
1、 $Bitcoin (BTC.CC)$ Futures plummeted consecutively at the end of January and beginning of February. Panic selling occurred near the support level of 57,800, followed by a sharp rebound. The 57,800 level represents the 38.2% retracement from the lowest point of the 2022 bear market to the highest point of the 2025 bull market and is also the last line of defense below the psychological 60,000 mark. After a recent pullback with reduced volume, prices stabilized and rebounded, potentially completing the second test.
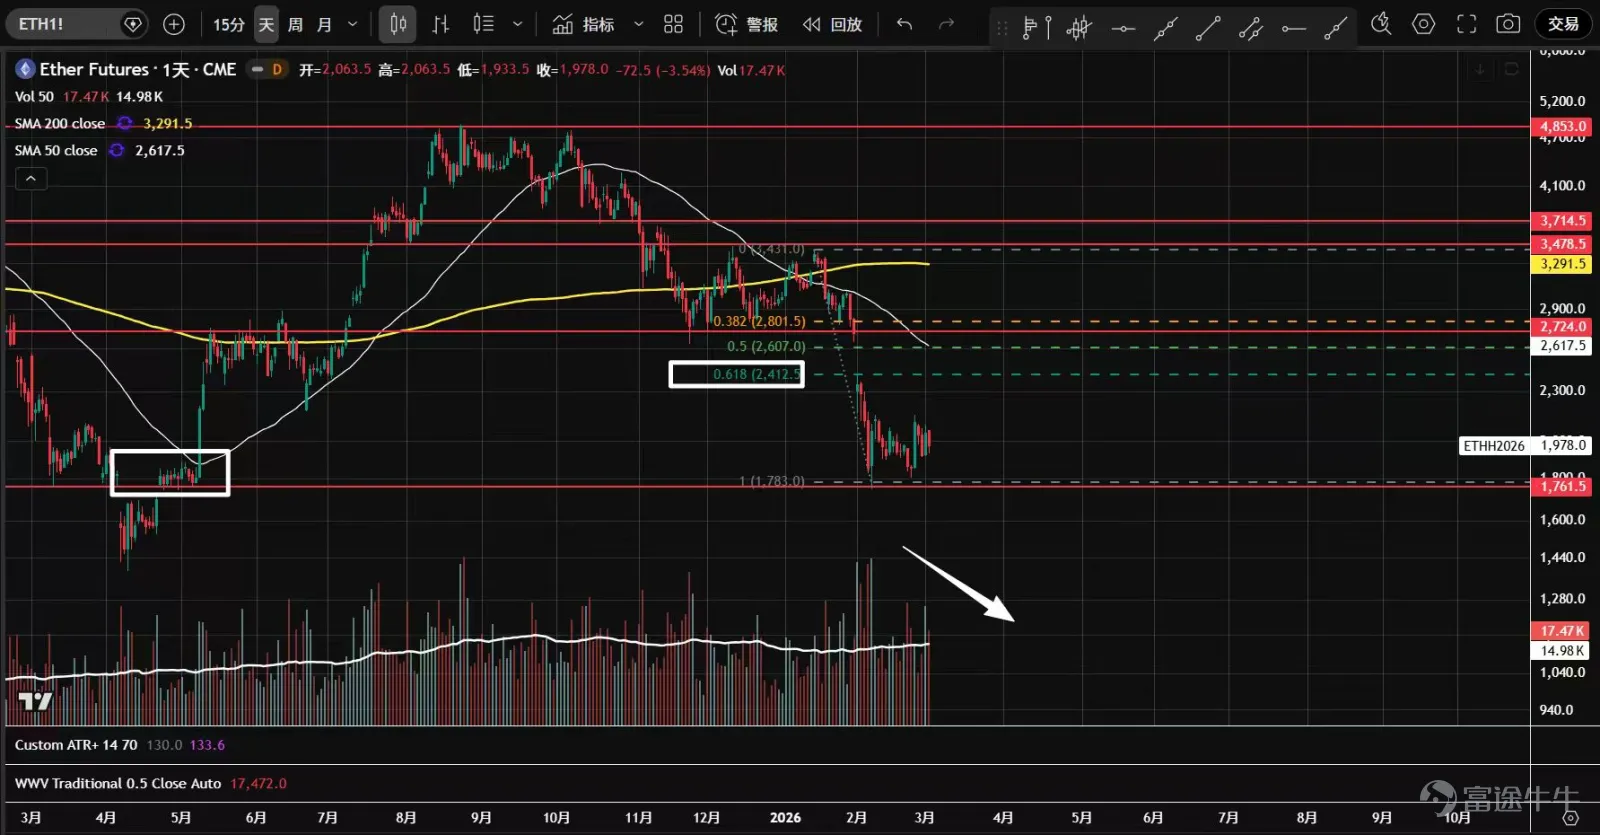
2、 $Ethereum (ETH.CC)$ After futures broke through the consolidation range from November of last year to January of this year, they accelerated into a volume-driven decline, accompanied by panic selling. Subsequently, prices naturally rebounded from the 1,761 support level, but the rebound was weak, failing to reach 61.8% of the most recent downward wave. Currently undergoing a second test, the technical outlook is weak, and attention should be paid to whether the market can stabilize in the future.
3、 $Robinhood (HOOD.US)$ At the end of January and beginning of February, there was a surge in trading volume breaking through the top triangle structure. Panic selling appeared near the 75 level, followed by a natural rebound. Currently undergoing a second test with lower trading volumes, the short-term outlook may involve sideways consolidation, but the long-term trend remains very weak.

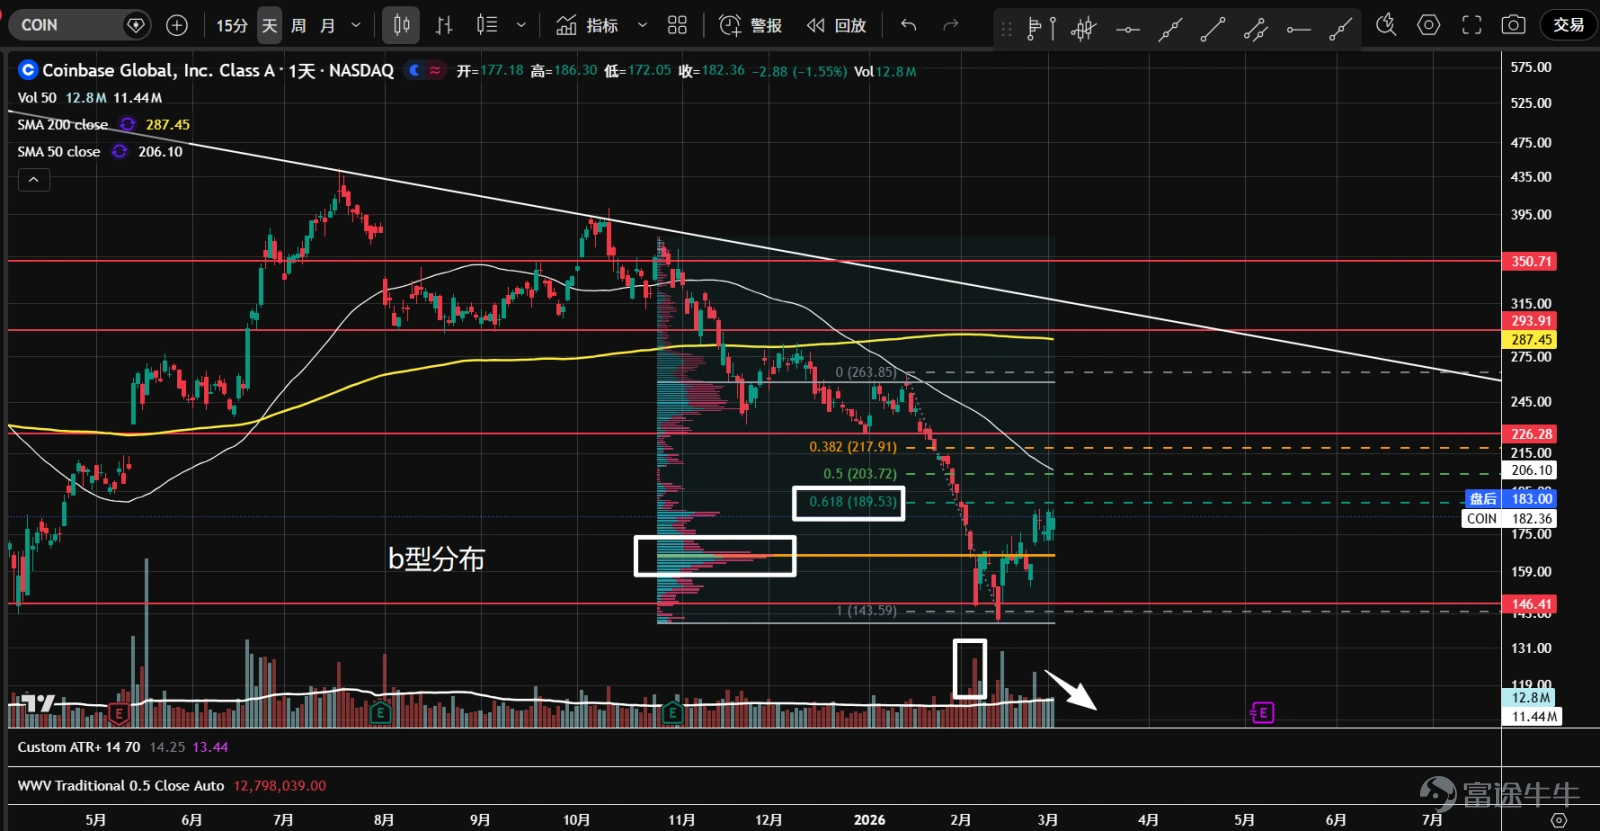
4、 $Coinbase (COIN.US)$ In November last year, it entered a period of consolidation, then broke down through the 226 bottom support and the lower boundary of the value range in late January, resuming the downward trend. At the 146 support level, panic selling briefly occurred, followed by a natural rebound to the 61.8% retracement level of this decline. Trading volume declined, suggesting a possible second retest. Since the fall began in November last year, the trading volume distribution has formed a 'B' pattern, shifting the focus of positions downward, possibly forming a new range.
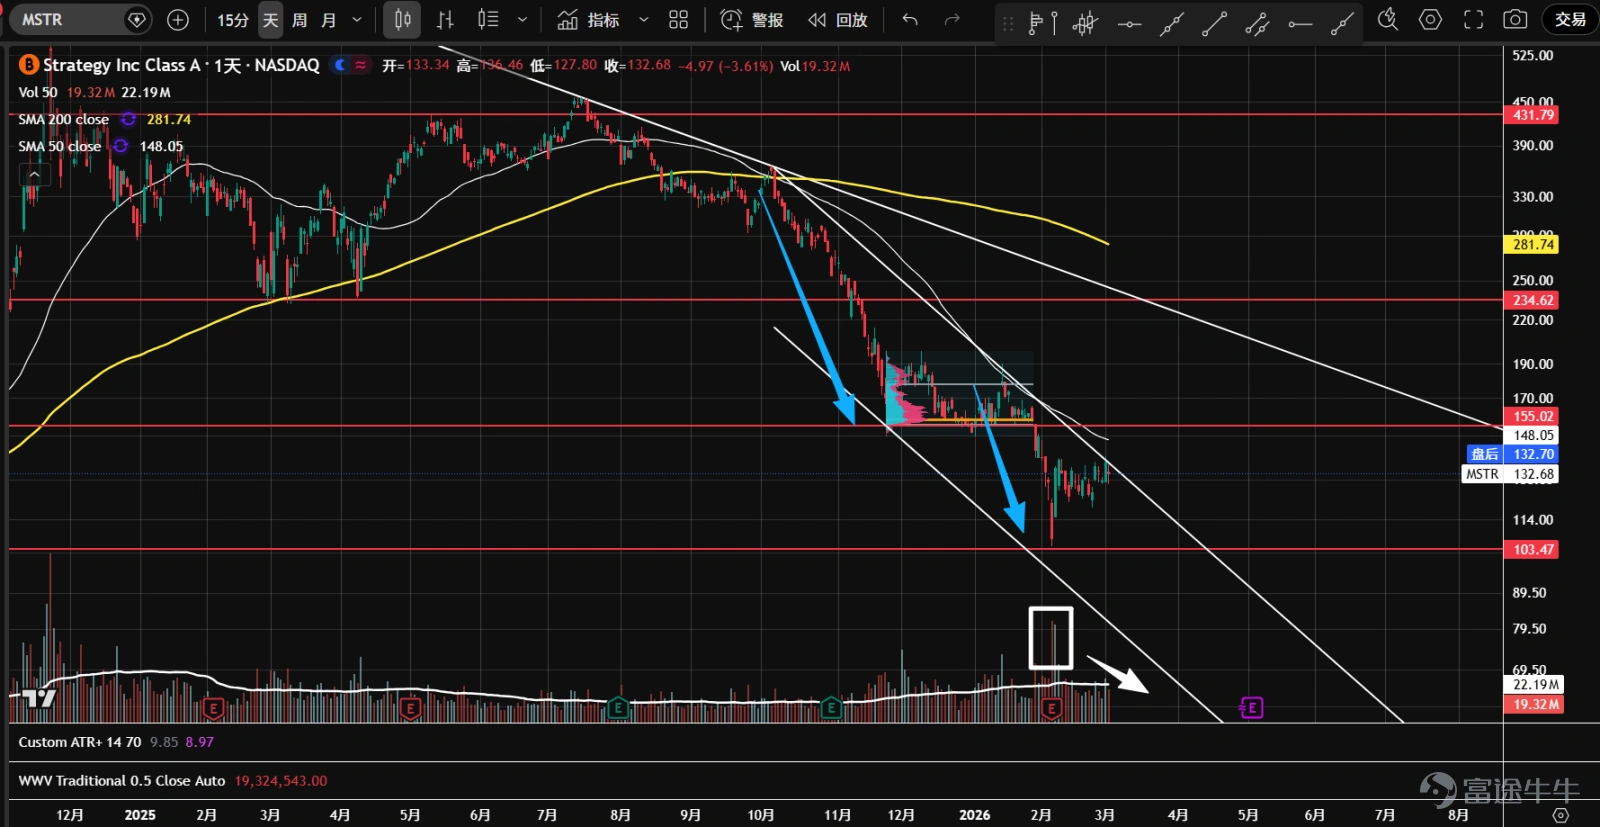
5、 $Strategy (MSTR.US)$ At the beginning of February, panic selling and a natural rebound occurred at the major support level of 103.5. The pullback during the second test was shallow, and the magnitude of the most recent decline significantly decreased compared to the end of last year. The bulls are starting to accumulate energy, and the market may form a bottom accumulation range going forward.
6、 $Circle (CRCL.US)$ After the earnings report, the stock price surged on a large gap and broke through the downtrend line. Due to the significant trading volume and upward movement, and with the nearby resistance at 109, which is also the 38.2% retracement level since November last year, a short-term pullback might occur, and chasing the rally is not advisable.

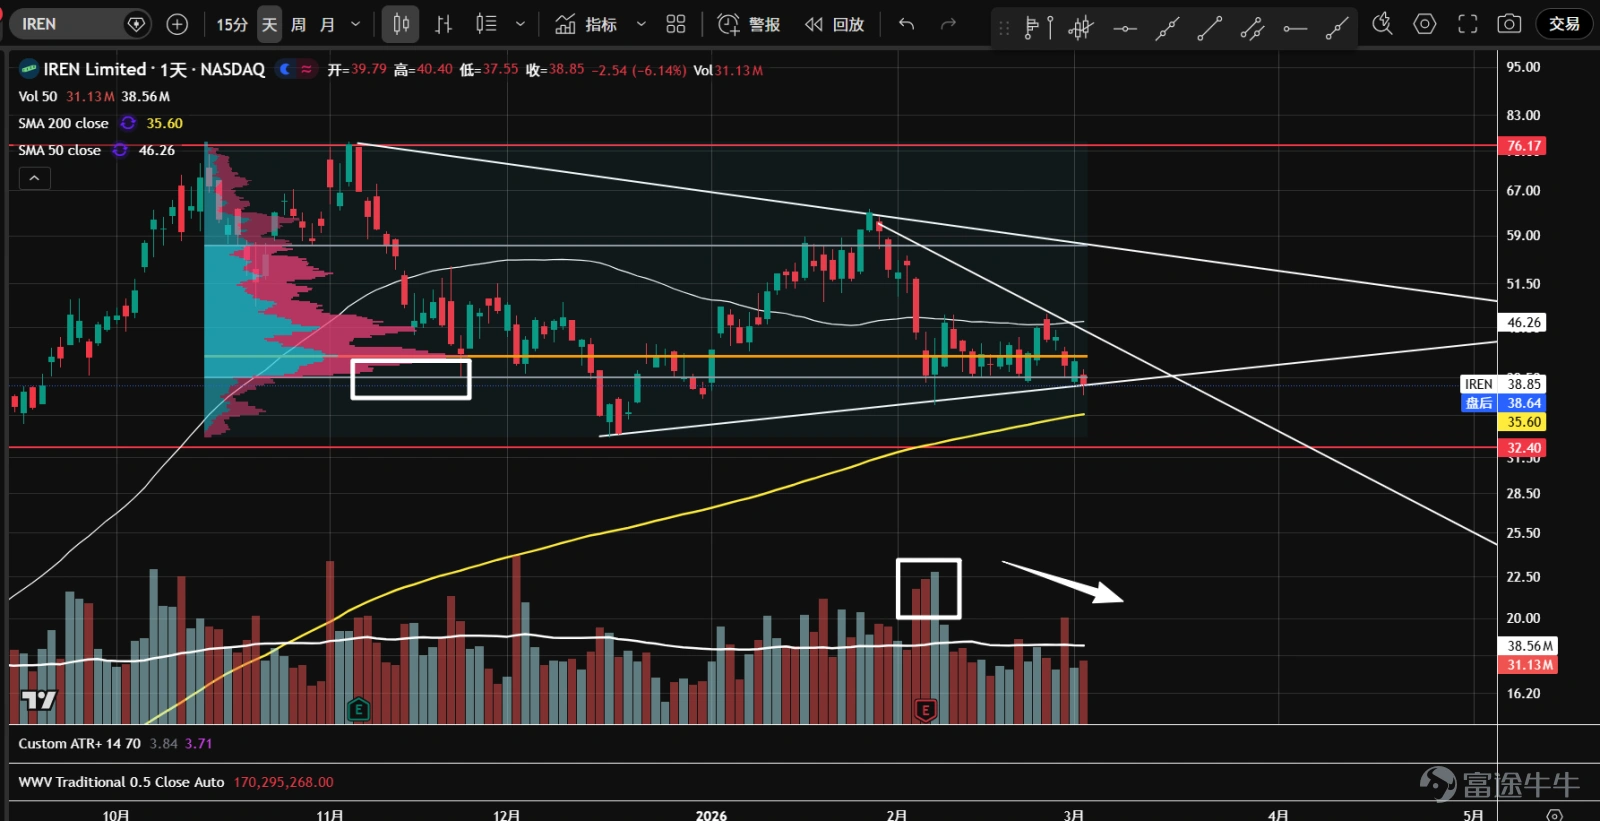
7、 $IREN Ltd (IREN.US)$ Breaking out of the triangle pattern, panic selling and a second test occurred on the support line in early February, with overall trading volume declining. The sharp drop on February 27 did not follow through, with the stock price closing at strong support, standing at the lower edge of the value zone and above the upward trendline. It is currently heading toward the apex, offering a favorable risk-reward ratio.
8、 $Cipher Digital (CIFR.US)$ Exiting the converging triangle pattern and approaching the apex. In the latter part of the range, trading volume gradually decreased, with the stock price pausing at strong support. Currently, the stock has rebounded from the lower edge of the value zone and the trendline, closing with a lower shadow, indicating a good risk-reward ratio.

9、 $Bitmine Immersion Technologies (BMNR.US)$ Starting in early February, there was a sharp decline in trading volume, breaking below the secondary distribution range formed since the end of November last year. Panic selling briefly emerged, followed by a natural rebound, but the rebound was not substantial. The stock is currently undergoing a low-volume secondary test, showing weak technical characteristics.

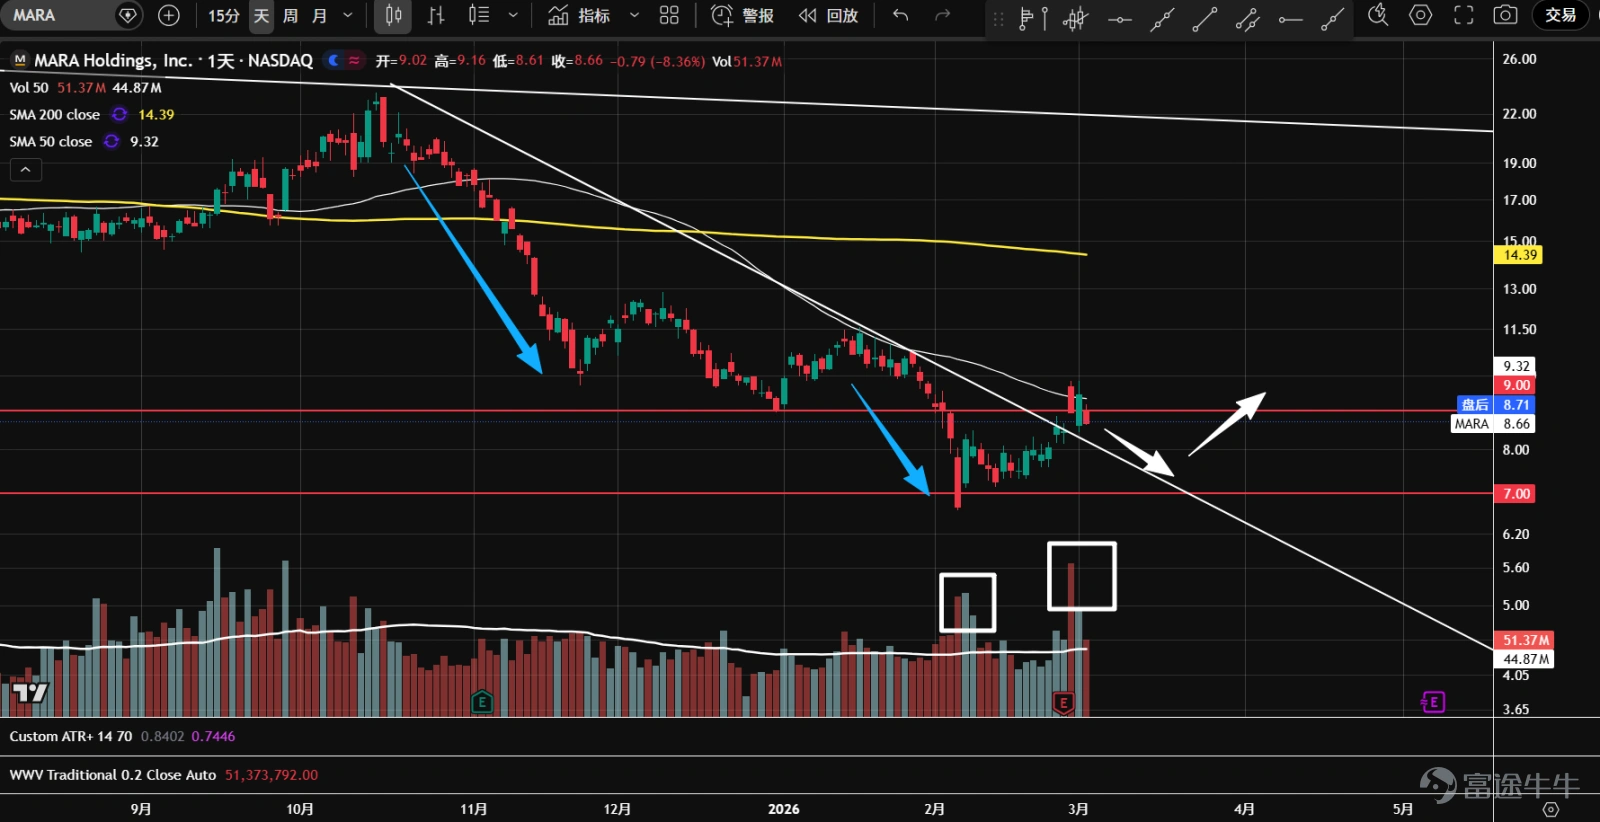
10、 $MARA Holdings (MARA.US)$ In early February, panic selling occurred at the $7 support level, followed by a natural rebound that broke through the downward trendline. The stock price reached the $9 resistance level before retreating with increased trading volume, potentially initiating a secondary test. The magnitude of this decline was significantly smaller than that of October-November last year, with a very strong rebound, indicating strengthening bullish momentum.
11、 $Riot Platforms (RIOT.US)$ Since the end of November last year, the stock entered a sideways consolidation pattern. In early February, it briefly broke below the lower support with heavy volume but quickly rebounded, forming a bullish volume-price cycle. Recently, it faced resistance at the downward trendline, resulting in a high-volume bearish candlestick. The stock is currently near the volume control point (orange line), warranting temporary observation.

$S&P 500 Index (.SPX.US)$ $SPDR S&P 500 ETF (SPY.US)$ $NASDAQ 100 Index (.NDX.US)$ $Invesco QQQ Trust (QQQ.US)$ $Dow Jones Industrial Average (.DJI.US)$ $State Street® SPDR® Dow Jones Industrial Average® ETF Trust (DIA.US)$ $Russell 2000 Index (.RUT.US)$ $iShares Russell 2000 ETF (IWM.US)$ $Bitcoin (BTC.CC)$ $CME-Bitcoin RR Futures (JUL6) (BTCmain.US)$ $iShares Ethereum Trust ETF (ETHA.US)$
Risk Disclaimer: The above content only represents the author's view. It does not represent any position or investment advice of Futu. Futu makes no representation or warranty.Read more


Comments
to post a comment
7
2