
BTC surpasses $75,000! Has the upward channel been fully opened?

Technical Analysis of Cryptocurrencies and Related Stocks (February 4): Bitcoin/Ethereum/HOOD/COIN/MSTR/CRCL/IREN/CIFR/BMNR/MARA/RIOT
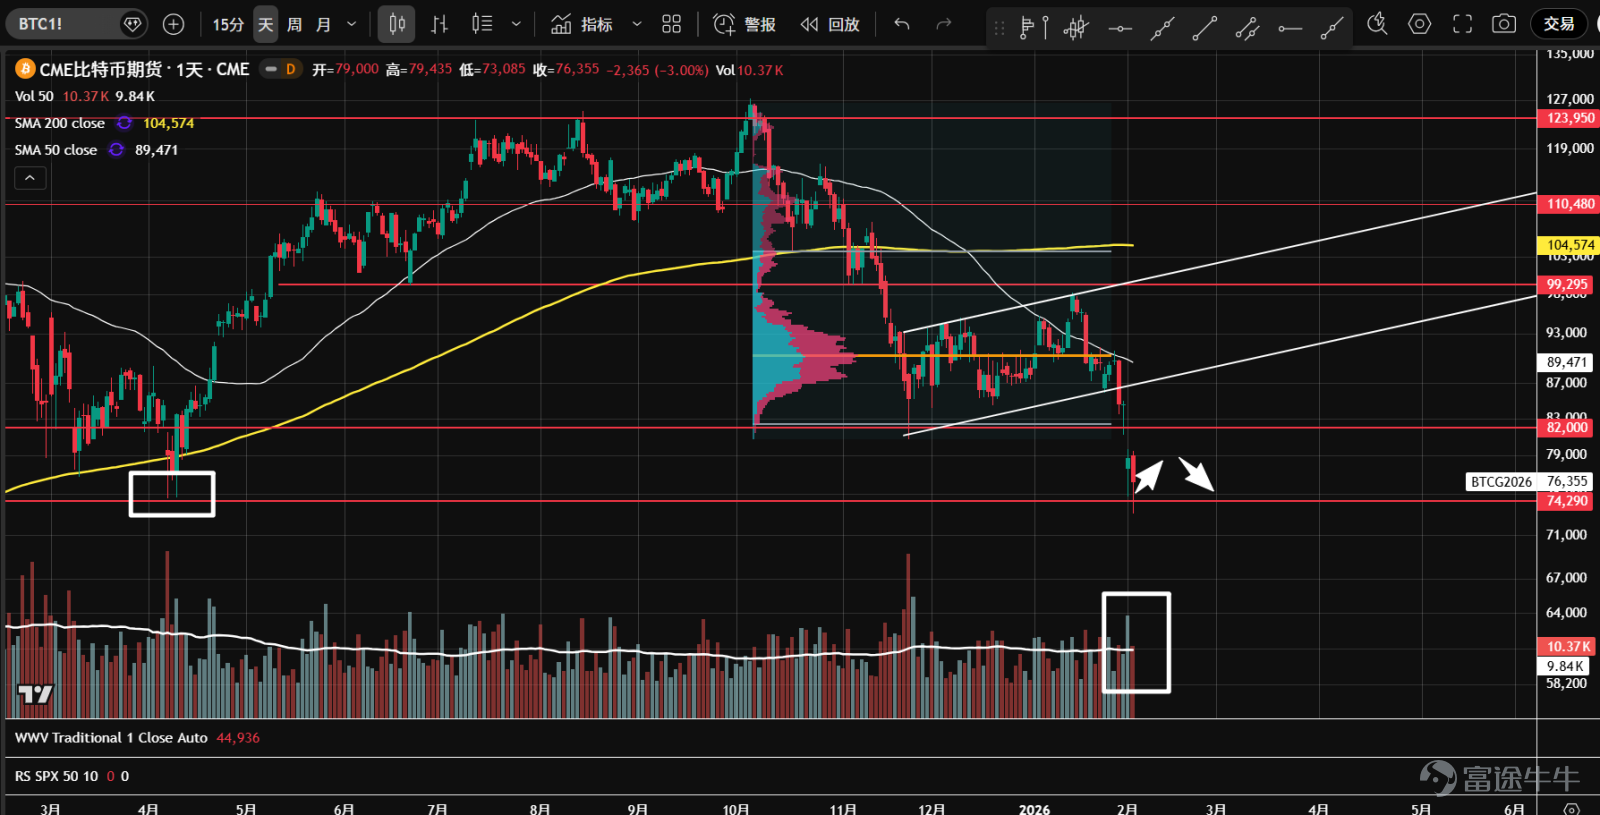
1、 $BTC/USD (BTCUSD.CC)$Futures, impacted by systemic risk, broke below the 82,000 support level, invalidating the double-bottom structure. Currently, panic selling has appeared at the 74,300 pivot support, with a long lower shadow formed on the candlestick. Awaiting natural rebound and secondary testing to see if the support holds.

2、 $ETH/USD (ETHUSD.CC)$Futures broke below the key support level of 2,720, exiting a one-and-a-half-month consolidation range and leaving a large gap. Currently, panic selling is evident at the 2,170 support level, forming a long lower shadow. Waiting for a natural rebound and secondary testing to assess whether it can stabilize.

3、 $Robinhood (HOOD.US)$The price broke below the pivotal support at 101.7 and the yearly moving average, with heavy volume and a gap left behind, closing the candlestick at a low level. This may indicate an effective breakout, and if it does not stabilize in the short term, a downtrend could begin.

4、 $Coinbase (COIN.US)$Since November last year, the stock has been consolidating sideways. At the end of January, it broke down below the 226 support and the lower boundary of the value range, re-entering a downward trend. The decline is fierce, with strong bearish volume-price momentum; there's no rush to bottom-fish.

5、 $Strategy (MSTR.US)$ The stock entered a consolidation phase in November of last year, and the volume distribution has formed a B-type structure. The trading volume is huge, showing clear signs of distribution. At the end of January, it broke down through the lower support level with significant volume. If it fails to recover soon, it may continue to decline.

6、 $Circle (CRCL.US)$ The stock started consolidating in late November of last year. Mid-January’s attempt to break above the upper boundary of the value range failed, and now it has entered a bearish price-volume cycle. At the end of January, it broke down through the 65.5 support level on heavy volume. If it cannot recover soon, it might open further downside space and extend the downtrend that began in July of last year.

7、 $IREN Ltd (IREN.US)$ Starting from mid-December of last year, the stock entered an upward trend but is currently facing resistance at the 38.2% retracement level of the previous decline. Trading volume continues to expand, indicating intense competition between bulls and bears. For now, it’s best to stay on the sidelines.

8、 $Cipher Digital (CIFR.US)$ The stock continues to oscillate within a sideways range. Overall trading volume had significantly contracted, but recently, as the price approaches the convergence point, volume has started to pick up again, showing evident signs of distribution. A breakout or breakdown may occur soon, so for now, it’s better to remain on the sidelines.

9、 $Bitmine Immersion Technologies (BMNR.US)$ Since November of last year, the stock has been forming a descending triangle pattern, with each rebound reaching lower highs. After failing to bounce back on reduced volume in late January, it broke down below the 25.35 support level on increased volume. If it fails to recover soon, it might open further downside potential and extend the downtrend.

10、 $MARA Holdings (MARA.US)$ In November of last year, the stock entered a sideways consolidation range, and it is now retesting the previous low support level from the end of December. This round of trading volume is higher than the last decline, indicating substantial selling pressure. It is advisable to stay on the sidelines for now.

11、 $Riot Platforms (RIOT.US)$ The stock entered a consolidation zone in November of last year. At the beginning of January, it rebounded sharply from the 12.5 support level and broke through the 16.55 resistance level. However, it soon encountered a buying climax at the 18.57 resistance level before falling back into the consolidation zone, creating a false breakout. Future focus will be on whether it can stabilize, with key supports at the volume control point (orange line) and the annual moving average.

$S&P 500 Index (.SPX.US)$ $SPDR S&P 500 ETF (SPY.US)$ $NASDAQ 100 Index (.NDX.US)$ $Invesco QQQ Trust (QQQ.US)$ $Dow Jones Industrial Average (.DJI.US)$ $State Street® SPDR® Dow Jones Industrial Average® ETF Trust (DIA.US)$ $Russell 2000 Index (.RUT.US)$ $iShares Russell 2000 ETF (IWM.US)$ $Bitcoin (BTC.CC)$ $CME-Bitcoin RR Futures (JUL6) (BTCmain.US)$ $iShares Ethereum Trust ETF (ETHA.US)$
Risk Disclaimer: The above content only represents the author's view. It does not represent any position or investment advice of Futu. Futu makes no representation or warranty.Read more


Comments (6)
to post a comment
11