
English
Back
Open Account
The Fed raises interest rates for the first time in three years! How will the market react?

美股在逃哈士奇
joined discussion · Aug 10 13:50

The worse the jobs data, the higher the stock market rises? Is Wall Street playing a contrarian indicator?

Last Friday, the U.S. July nonfarm payroll data was released—with a decline of 23,000 jobs, with expectations for an increase of 80,000 jobs. The actual figure not only fell far short of expectations but also came in below the lowest forecast among all economists. May and June figures were also cumulatively revised down by 103,000 jobs. Negative job growth should, in theory, have triggered panic—but U.S. stocks rose instead.
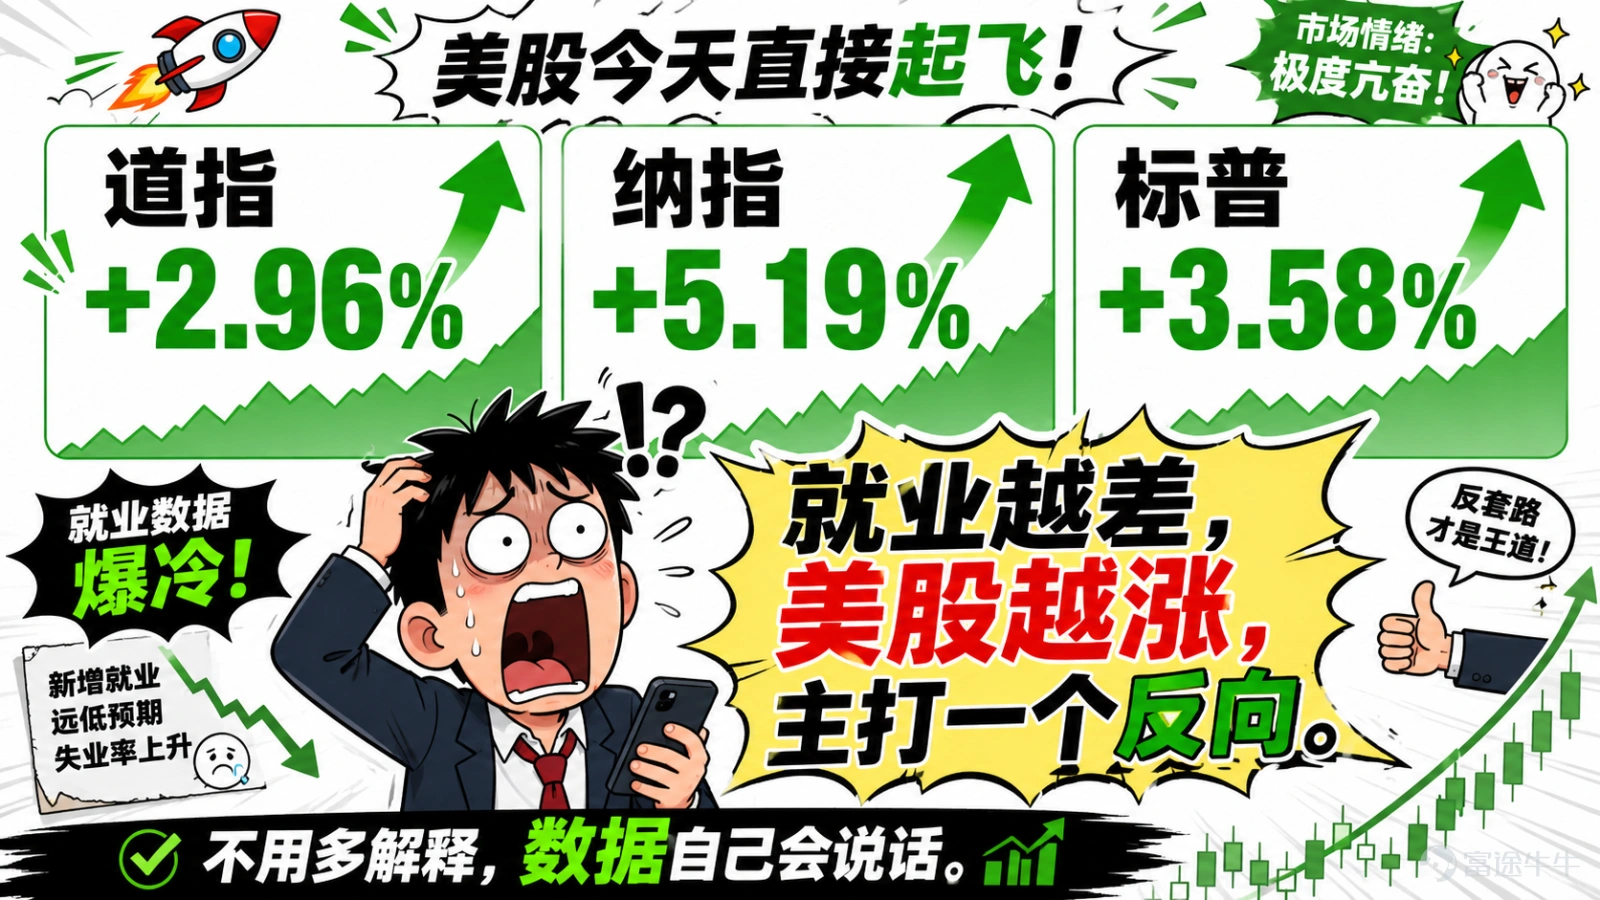
The S&P 500 closed at7,757.64, up 0.62%, setting a new record closing high.The Nasdaq gained 1.3%, and the Dow rose 0.28%. All three major indexes posted their biggest weekly gains since mid-April—the Dow climbed 2.96% for the week, the Nasdaq surged 5.19%, and the S&P 500 rose 3.58%.

Last Friday, the U.S. July nonfarm payrolls report was released—with a decline of 23,000 jobs, with an expected increase of 80,000 jobs. The actual figure not only fell far short of expectations but also came in below the lowest forecast among all economists. Data for May and June were collectively revised down by 103,000 jobs. A decline in employment should, in theory, trigger panic—but U.S. stocks rose instead. The S&P 500 closed at7,757.64, up 0.62%, setting a new record closing high. The Nasdaq rose 1.3%, and the Dow Jones Industrial Average gained 0.28%. All three major indexes posted their biggest weekly gains since mid-April—the Dow climbed 2.96% for the week, the Nasdaq surged 5.19%, and the S&P 500 advanced 3.58%. The logic is as follows: Weak jobs data → reduced expectations for rate hikes → risk assets rally. Following the release, the probability of a September rate hike plunged from 67% to 44%. The weaker the employment data, the more exuberant the market—this is the essence of a 'contrarian indicator.' The chief economist at AE Wealth Management was baffled: 'Markets should, in theory, react negatively to weak employment data, higher inflation, and slowing economic growth. Yet the opposite is happening—markets keep hitting new records. This is truly puzzling.' But! Rally aside, this week is the real 'big test.' At 20:30 on Wednesday, the U.S. July CPI data will be released. According to a Reuters survey, economists expect the headline CPI year-over-year rate to ease from June's 3.5% to3.4%, and core CPI to decline from 2.6% to2.5%. Bloomberg’s forecast is even more optimistic—...
The logic is as follows: Weak employment → cooler rate hike expectations → a rally in risk assets. Following the data release, the probability of a September rate hike plunged from 67% to 44%. The weaker the jobs data, the more euphoric the market—making it a textbook 'contrarian indicator.' The chief economist at AE Wealth Management was baffled: 'Markets should, in theory, react negatively to weak employment data, higher inflation, and slowing economic growth. Yet that’s not what’s happening—in fact, markets keep hitting new records. It’s truly puzzling.'
But!
Party all you want, but this week is the real 'big test.'
On Wednesday at 20:30, the U.S. July CPI will be released.
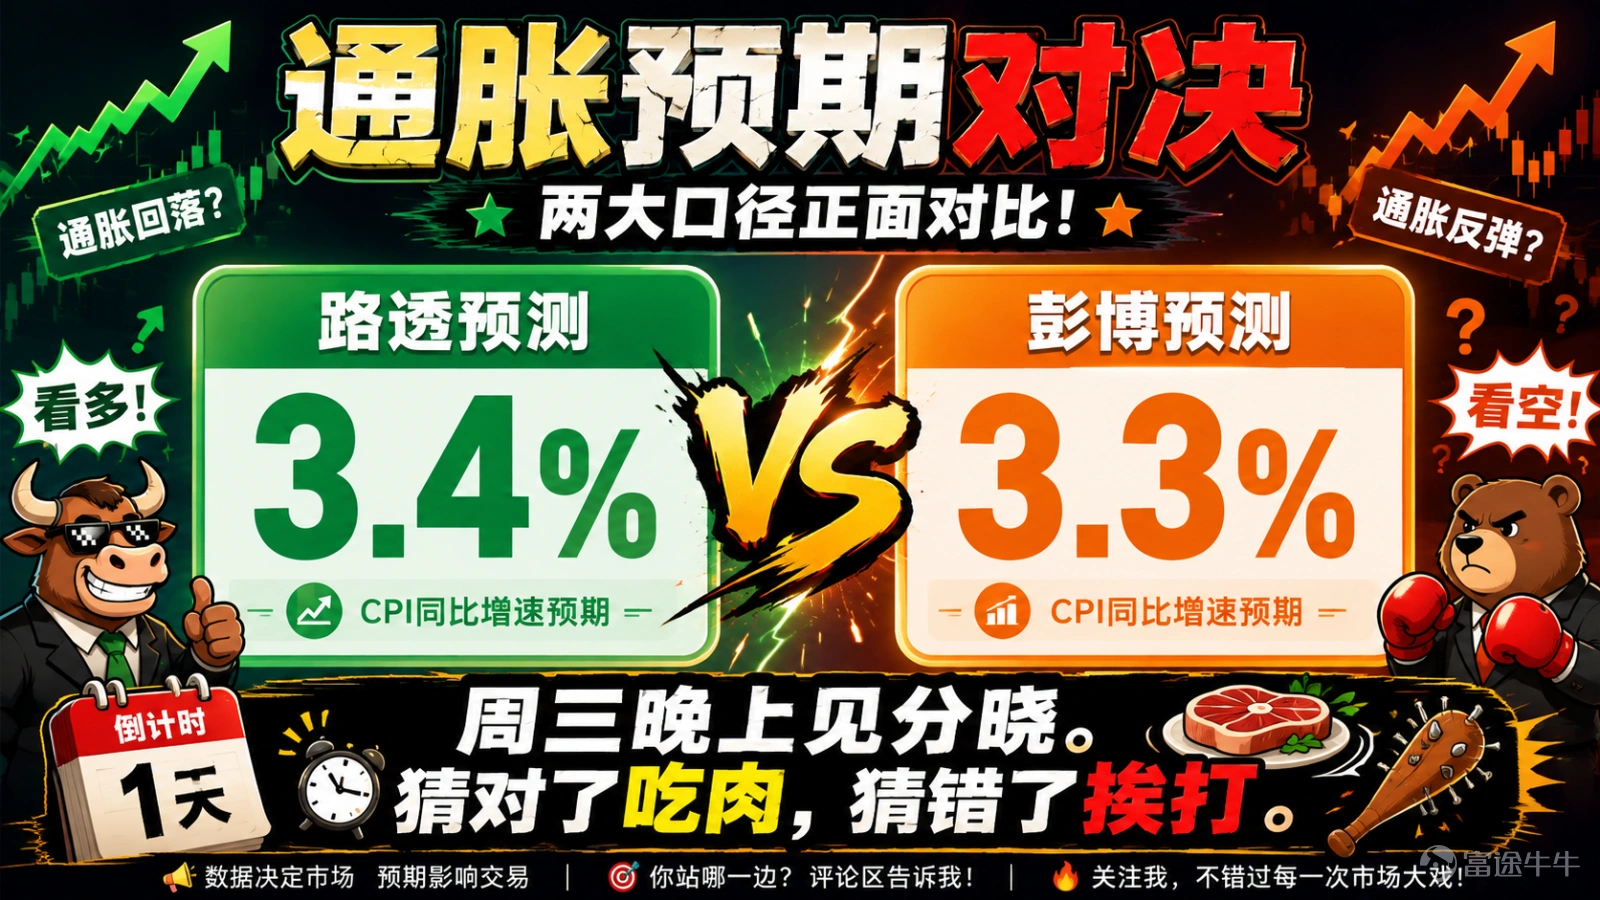
According to a Reuters survey, economists expect headline CPI year-over-year to ease from June's 3.5% to3.4%, and core CPI to decline from 2.6% to2.5%. Bloomberg’s forecast is even more optimistic—headline CPI year-over-year falling to3.3%, and core CPI dropping to2.4%. Economists expect both headline and core CPI to rise by0.2%on a month-over-month basis. If CPI continues to cool, the likelihood of a September rate hike could weaken further, fueling another rally in growth stocks and gold. But if CPI reaccelerates, that would spell trouble—the market might be forced to reprice tighter monetary policy, putting pressure on elevated U.S. equity valuations.
Last Friday, the U.S. July nonfarm payrolls report was released—with a decline of 23,000 jobs, with an expected increase of 80,000 jobs. The actual figure not only fell far short of expectations but also came in below the lowest forecast among all economists. Data for May and June were collectively revised down by 103,000 jobs. A decline in employment should, in theory, trigger panic—but U.S. stocks rose instead. The S&P 500 closed at7,757.64, up 0.62%, setting a new record closing high. The Nasdaq rose 1.3%, and the Dow Jones Industrial Average gained 0.28%. All three major indexes posted their biggest weekly gains since mid-April—the Dow climbed 2.96% for the week, the Nasdaq surged 5.19%, and the S&P 500 advanced 3.58%. The logic is as follows: Weak jobs data → reduced expectations for rate hikes → risk assets rally. Following the release, the probability of a September rate hike plunged from 67% to 44%. The weaker the employment data, the more exuberant the market—this is the essence of a 'contrarian indicator.' The chief economist at AE Wealth Management was baffled: 'Markets should, in theory, react negatively to weak employment data, higher inflation, and slowing economic growth. Yet the opposite is happening—markets keep hitting new records. This is truly puzzling.' But! Rally aside, this week is the real 'big test.' At 20:30 on Wednesday, the U.S. July CPI data will be released. According to a Reuters survey, economists expect the headline CPI year-over-year rate to ease from June's 3.5% to3.4%, and core CPI to decline from 2.6% to2.5%. Bloomberg’s forecast is even more optimistic—...
Technical perspective: Everything is at elevated levels, but hasn’t gone completely berserk yet.
The S&P 500 closed at 7,757 on Friday, marking the first time in history it has surpassed 7,750. The RSI stands at 63.3—not yet at the overbought level of 70—but the weekly RSI has hovered above 65 for three consecutive weeks. The MACD histogram is flattening, indicating that upward momentum is slowing. The ADX is at 33.9, reflecting a strong trend, but lacking further upward thrust.
Last Friday, the U.S. July nonfarm payrolls report was released—with a decline of 23,000 jobs, with an expected increase of 80,000 jobs. The actual figure not only fell far short of expectations but also came in below the lowest forecast among all economists. Data for May and June were collectively revised down by 103,000 jobs. A decline in employment should, in theory, trigger panic—but U.S. stocks rose instead. The S&P 500 closed at7,757.64, up 0.62%, setting a new record closing high. The Nasdaq rose 1.3%, and the Dow Jones Industrial Average gained 0.28%. All three major indexes posted their biggest weekly gains since mid-April—the Dow climbed 2.96% for the week, the Nasdaq surged 5.19%, and the S&P 500 advanced 3.58%. The logic is as follows: Weak jobs data → reduced expectations for rate hikes → risk assets rally. Following the release, the probability of a September rate hike plunged from 67% to 44%. The weaker the employment data, the more exuberant the market—this is the essence of a 'contrarian indicator.' The chief economist at AE Wealth Management was baffled: 'Markets should, in theory, react negatively to weak employment data, higher inflation, and slowing economic growth. Yet the opposite is happening—markets keep hitting new records. This is truly puzzling.' But! Rally aside, this week is the real 'big test.' At 20:30 on Wednesday, the U.S. July CPI data will be released. According to a Reuters survey, economists expect the headline CPI year-over-year rate to ease from June's 3.5% to3.4%, and core CPI to decline from 2.6% to2.5%. Bloomberg’s forecast is even more optimistic—...
Plain English translation:It can still rise, but not as vigorously as before.
The Nasdaq reached an intraday high of 29,956 last week, just 44 points shy of 30,000. The KDJ indicator has already entered overbought territory. What does this mean? It’s risen too quickly in the short term and needs to catch its breath. The Dow Jones Industrial Average also shows an elevated weekly RSI, and its daily chart formed a 'shooting star' candlestick pattern—a bearish signal typically seen at highs, suggesting selling pressure from above.
All three major indices are expensive, but none have reached the point where a crash is inevitable.The market is currently in a state of 'wanting to pull back but lacking a catalyst, and wanting to rally higher but running out of steam.'
One-sentence summary:
Nonfarm payrolls came in negative yet markets hit new highs—the market has gone mad. But this week’s CPI report will be the real 'truth-revealing mirror': whether the rally continues or reality sets inWe’ll know for sure Wednesday evening. Until the data is released, everything is just speculation; once it’s out, we’ll see who’s really calling the shots.
Risk Disclaimer: The above content only represents the author's view. It does not represent any position or investment advice of Futu. Futu makes no representation or warranty.Read more
Emm
1
Thumbs Up
1
Heart
2
Respect
1
47K Views
Report
Comments
Write a Comment...
5
1