BTC returns to $85,000! Is the crypto market heating up again?

BTC sees a strong rebound on the weekly chart; has a new bull market arrived?
Over the past week, $Bitcoin (BTC.CC)$ it staged the most remarkable rally of the year: prices surged from around $62,700 to approximately $79,500, marking a weekly gain of nearly 22%.
For many retail investors, this "sudden" market move caught them off guard.The market is now focusing on a core question: Does this trend signal a reversal at the end of the bear market, or is it merely a short-term impulse driven by a short squeeze?
BTC sees a strong rebound on the weekly chart; will the bull markets of 2019 and 2023 repeat themselves?
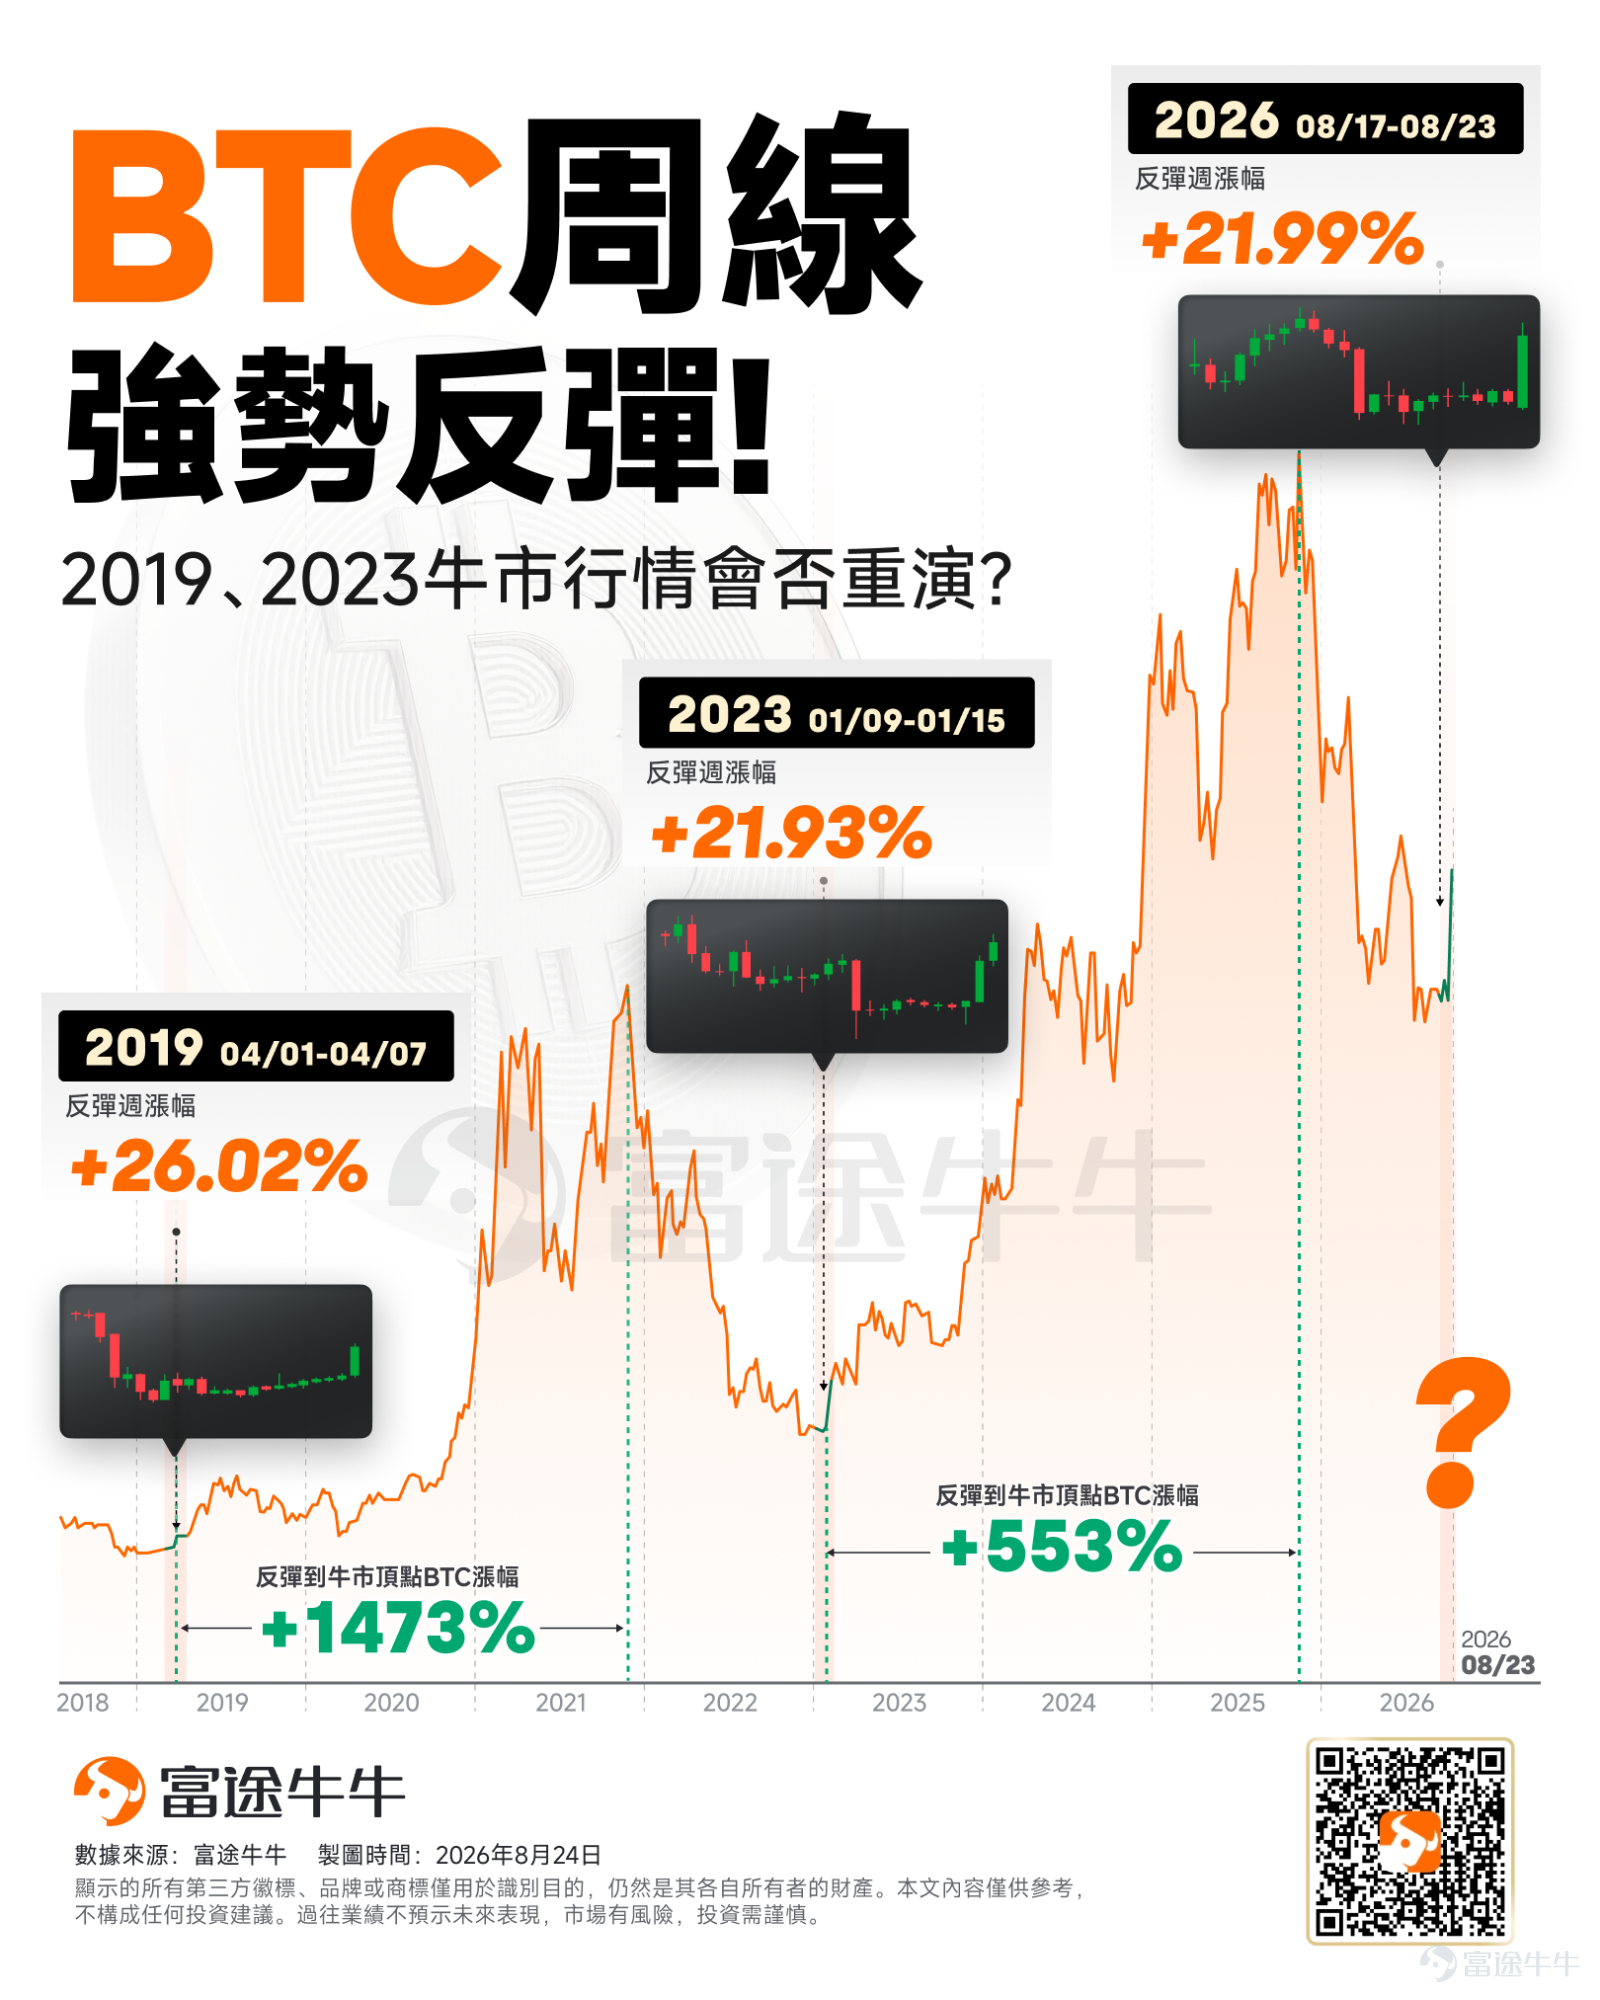
At the bear market bottoms of Bitcoin's previous two cycles, a highly similar technical signal emerged:A strong weekly reversal candlestick formed quietly, defying widespread market expectations, and served as an early warning signal for a trend shift.
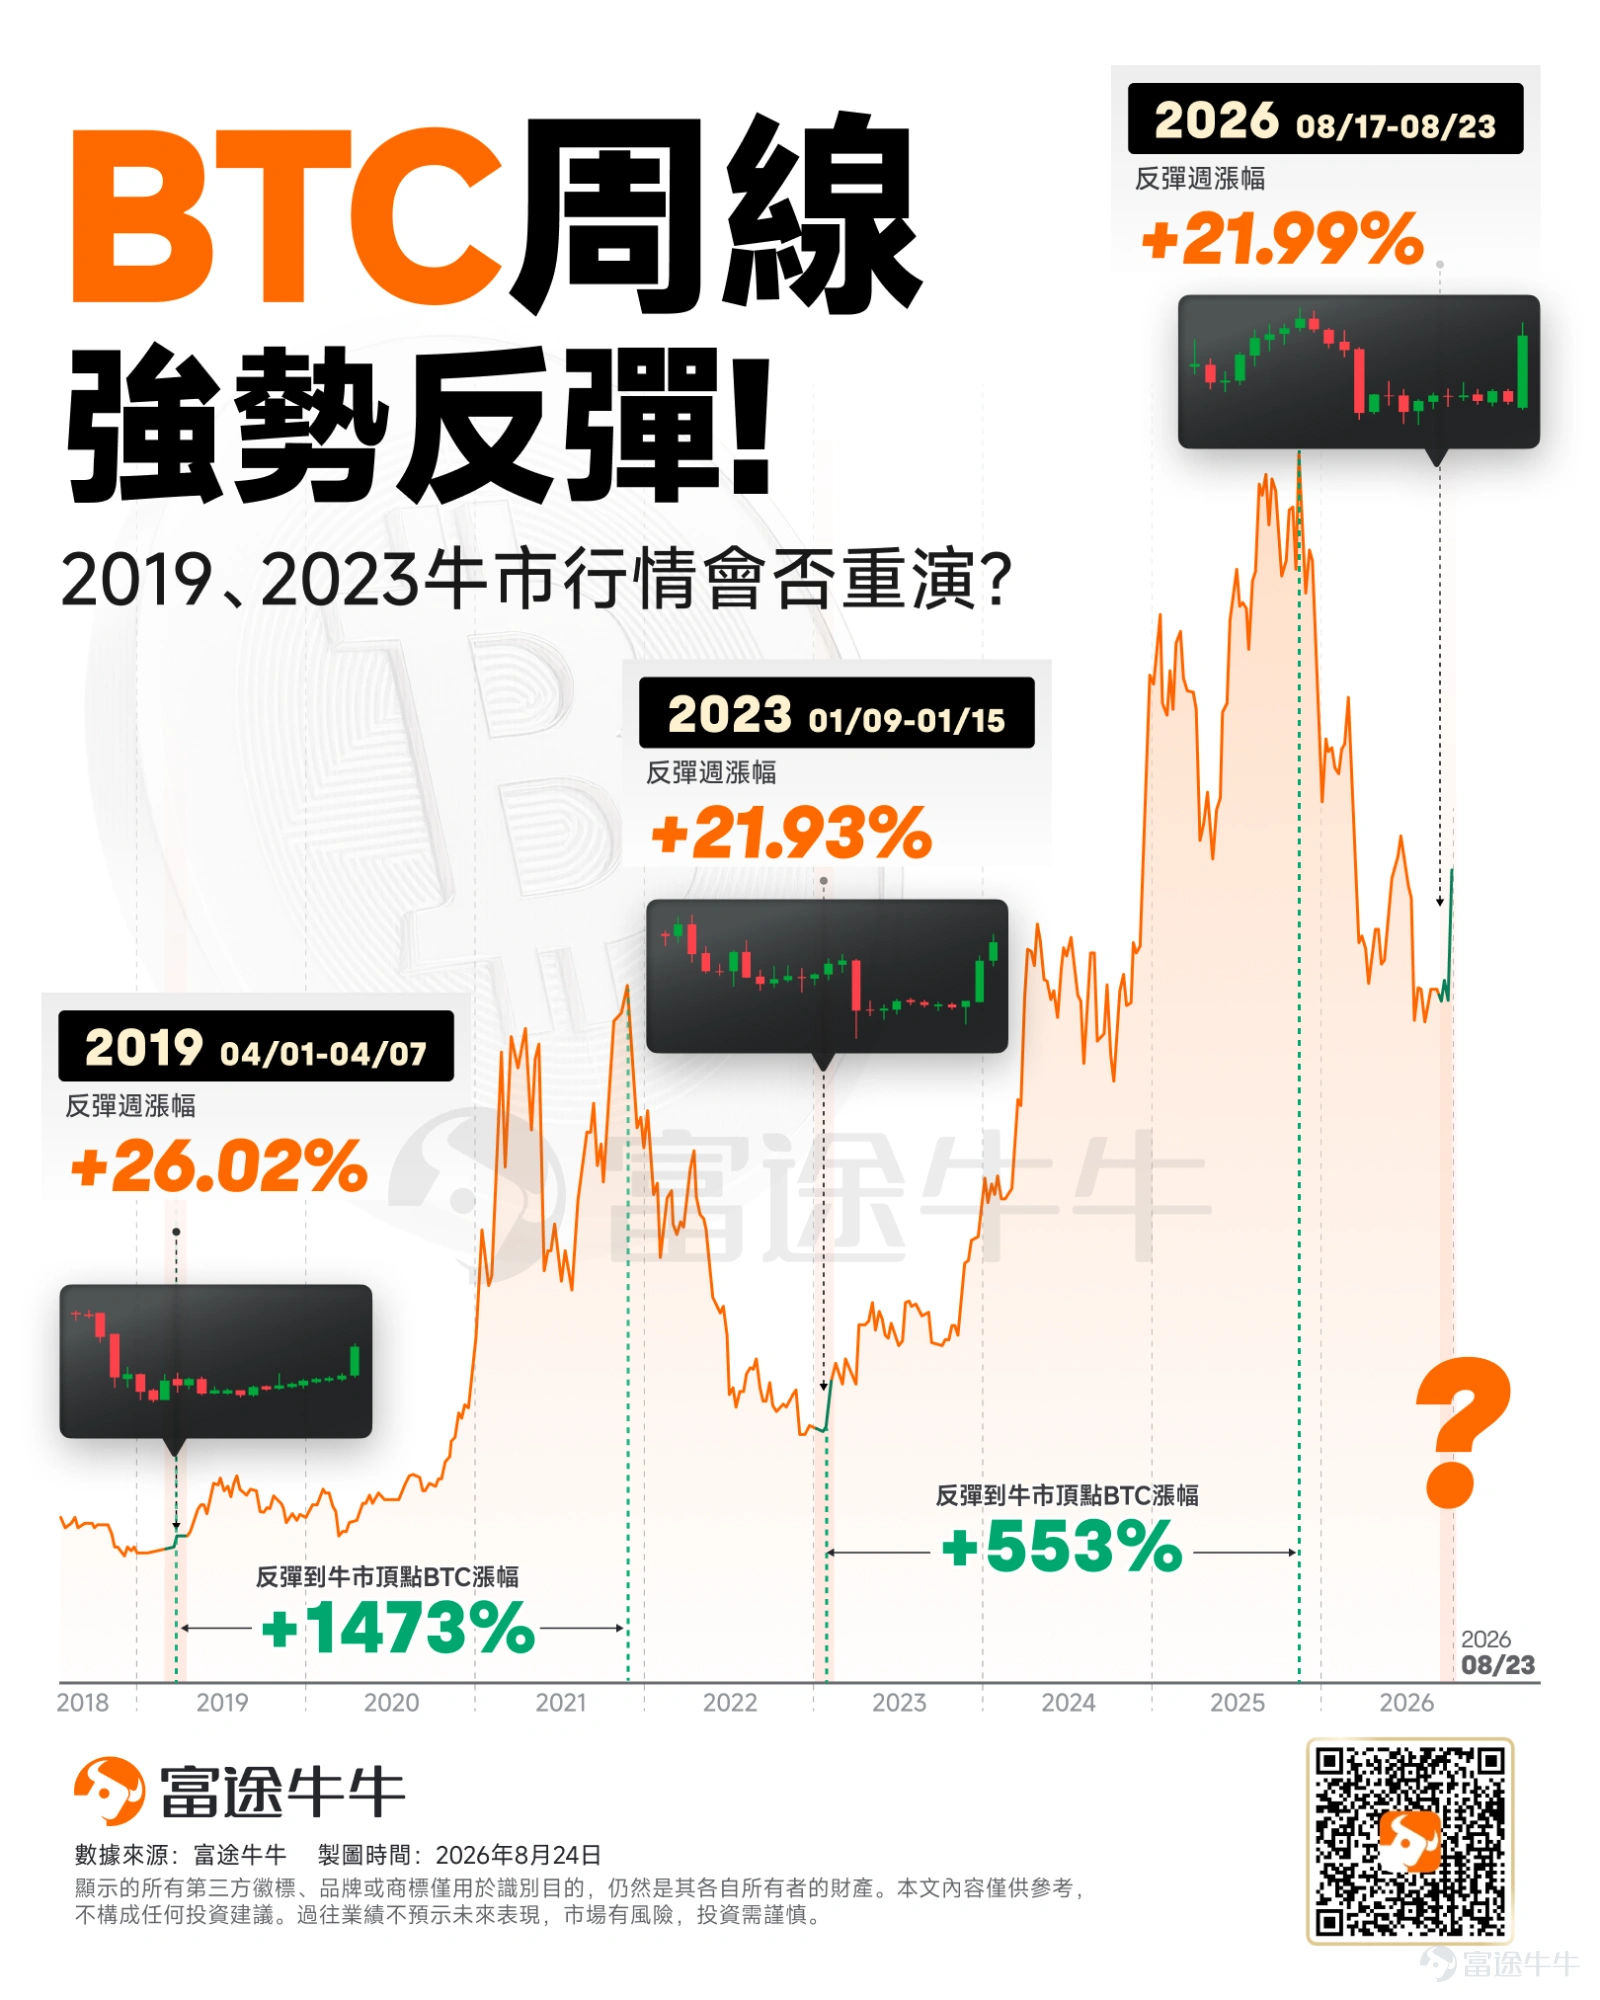
According to Futubull data, in early April 2019, Bitcoin's weekly gain reached approximately 26.02%.This trend was subsequently confirmed by the market as a key signal marking the end of the bear market and the start of a new upward cycle. Since the appearance of this weekly reversal signal, Bitcoin accumulated a gain of 1,473% leading up to the bull market peak in early November 2021.
A similar scenario played out again in January 2023.At that time, while the aftermath of the FTX collapse had not yet settled and market sentiment was extremely pessimistic, Bitcoin bucked the trend to rise by about 21.93% that week, instantly invalidating many bearish expectations. Since then, Bitcoin has officially entered a bull market; from the appearance of this weekly reversal signal to the historical high in early October 2025, the cumulative gain reached 553%.
These two historical cases indicate that extreme market pessimism combined with an unexpected strong rebound often constitutes an important prelude to a cyclical shift.
The current market may be replicating a similar structure, with Bitcoin posting a weekly gain of 21.99%.If historical patterns hold true again, this weekly reversal could serve as an early signal for a new upward cycle.
It should be noted that historical comparisons provide only structural reference and do not constitute trend confirmation or investment advice.
Drivers of the Rally: Short Squeeze, Incremental Capital Inflows, and Policy Tailwinds
Analysts generally believe that the initial phase of this rally was primarily driven by a short squeeze triggered by U.S. Treasury buybacks.
Last week, the U.S. Treasury expanded the scale of long-term Treasury buybacks, raising the single-operation cap from approximately $2 billion to at least the $4 billion level.Pressure on long-end U.S. Treasury yields eased temporarily, leading to an improvement in risk appetite. As a high-beta risk asset, Bitcoin typically prices in marginal easing of financial conditions quickly.
During the price rally, short sellers continued to add to their positions or increase exposure. As the upward momentum accelerated, shorts were forced to cover, further steepening the upward slope. Public liquidation data shows that short liquidations in the crypto market reached nearly $4 billion during this rally, significantly boosting short-term volatility.
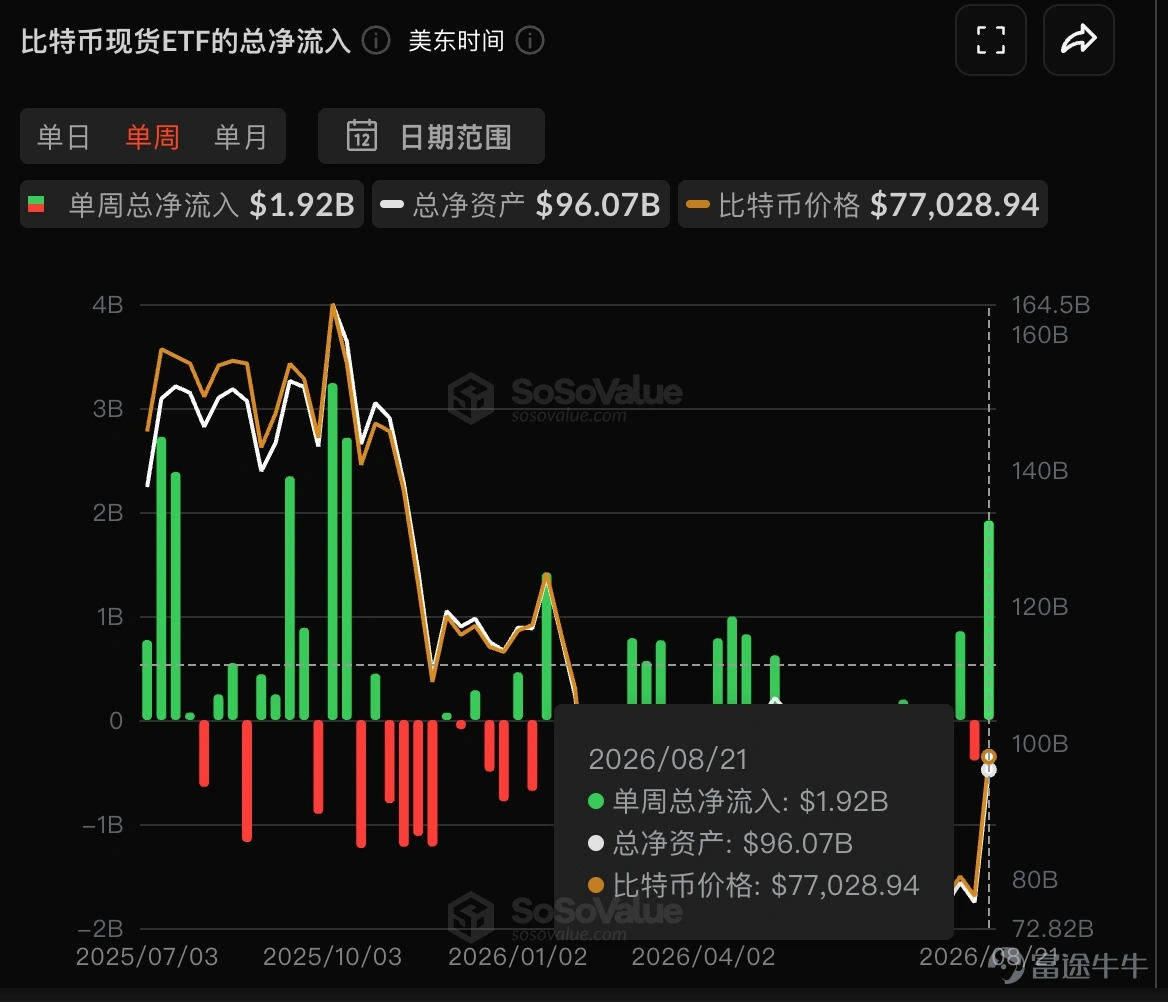
Beyond the short squeeze, the simultaneous entry of incremental capital served as a key variable sustaining the trend.According to Sosovalue data, U.S. spot Bitcoin ETFs recently recorded net inflows exceeding $1.92 billion, indicating a clear rebound in institutional allocation interest. Net ETF inflows reflect the efficiency of converting fiat demand into spot buying pressure, and their sustainability will directly impact the steepness of the trend.
On-chain, large holding addresses (whales) simultaneously increased their holdings. Reports citing CryptoQuant data show that over the past 60 days, large holders have net accumulated approximately 43,000 Bitcoin. This signal indicates that the current rally involves both spot and medium-to-long-term capital, rather than being driven solely by derivative-induced cascades.
Catalysts from crypto policy developments were also released simultaneously.President Trump met with crypto industry leaders from Coinbase, a16z, Ripple, and others at the White House, reiterating his push for the swift passage of the CLARITY Act in the Senate.
As legislative progress continues, the two major regulatory agencies are also synchronously laying out their regulatory frameworks:
- SEC proposes new draft rules for "Regulation Crypto Assets":The plan aims to exempt certain crypto financings from full securities registration if specific conditions are met, including fundraising caps of $5 million cumulatively over four years or $75 million annually, and provides a conditional safe harbor for certain token projects. Additionally, the SEC is considering limiting certain state securities registration requirements to provide clearer compliance pathways for US crypto firms.
- CFTC releases "Plan B" roadmap:The CFTC Chairman explicitly stated that the preferred approach remains congressional legislation, butif legislative progress continues to stall, the CFTC will leverage its existing administrative authority to establish its own regulatory framework for the crypto asset market.This provides a dual safeguard for regulatory certainty.
Market participants believe that recent actions by US regulators indicate Washington is shifting from its previous enforcement-driven regulatory model to establishing a systematic regulatory framework for crypto assets.
Future Validation: Capital Flows, Price Action, and Legislative Milestones
The future direction of Bitcoin prices will depend on three key validations.
First, whether net inflows into spot Bitcoin ETFs can remain consistently positive.Inflows over a single week or a few days can explain pulse-like market moves; however, a trend-level uptrend typically requires capital flows to shift from阶段性 (phased) rotation to sustained allocation.
Second, whether the price can effectively break through key resistance levels and hold firm above key support levels.Many well-known crypto traders and analysts generally believe that $80,000 to $83,000 is the core resistance range currently facing Bitcoin. On the support side, Jeff Ko, Chief Analyst at CoinEx, pointed out that the key lies in whether BTC can hold the 200-day moving average around $69,000 and effectively transform it from resistance into support.
Meanwhile, market participants also warn that if U.S. Treasury yields continue to rise, Bitcoin's current breakout rally may face renewed tests. If prices repeatedly spike and fall back, pressure from trapped positions above and profit-taking will gradually accumulate; conversely, if the price remains stable above key ranges after a pullback, the overall trend structure will be more solid, laying a firmer foundation for subsequent upward moves.
Third, the voting results on the CLARITY Act by the U.S. Senate on September 15.If the vote proceeds smoothly, regulatory clarity is expected to strengthen; if it encounters obstacles, short-term volatility may increase, and market attention will shift more towards the administrative paths of the SEC and CFTC.
Conclusion
Combining technical structures, capital flows, and policy developments, the market has shown early signals of a new upward cycle, but this is not yet sufficient to confirm the full onset of a bull market.Going forward, investors should closely monitor the sustainability of net ETF inflows, breakthroughs of key resistance levels, stability at key support levels, and the voting results of the CLARITY Act on September 15.
 Fellow investors, what do you think is the next move for BTC?
Futubull's Fear & Greed Index is now live!Accurately capture market sentiment turning points, giving you a "compass" for buying the dip and selling the top.Click to unlock your exclusive investment insights~
(Note: Please update Futubull to the latest version)

Risk Disclaimer: The above content only represents the author's view. It does not represent any position or investment advice of Futu. Futu makes no representation or warranty.Read more


Comment (1)
to post a comment
35
27