
Oil prices breaking above $100 fuel expectations of rate hikes! Will the Fed act next week?

Bullish Tech Insights | Dual Shock from Nonfarm Payrolls and CPI Triggers Risk-Off Sentiment: Analyzing the Evolving Technical Structure of US Equity Markets
On June 3, Eastern Time, the Nasdaq index hit another intraday record high. However, the rally was short-lived—on June 5, the latest US non-farm payroll (NFP) data significantly exceeded expectations, sparking market concerns that the Federal Reserve might delay rate cuts or even consider hiking rates. $NASDAQ 100 Index (.NDX.US)$ It dropped 4.8% that day, $S&P 500 Index (.SPX.US)$ and fell 2.64%.
From June 8 to 9, multiple key economic releases—including CPI, PPI, and the 10-year Treasury auction—were scheduled for the week,and uncertainty surrounding macroeconomic data triggered a surge in risk-averse sentiment among investors.—On June 9, the S&P 500 and Nasdaq briefly dipped intraday to around 7,237.85 and 28,000 points, respectively, before both staged strong rebounds in the final trading session, recouping part of their losses.
Amid the dual impact of macroeconomic data and Middle East geopolitical tensions, market dynamics are undergoing a structural shift. The following sections will dissect the recent evolution of market structure from a technical perspective and clarify current key support and resistance levels.
S&P 500 ETF (SPY)
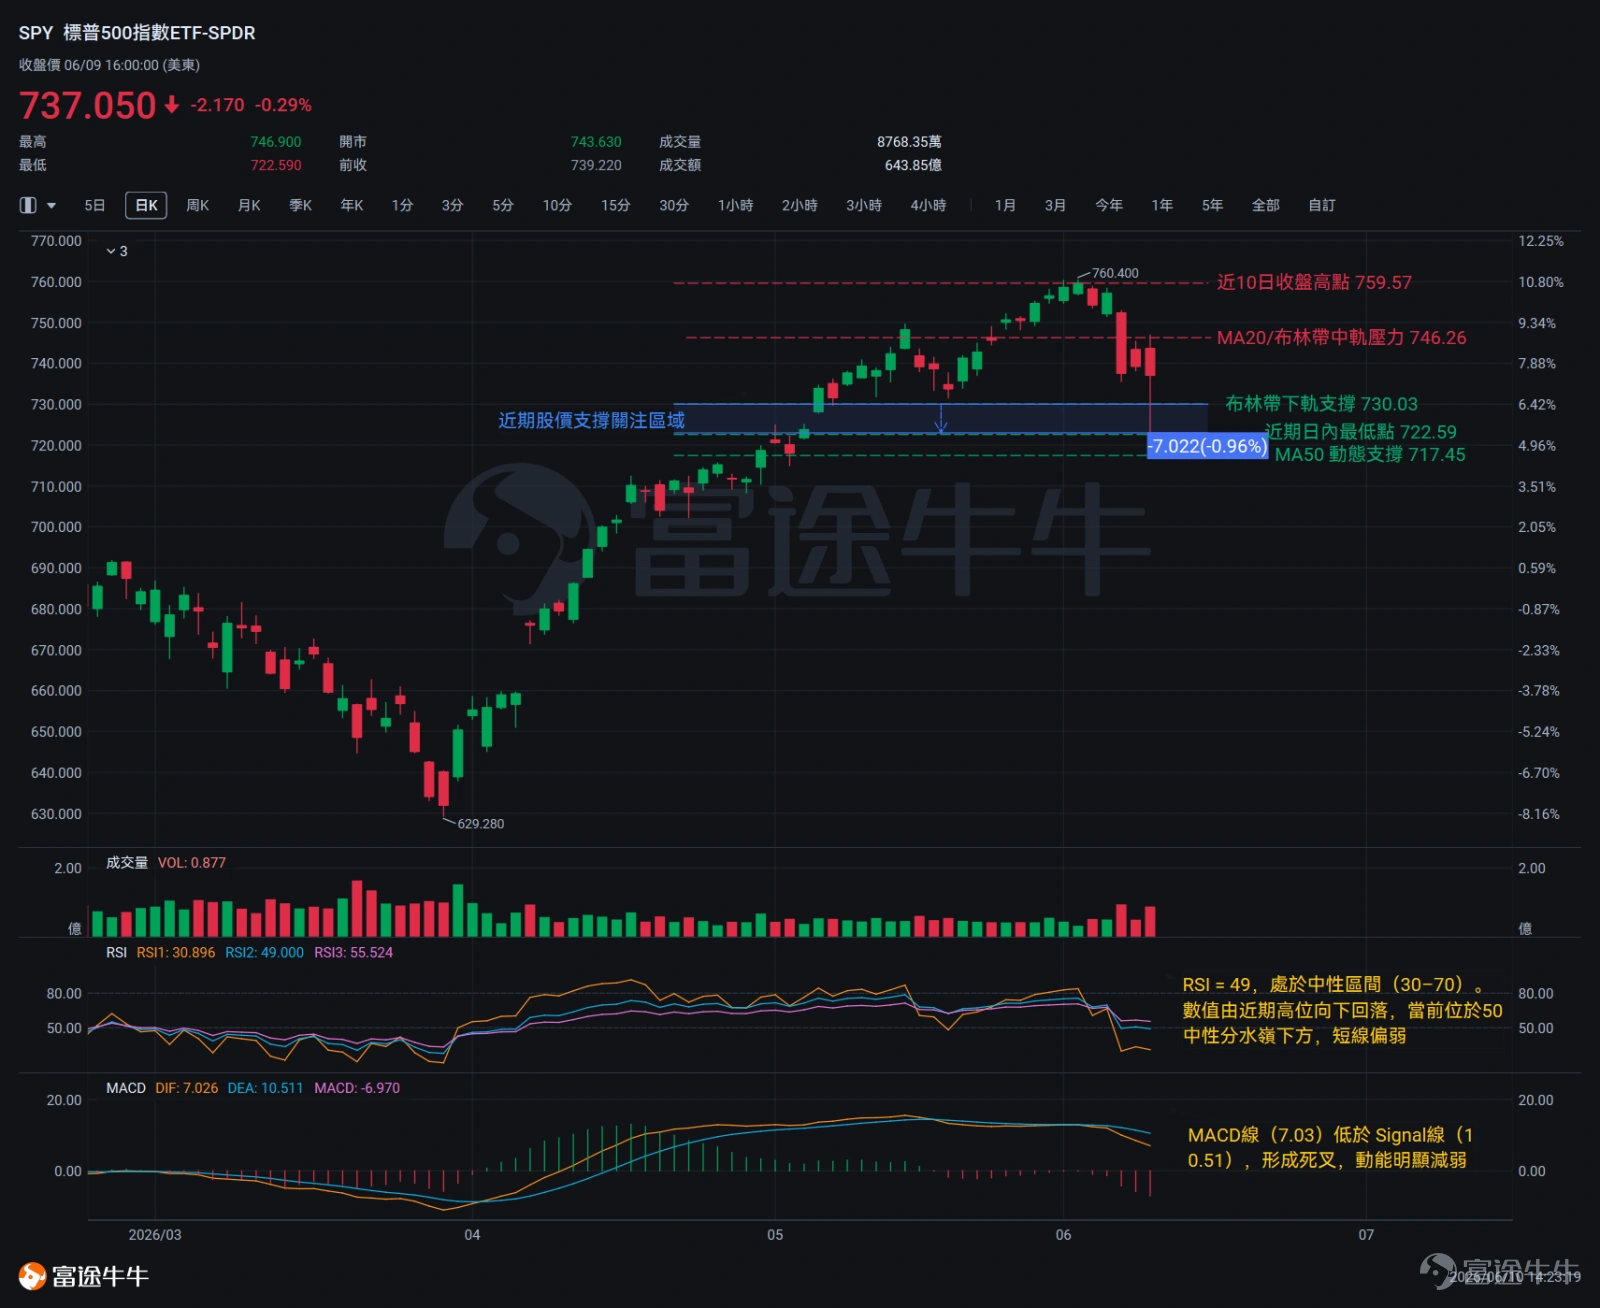
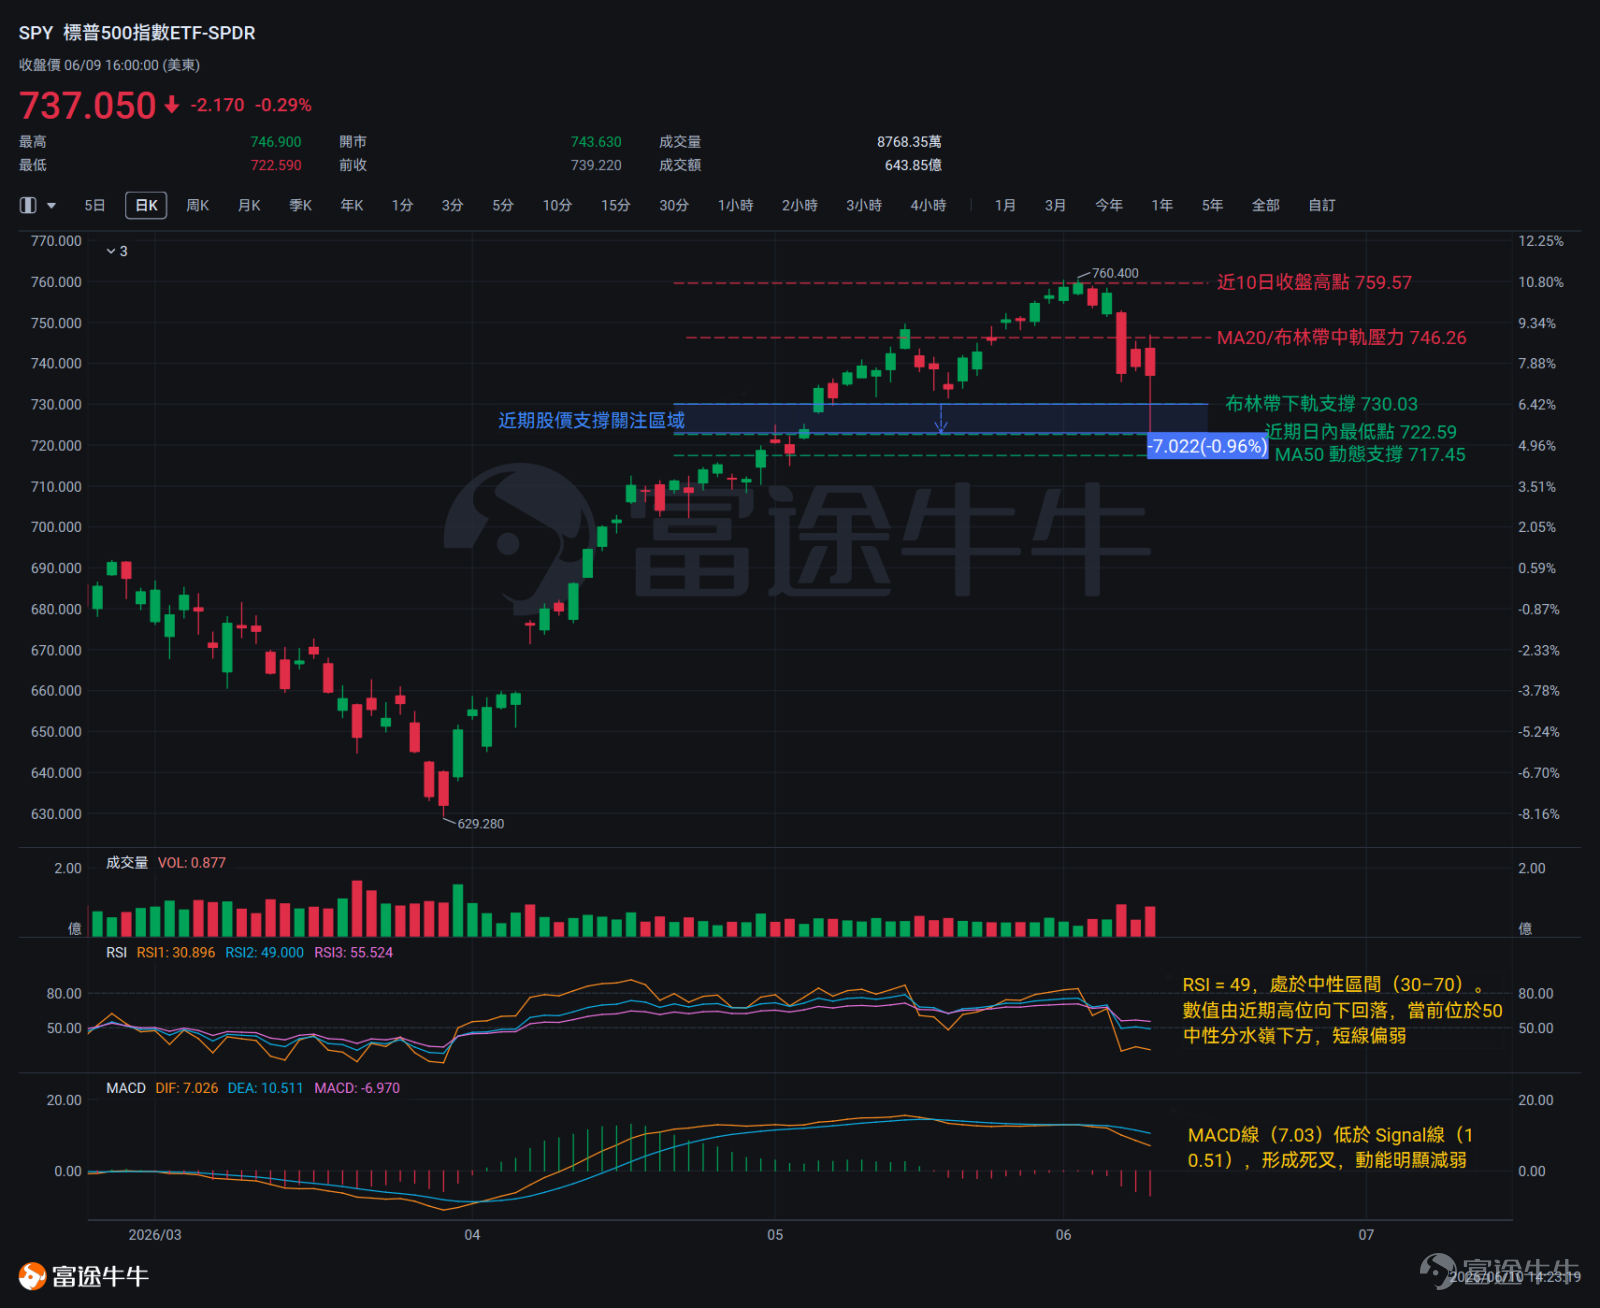
$SPDR S&P 500 ETF (SPY.US)$ It closed lower on June 3, and gapped down below key support on June 5. Although the bullish candle on June 4 interrupted the standard bearish pattern's continuity,the overall sequence of consecutive declines combined with the breakdown still signals a continuation of bearish momentum.
Since June 5, SPY has posted three consecutive down days, closing at 737.05 on June 10, representing a cumulative decline of approximately 22 points. As of the close on June 9,price had already broken below the 20-day moving average (746.26),and is currently trading between the middle and lower bands of the Bollinger Bands,with the short-term trend having shifted from bullish to bearish.
On June 5, SPY recorded its largest single-day down candle in nearly 10 days, opening at 752.31 and dropping to an intraday low of 735.53,exhibiting clear signs of a high-volume breakdown;the spinning top candle on June 8 reflected a stalemate between bulls and bears, leaving direction unclear; on June 9, price broke down again intraday, testing support near 722, which held successfully as market participants provided effective buying support, prompting a subsequent rebound that closed at 737.05.
Key Technical Indicators Interpretation
Moving Average (MA):Price has broken below the 20-day moving average (MA20) at 746.26, but still maintains a buffer above the 50-day moving average (MA50) at 717.45. The medium-term trend remains intact, and the MA50 continues to serve as effective support.
RSI:The current reading is 49, within the neutral range (30–70). The indicator has declined from recent highs and now sits below the neutral 50-level, indicating short-term weakness.
MACD:The MACD line (7.03) is below the Signal line (10.51), forming a bearish crossover, with momentum clearly weakening.
Bollinger Bands:The current price (737.05) lies between the Bollinger Band middle band (746.26) and lower band (730.03), reflecting moderate volatility. The Bollinger Bands show no significant narrowing; further downside would test support at the lower band of 730.03, while a rebound failing near the middle band at 746.26 would confirm short-term resistance.
Comprehensive Technical Assessment
On the downside, key support levels include:730.03, the Bollinger Band lower band, serves as the immediate short-term support; 722.59 marks the intraday extreme from June 9—if 730.03 is breached, this level becomes the next support zone; further down, the MA50 at 717.45 acts as the 'last line of defense' for medium-term bulls.
On the upside, key resistance levels include:746.26—where the MA20 coincides with the Bollinger Band middle band—is the most immediate resistance level,as intraday trading on June 9 already confirmed selling pressure at this level. If price convincingly breaks and holds above this zone, confirmation will depend critically on whether trading volume expands in tandem. Higher up, the 754.24–757.09 range represents a recent consolidation area with dense trading activity,and any rebound that fails to break through this zone would still be considered a technical correction rather than a trend reversal.
Nasdaq 100 Index ETF (QQQ)
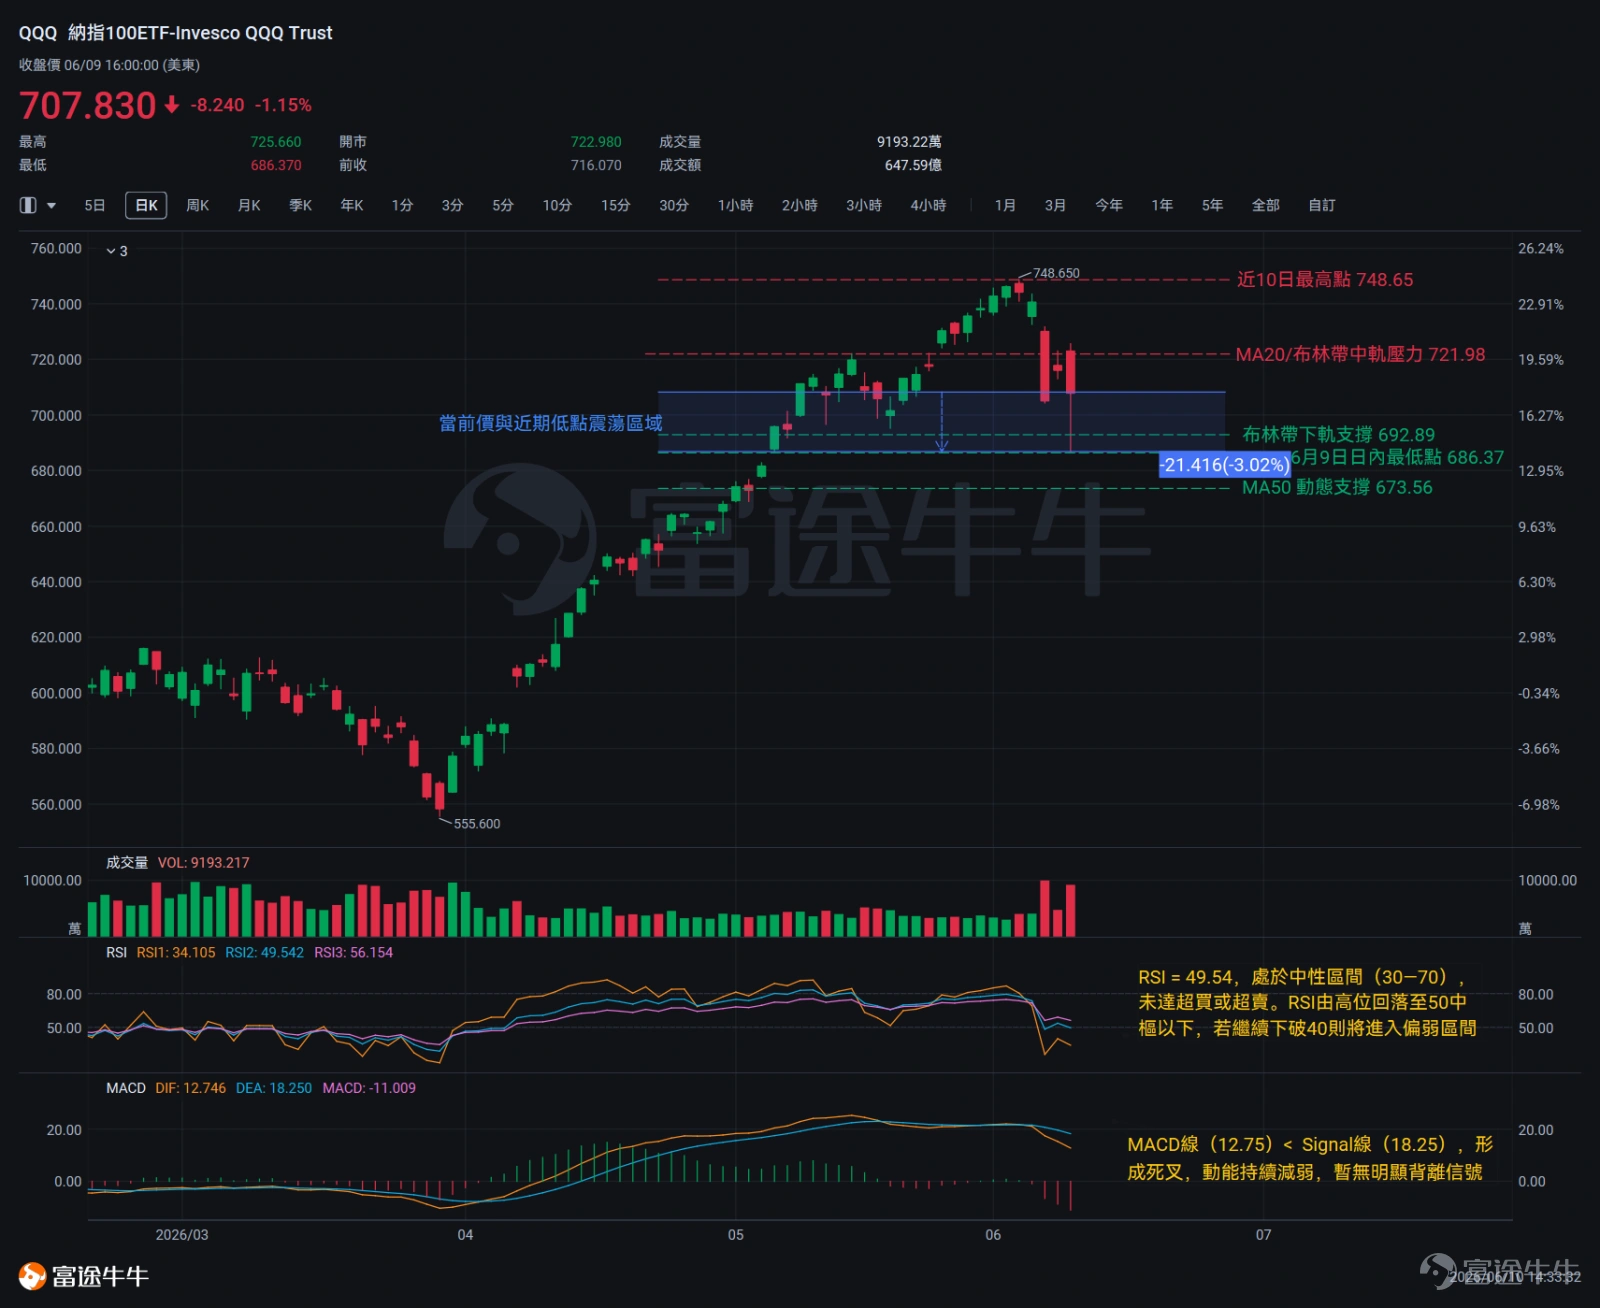
$Invesco QQQ Trust (QQQ.US)$ After hitting consecutive new highs in late May, it began a phase of pullback starting June 3. The current price stands at 707.83, having broken below the 20-day moving average (MA20) at 721.98, and is now trading between the middle Bollinger Band (721.98) and the lower band (692.89). The highs of the past five candles have successively declined,confirming a short-term downtrend, though the 50-day moving average (MA50) at 673.56 remains a key pivot for the medium-term structure, which has not yet been fundamentally compromised.
On the candlestick chart, the intraday high of 748.65 on June 3 failed to hold, followed by a gap-down open the next day—a bearish warning sign of a short-term top. Then, on June 5, a large bearish candle completely engulfed the prior day’s bullish body, forming a bearish engulfing pattern (indicative of panic selling). From June 5 to June 9, three consecutive down days occurred,clearly signaling an overall bearish bias.
Key Technical Indicators Interpretation
Moving Average (MA):The MA20 (721.98) sits above the MA50 (673.56), with price trading below the MA20 but above the MA50, reflecting a short-term bearish alignment of moving averages. The MA50 continues to provide support for the medium-term structure, although near-term momentum remains weak.
RSI:The current RSI reading is 49.54, within the neutral zone (30–70), neither overbought nor oversold. RSI has retreated from elevated levels below the 50 midpoint; a further break below 40 would signal entry into a weaker zone.
MACD:The MACD line (12.75) is below the Signal line (18.25), forming a bearish crossover, with momentum continuing to weaken and no clear divergence signal observed so far.
Bollinger Bands:Price currently trades between the middle Bollinger Band (721.98) and the lower band (692.89), with the bands visibly widening—indicating rising volatility and confirming that price is in a downward expansion phase.
Comprehensive Technical Assessment
On the support side,692.89 is the lower Bollinger Band, serving as the bottom boundary of the recent price downtrend range,once it is decisively broken below,the second support level will shift forward to the 50-day moving average (MA50) at 673.56. 686.37 marks the lowest intraday level in the past 10 sessions, reached on June 9; if prices break below this level again, downward momentum could accelerate.
On the resistance side,716.07 (June 8 closing price) is the immediate hurdle that must be overcome for short-term bullish momentum to resume. More critically, 721.98 represents the confluence zone of the 20-day moving average (MA20) and the middle Bollinger Band—this is the key short-term demarcation line between bearish and bullish sentiment. Whether prices can reclaim this level will directly determine the nature of the near-term trend. Further upside, a sustained and valid breakout above 740.61 (the dense trading zone from the June 4 close) would serve as a significant signal for a potential trend reversal.

Risk Disclaimer: The above content only represents the author's view. It does not represent any position or investment advice of Futu. Futu makes no representation or warranty.Read more


Comments
to post a comment
14
3