
BTC surpasses $75,000! Has the upward channel been fully opened?
Technical Analysis of Cryptocurrencies and Related Stocks (January 28): Bitcoin/Ethereum/HOOD/COIN/MSTR/CRCL/IREN/CIFR/BMNR/MARA/RIOT
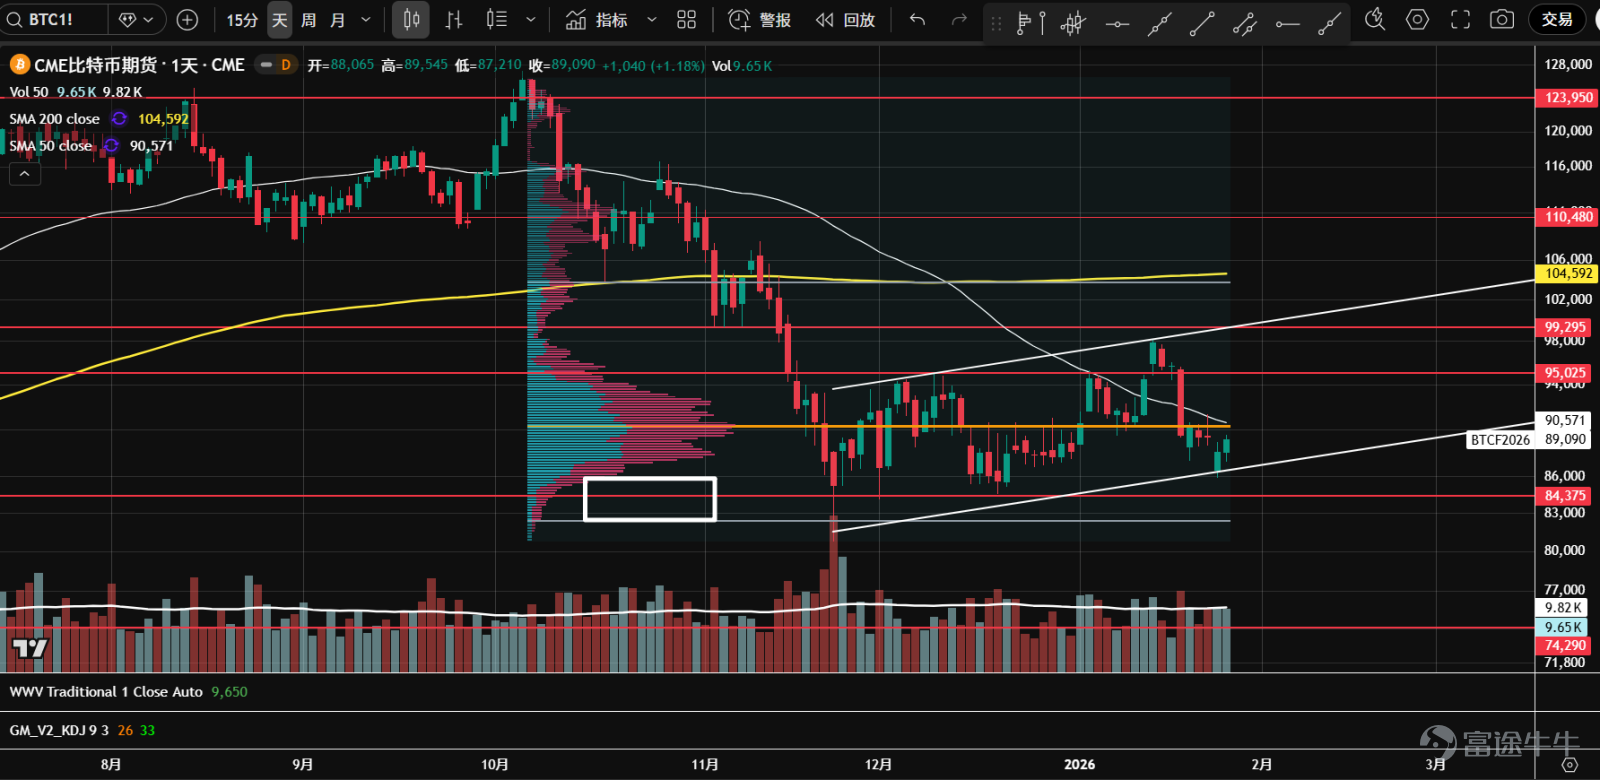
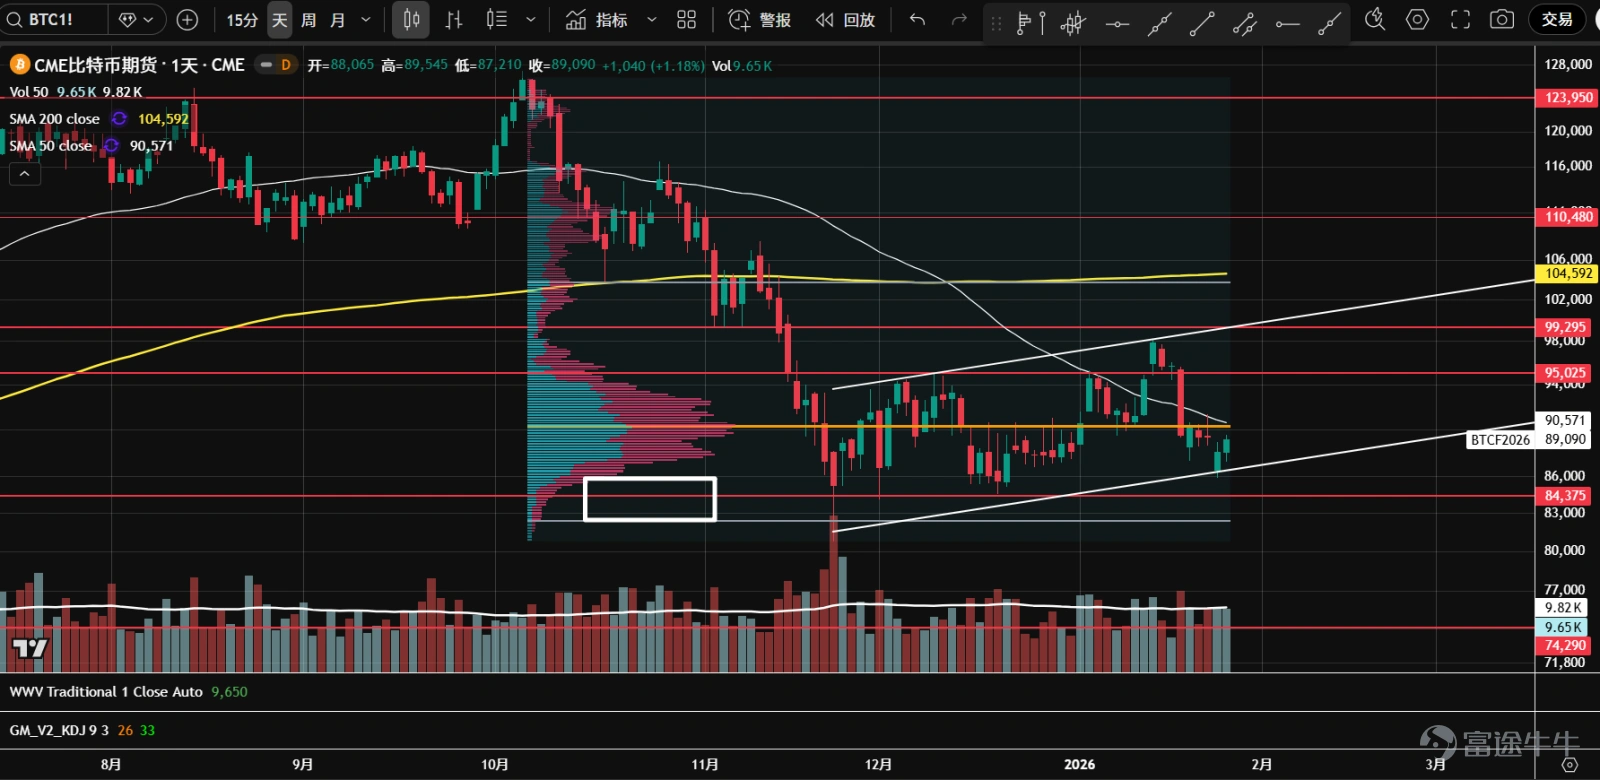
1、 $Bitcoin (BTC.CC)$ Futures once rose to near the 99,300 axis line in the middle of the month but retreated after facing resistance, then dropped significantly to the uptrend line position. Currently, a b-type volume distribution has formed, with clear divergence between bulls and bears, potentially forming a bottom range. Attention should be paid to whether the uptrend line or the area around 84,500 can provide effective support.
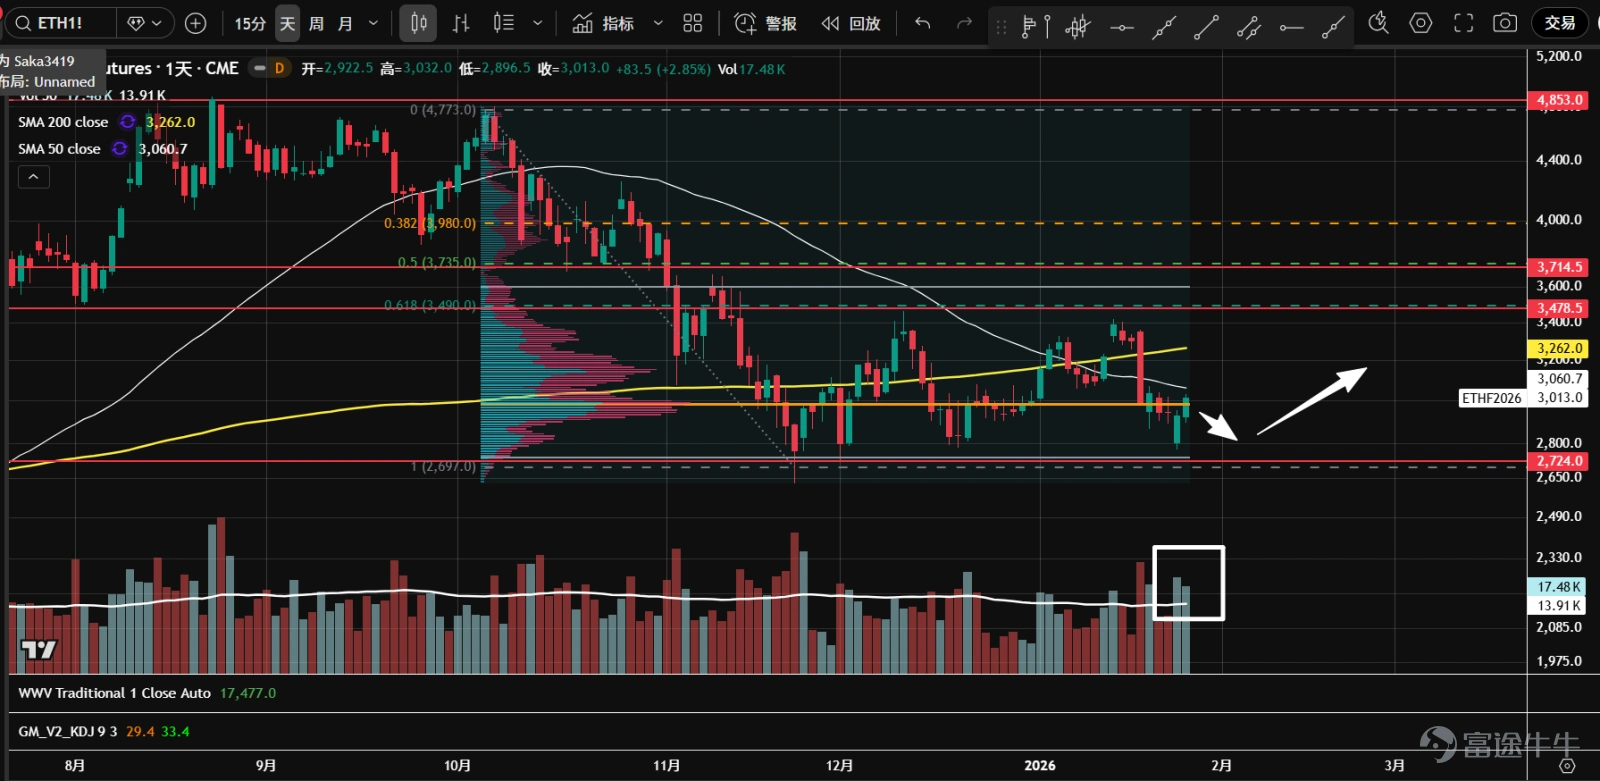
2、 $Ethereum (ETH.CC)$ Futures continue to consolidate sideways, and after testing the lower boundary of the range at 2,725, they rebounded strongly for two consecutive days. A b-type volume distribution has formed, possibly indicating the formation of a bottom. Wait for a pullback on lower volume as a buying opportunity.
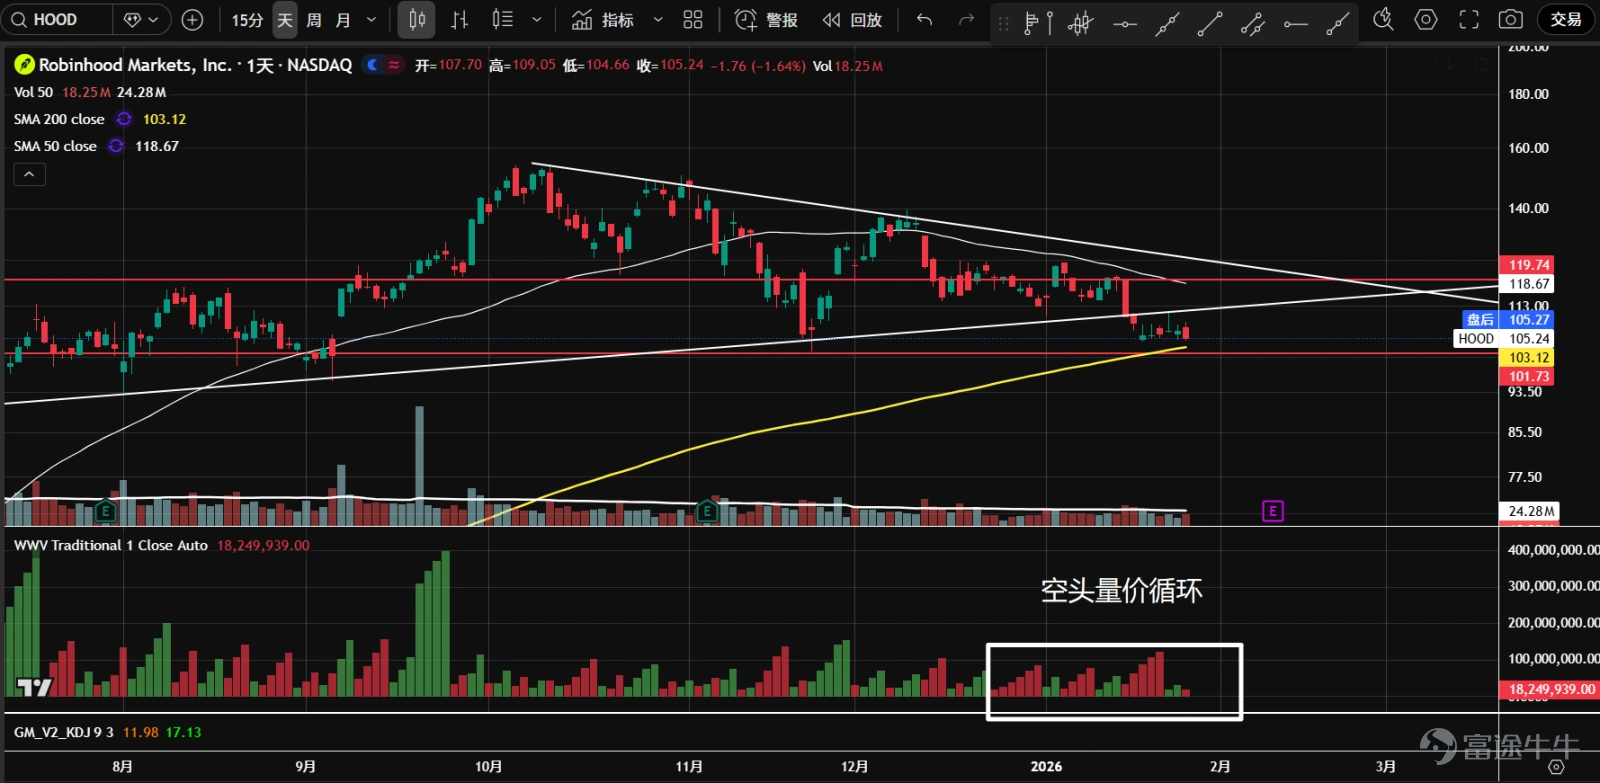
3、 $Robinhood (HOOD.US)$ Prices broke downward as they approached the end of the symmetrical triangle, reaching dual support at the annual moving average and the 106 axis line. In the bearish price-volume cycle, it’s best to stay on the sidelines temporarily.
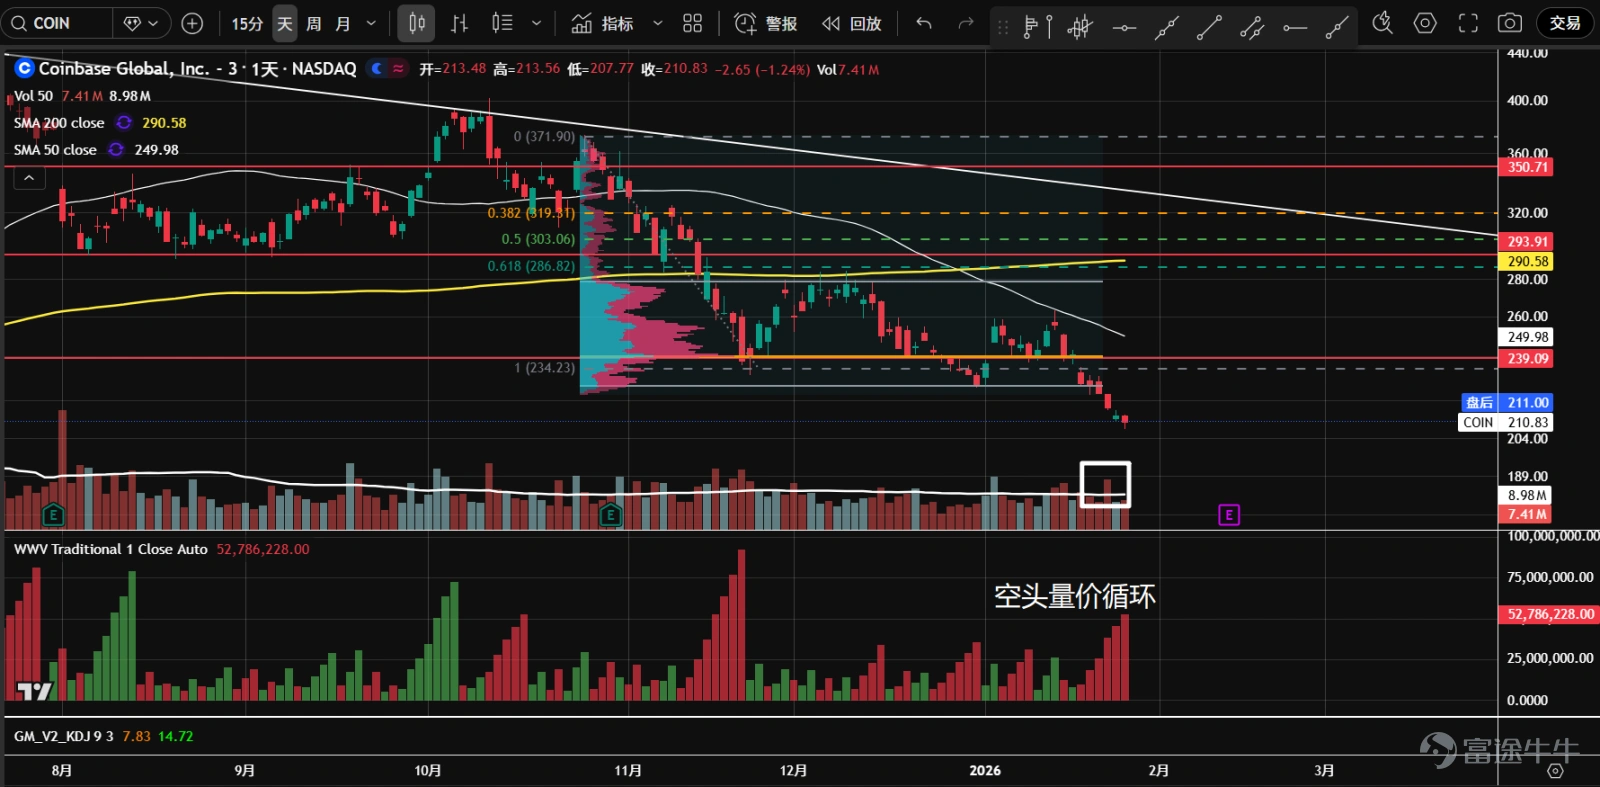
4、 $Coinbase (COIN.US)$ The price broke below the bottom support and the lower boundary of the value range with increased trading volume, forming a b-type volume distribution; the center of gravity is shifting downwards within the bearish price-volume cycle. If it fails to recover in the short term, it may open up downside space.
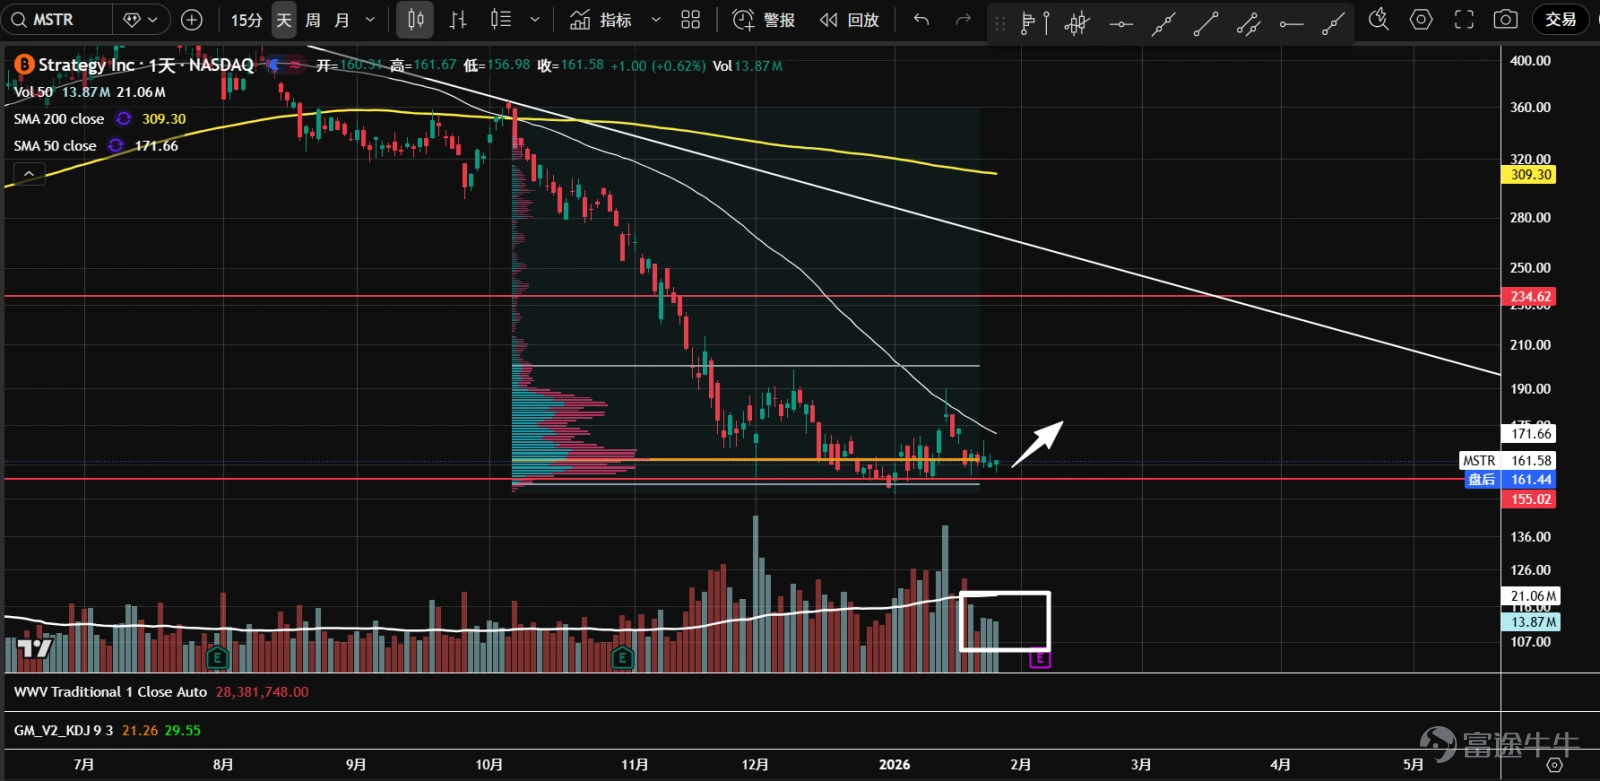
5、 $Strategy (MSTR.US)$ The market has entered a sideways consolidation phase, forming a b-type volume distribution as bulls and bears diverge. The latest rebound attempt saw a surge in volume but ended with a pullback. A small bullish doji formed near the support level, indicating potential buying opportunities.
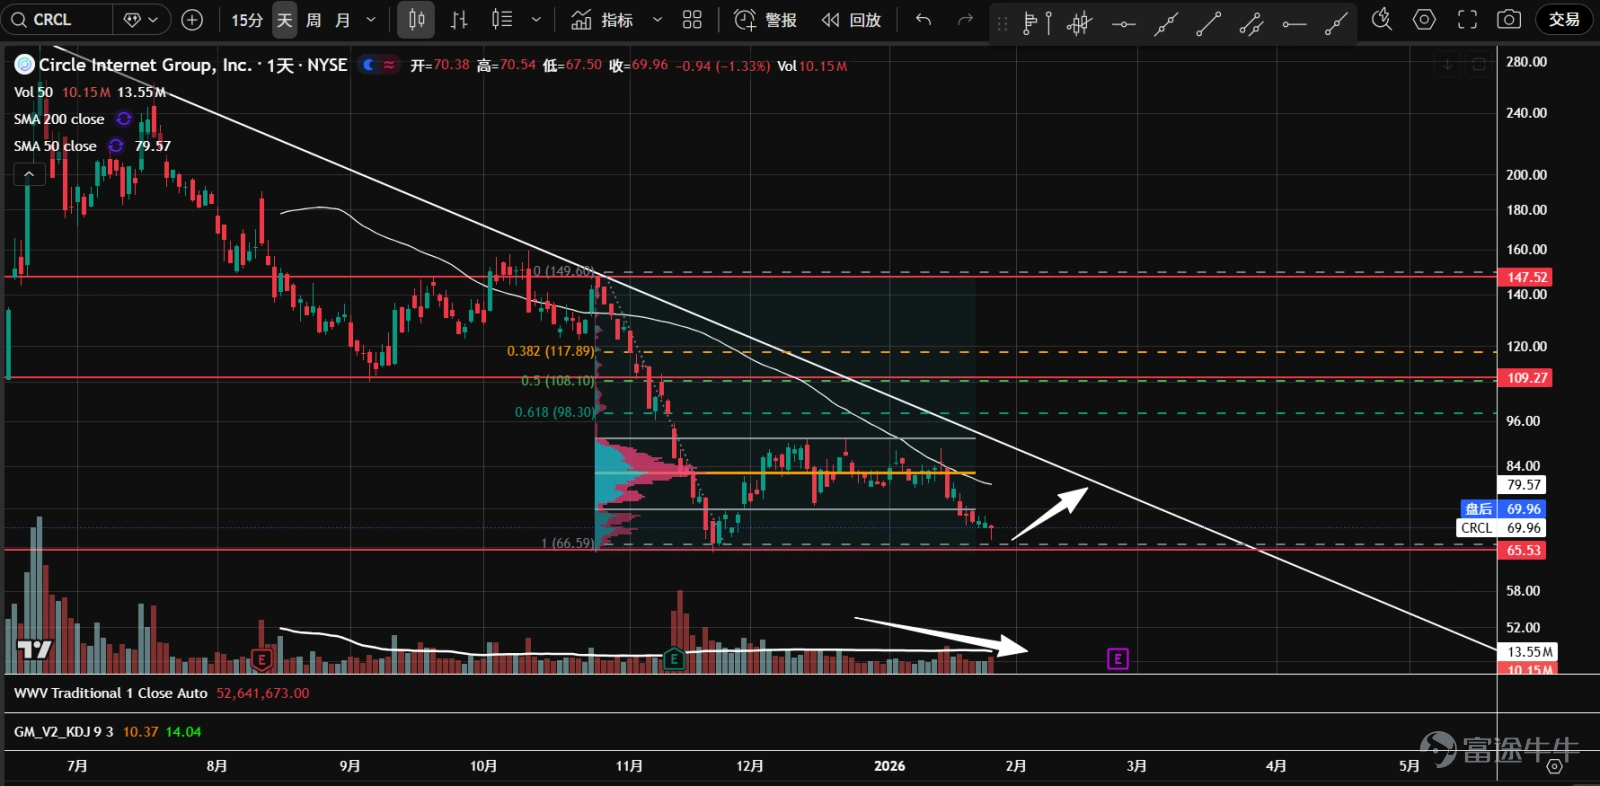
6、 $Circle (CRCL.US)$ The asset is currently trading in a sideways consolidation pattern. After a recent continuous decline, the price tested the previous low at 65.5 for support. Overall trading volume has significantly contracted compared to the November downturn, forming a small hammer-like candlestick. A successful retest is possible, presenting potential buying opportunities.
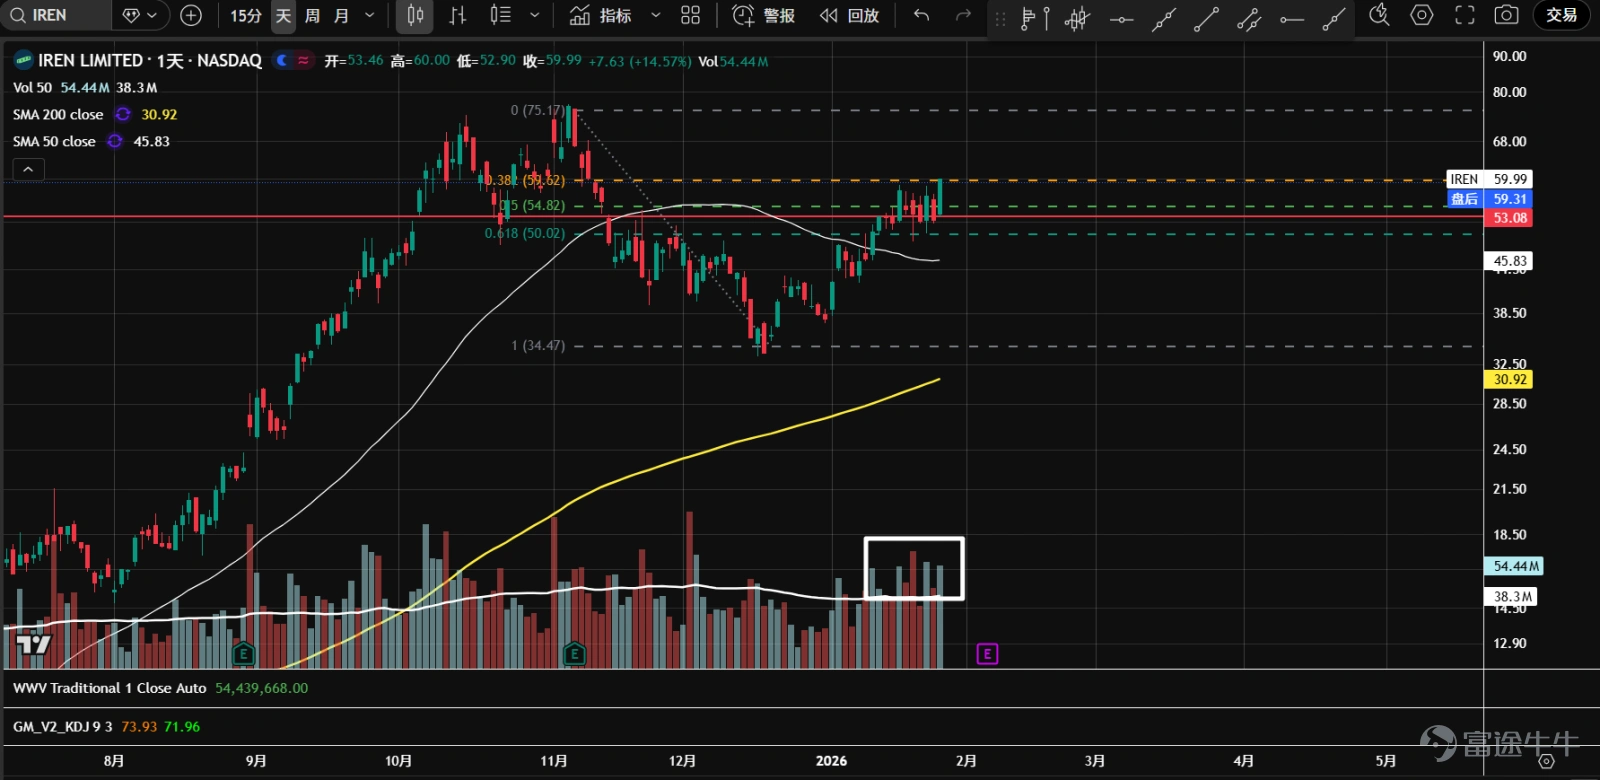
7、 $IREN Ltd (IREN.US)$ Starting from mid-December last year, an upward trend emerged, but the price is currently facing resistance at the 38.2% retracement level of the previous decline. Trading volume continues to expand, showing intense competition between buyers and sellers. For now, it’s best to stay on the sidelines.
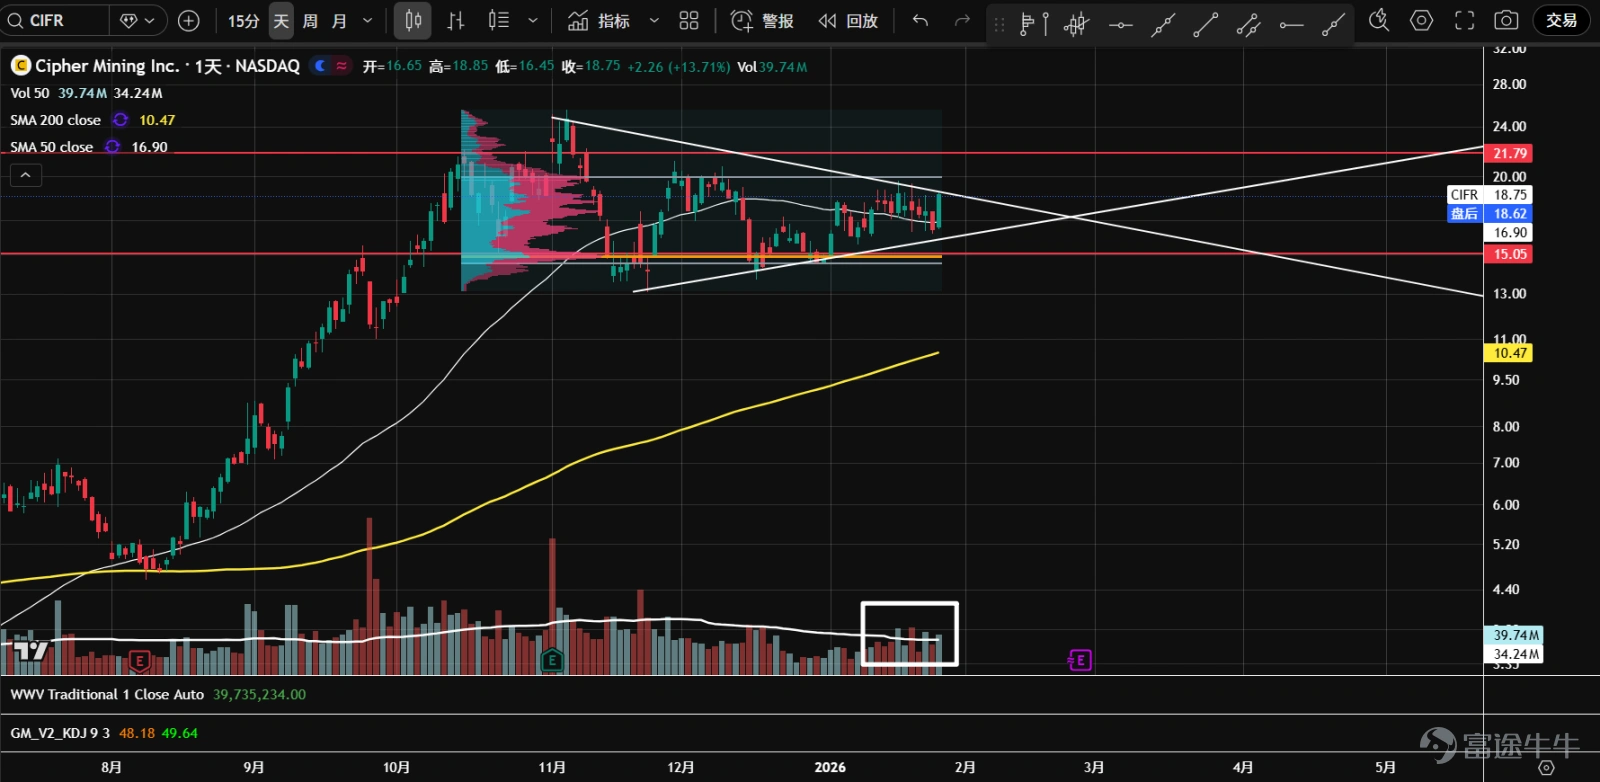
8、 $Cipher Digital (CIFR.US)$ The asset continues to oscillate within a sideways range. Overall trading volume had significantly contracted earlier, signaling potential accumulation at higher levels. However, as the price approaches the apex of the triangle pattern, volume has picked up again, showing clear divergence between bulls and bears. A directional move may occur soon, but for now, it’s advisable to remain cautious.
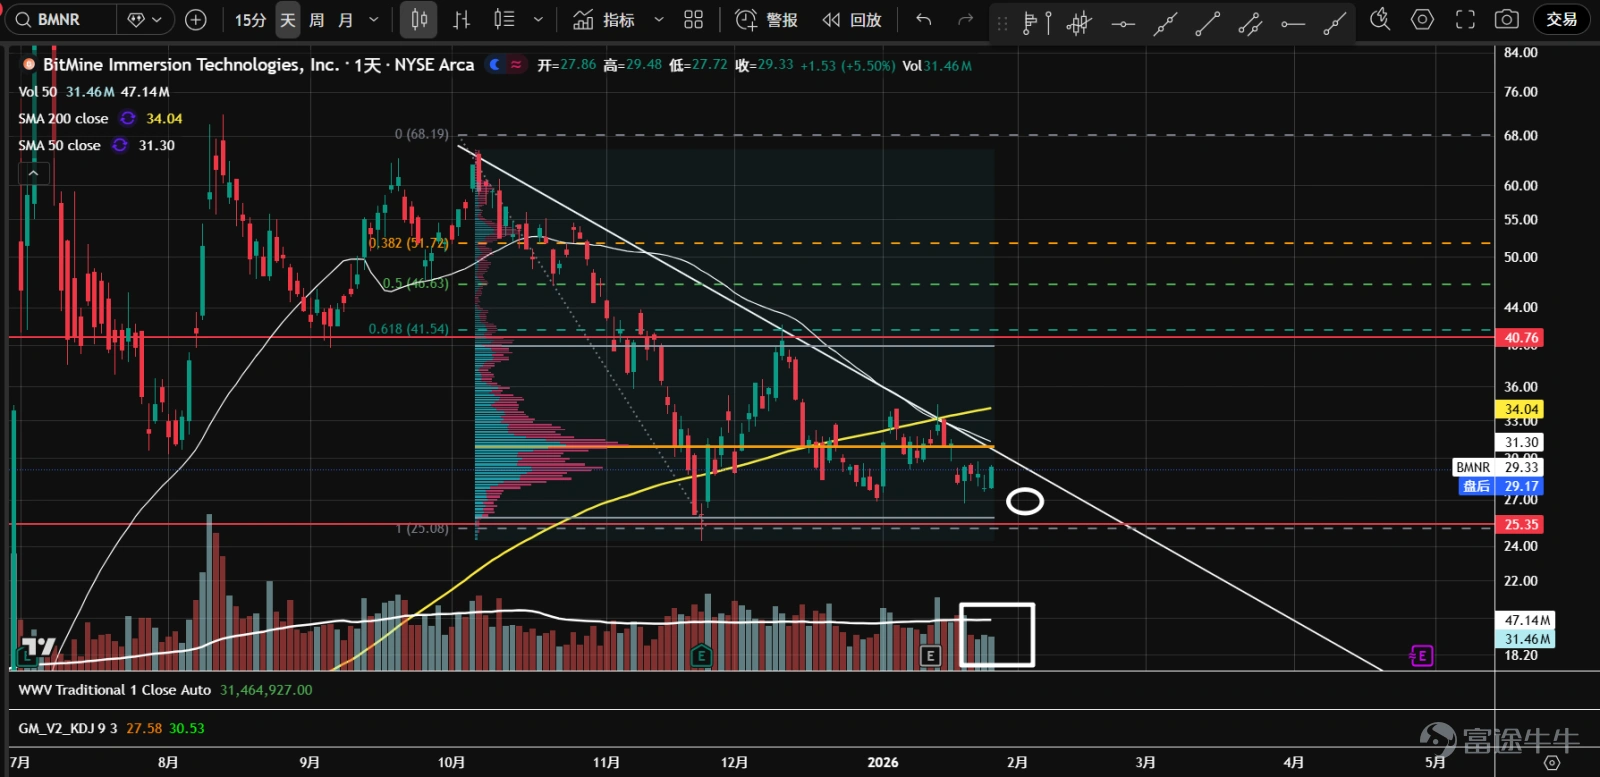
9、 $Bitmine Immersion Technologies (BMNR.US)$ Since November last year, the asset has gone through panic selling, a natural rebound, and a second test with reduced volume, entering a sideways consolidation phase. The center of gravity for positions has shifted downward, and the price is approaching a critical juncture where direction will soon be determined. With overall trading volume declining, the likelihood of an accumulation zone increases.
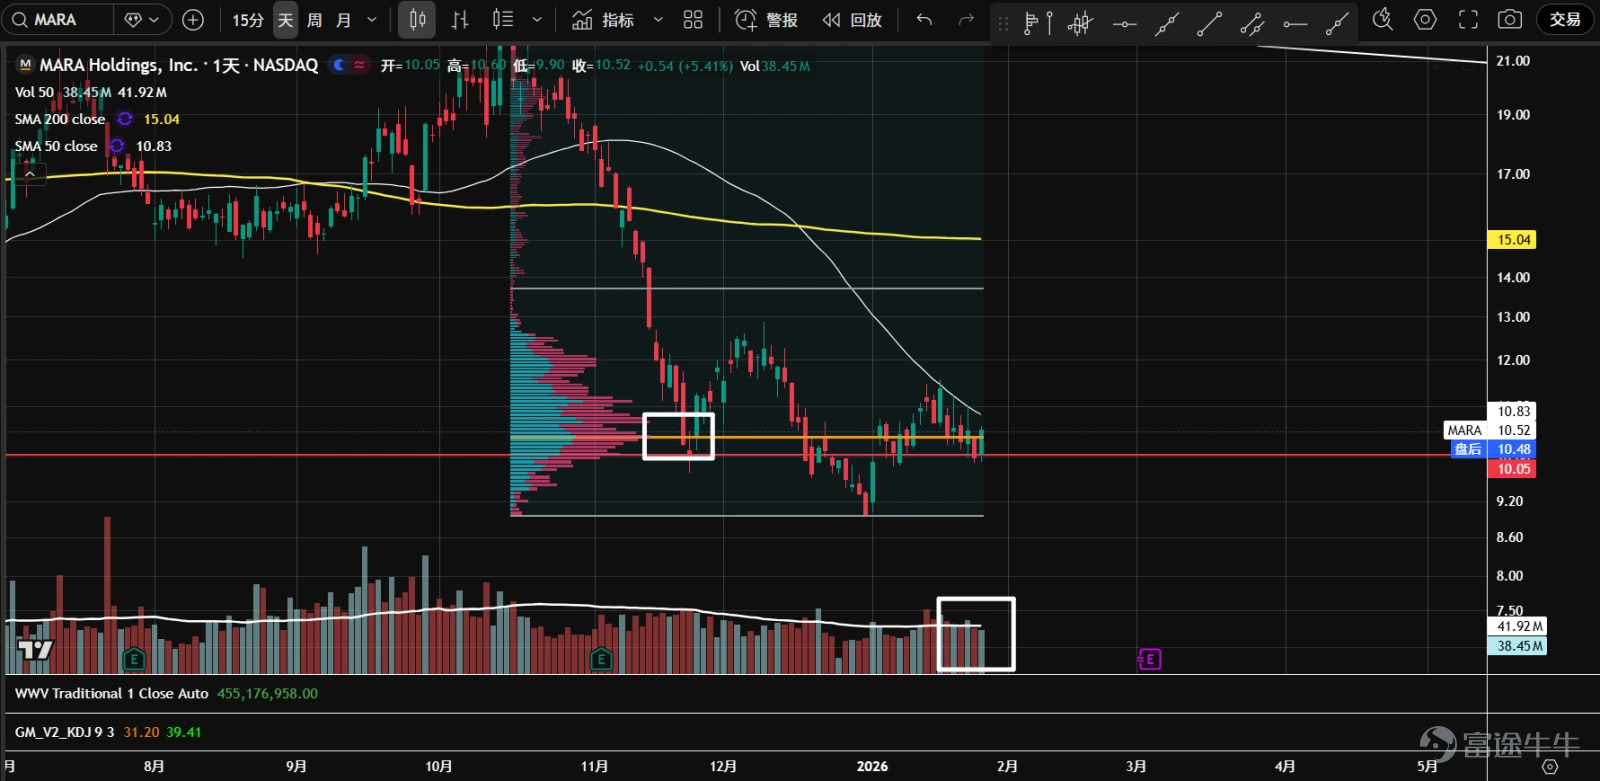
10、 $MARA Holdings (MARA.US)$ At the end of December last year, the asset made a fake downward breakout with reduced volume, followed by a surge in volume during the rebound, finding support around the $10 mark. Volume distribution has taken on a b-type pattern, reflecting significant divergence between bulls and bears. The current price is at the volume control point (orange line), so it's wise to stay on the sidelines for now.
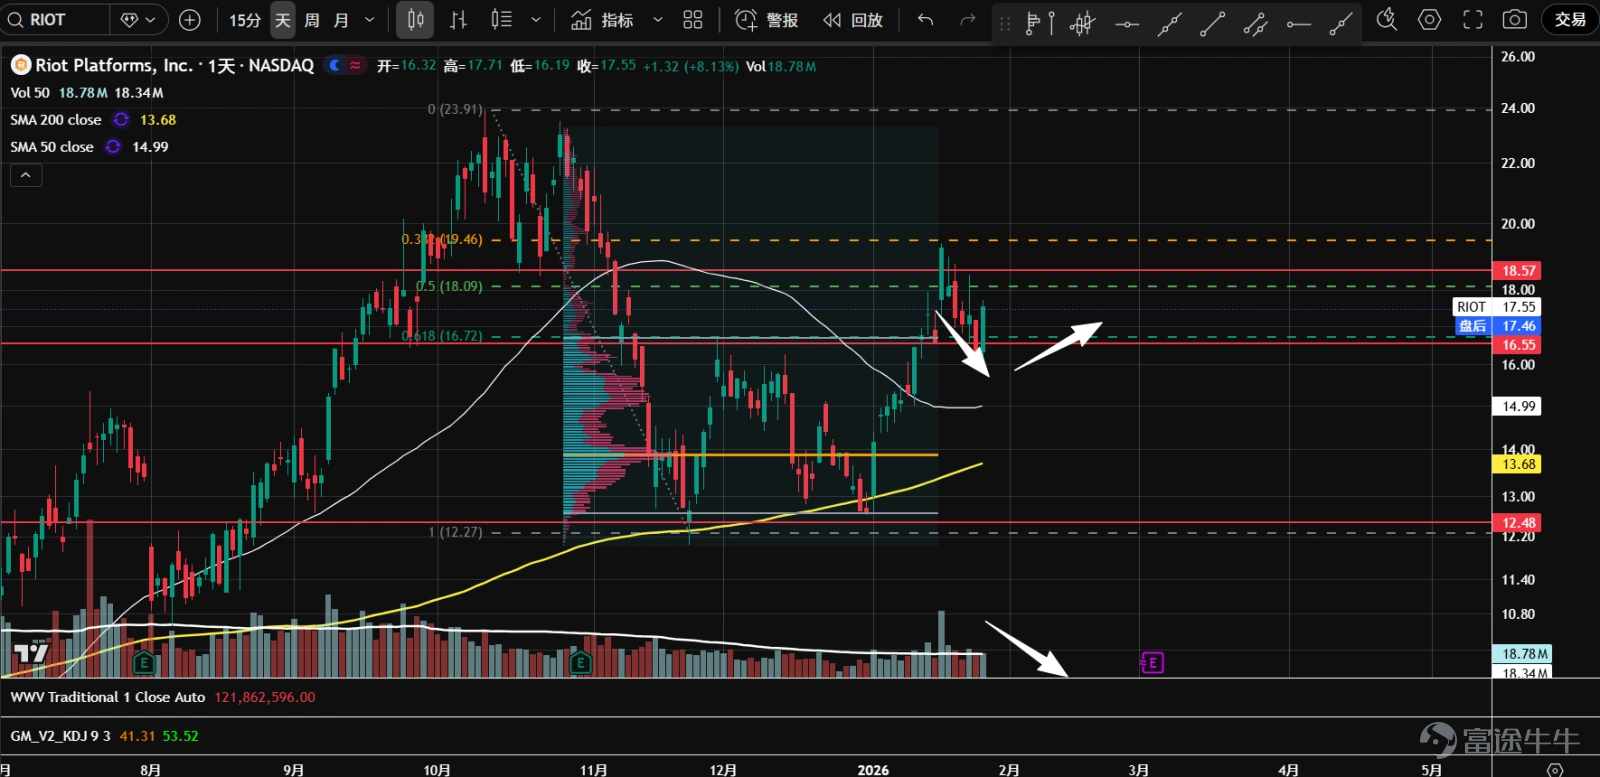
11、 $Riot Platforms (RIOT.US)$ After breaking through the neckline at 16.55 this month and completing a double-bottom pattern, the price surged to resistance near the 18.57 axis and then pulled back to retest the previously broken neckline with reduced volume. During the retest, trading volume contracted noticeably, and a bullish candlestick closed yesterday, indicating potential buying opportunities.
$S&P 500 Index (.SPX.US)$ $SPDR S&P 500 ETF (SPY.US)$ $NASDAQ 100 Index (.NDX.US)$ $Invesco QQQ Trust (QQQ.US)$ $Dow Jones Industrial Average (.DJI.US)$ $State Street® SPDR® Dow Jones Industrial Average® ETF Trust (DIA.US)$ $Russell 2000 Index (.RUT.US)$ $iShares Russell 2000 ETF (IWM.US)$ $Bitcoin (BTC.CC)$ $CME-Bitcoin RR Futures (JUL6) (BTCmain.US)$ $iShares Ethereum Trust ETF (ETHA.US)$
Risk Disclaimer: The above content only represents the author's view. It does not represent any position or investment advice of Futu. Futu makes no representation or warranty.Read more


Comments
to post a comment
10