US midterm elections are approaching! Has the trading window for US stocks opened?

Historical win rate exceeds 70%! The "strongest month" of midterm election years is approaching. Is US equities' October worth watching?
As US stocks enter the fourth quarter, historical seasonality suggests that October may be a rather unique time window in midterm election years.
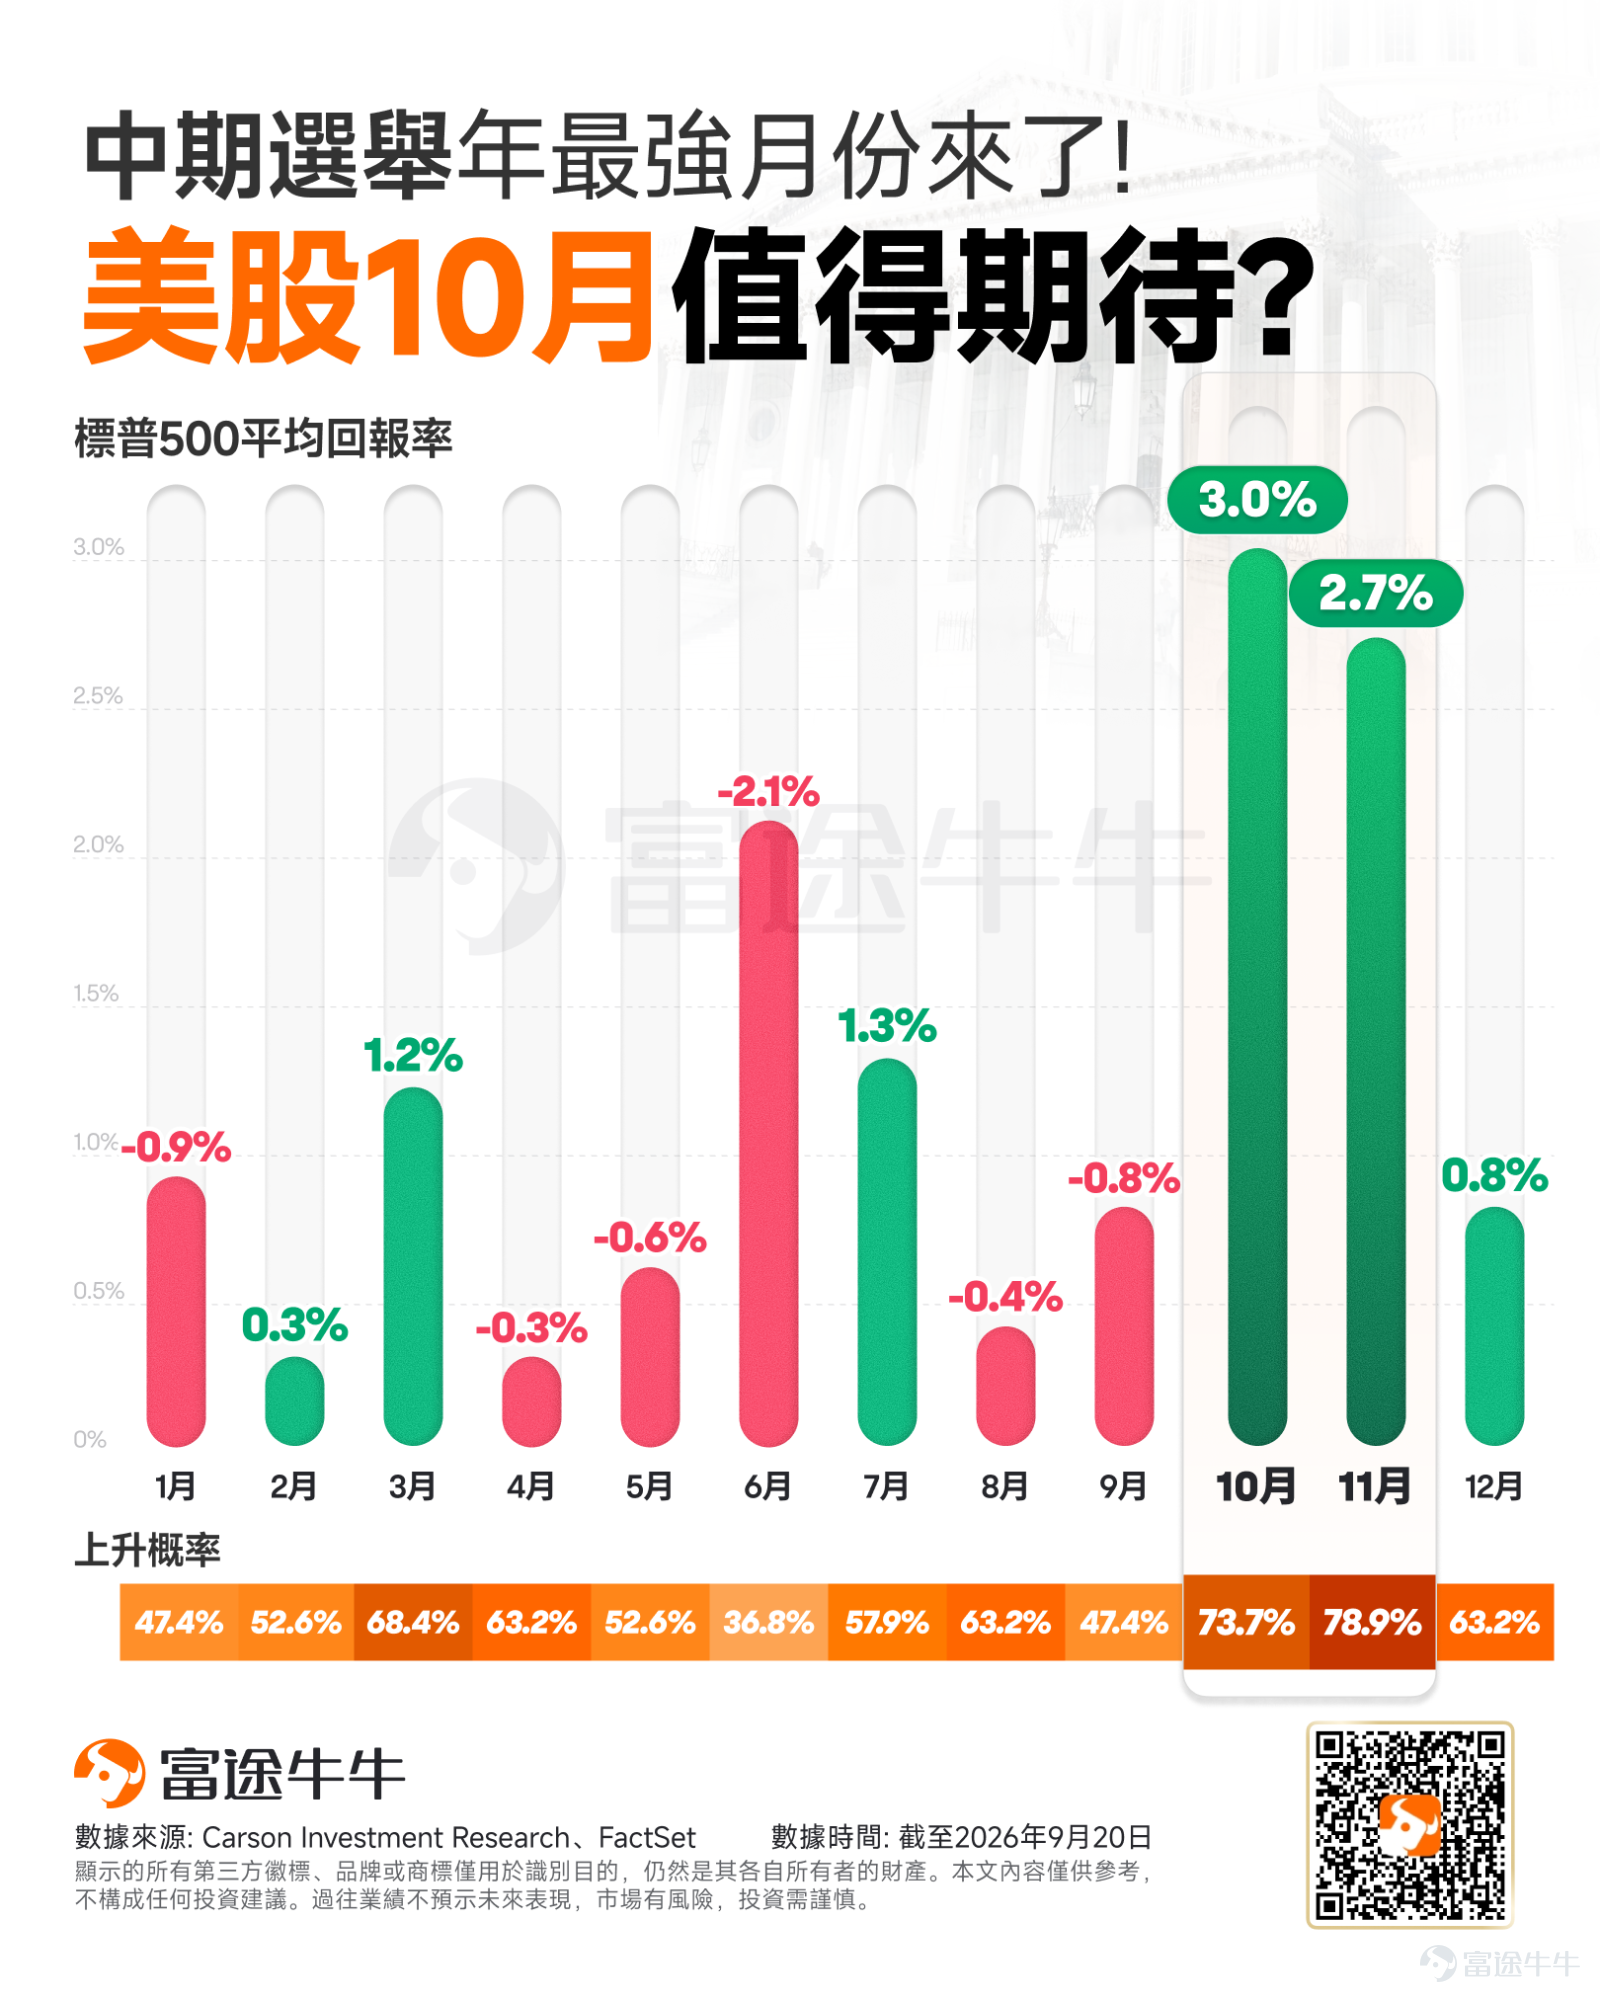
According to historical data since 1950 compiled by Carson Investment Research, in US midterm election years, $S&P 500 Index (.SPX.US)$the average return in October reached 3.0%, with a probability of rising at 73.7%, ranking first among all 12 months of the year in terms of average gains.

--
--
--
More notably, October is not an isolated strong month. Upon entering the fourth quarter, historical data shows a clear overall improvement:the average return in November reached 2.7%, with an even higher probability of rising at 78.9%; December also saw an average return of 0.8%, with a 63.2% probability of rising.
In other words,Data from the past 70-plus years reveals quite distinct seasonal characteristics for US stocks in midterm election years:the first three quarters tend to be volatile, while starting in October, the market often gradually enters a relatively strong phase.
Why do US stocks in midterm election years often follow a pattern of "declining first, then rising"?
From a longer-term perspective, midterm election years are not particularly comfortable.
J.P. Morgan Wealth Management, citing data from CFRA and S&P Global, noted that from 1945 to 2025, the S&P 500 averaged an annual gain of approximately 3.8% in midterm election years, significantly lower than the average gain of about 10.9% in the other three years of the presidential cycle.Meanwhile, the average maximum drawdown in midterm election years was around 18%, which is also higher than in other years.

However, this pressure tends to be concentrated in the first half of the year.Historical data shows that the S&P 500’s average return for the first three quarters of midterm election years was approximately -0.9%,while in the fourth quarter, the average return rose to about 6.4%.
The underlying logic is not necessarily that "elections themselves are bullish for the stock market",but rather that uncertainty is gradually being digested by the market.
As the election approaches, various potential scenarios regarding taxes, fiscal spending, regulation, and policy direction become clearer, meaning the market no longer needs to pay such a high "risk premium" for numerous unknown outcomes. Investors’ attention also gradually shifts back to fundamental factors that truly determine asset pricing, such as corporate earnings, inflation, and interest rates.
JPMorgan also pointed out that political factors primarily affect short-term markets through expectations and uncertainty, while long-term performance still depends mainly on earnings, inflation, and the interest rate environment.
Therefore, a typical market rhythm during midterm election years often follows this pattern:Rising policy uncertainty in the first half → Increased volatility from summer through September → Markets begin pricing in declining uncertainty after entering October → A return to focusing on earnings and macro fundamentals in Q4.
This is also why October stands out prominently in historical statistics.
This October, the three variables truly worth watching are likely:
However, JPMorgan also specifically cautioned thathistorical seasonality should be used more for providing context rather than as a direct forecasting tool,because the underlying economic growth, inflation, monetary policy, and geopolitical environment differ with each cycle.
Therefore, for US equities in 2026, the historical "October Effect" is more akin to a tailwind factor,with fundamentals ultimately determining whether the rally can sustain.
First is the interest rate path.Interest rates and U.S. Treasury yields continue to directly impact the valuation of growth stocks. If expectations for interest rates undergo significant shifts, volatility in high-valuation tech stocks may remain elevated.
Second is the Q3 earnings season.Entering October, U.S. stocks will once again enter an earnings verification period. Compared to simply trading on macro expectations, whether earnings can continue to materialize—particularly revenue, profit, and capex growth for AI-related companies—may determine whether further index gains are driven by "valuation expansion" or "earnings growth."
Third is the changing landscape of election uncertainty.Historical patterns show that one of the key features of midterm election years is not who controls Congress after the election, but rather the reduction in policy scenarios that the market needs to price in as results become clearer.
Therefore, what truly warrants observation this October is whether earnings, interest rates, and policy uncertainty can all move in a direction favorable to risk assets, coinciding with the strengthening of seasonal trends. If these three factors resonate, the historical "midterm election year October rally" is more likely to be supported by fundamentals.
Simply put, after September, U.S. stocks are entering a time window that is statistically much more favorable based on historical data.
Summary
Based on historical patterns,U.S. stocks often perform strongly after midterm elections, forming what is known as the "midterm election effect."On one hand, U.S. stocks have historically had a high probability of annual gains, maintaining an approximate 73%–75% chance of rising each year since 1974, which provides a foundation for post-election market performance. On the other hand, as the midterm elections conclude, policy uncertainty declines temporarily, while market expectations regarding the composition of Congress, fiscal policy, and the policy path for the remainder of the presidential term become clearer, potentially supporting risk appetite.
However, it is important to emphasize that the "midterm election effect" primarily reinforces the existing long-term upward trend in US stocks, rather than offsetting all external shocks. For this year, investors should still remain vigilant about two types of potential disruptions:First, recurring US-Iran tensions could impact market valuations through oil prices, inflation, and interest rate expectations. Second, controversies surrounding the "AI bubble" and high-valuation tech stocks may amplify market volatility if there are significant changes in earnings or capital expenditure expectations.
Therefore, rather than viewing the "midterm election effect" as a deterministic signal for gains, it is better regarded as a historically favorable seasonal backdrop. Whether the current rally can sustain ultimately depends on fundamental factors such as earnings, interest rates, inflation, and geopolitics.
Risk Disclaimer: The above content only represents the author's view. It does not represent any position or investment advice of Futu. Futu makes no representation or warranty.Read more


Comments (38)
to post a comment
98
322