
Options Hub: SpaceX's second wave of lock-up expiration takes effect today! How should options strat

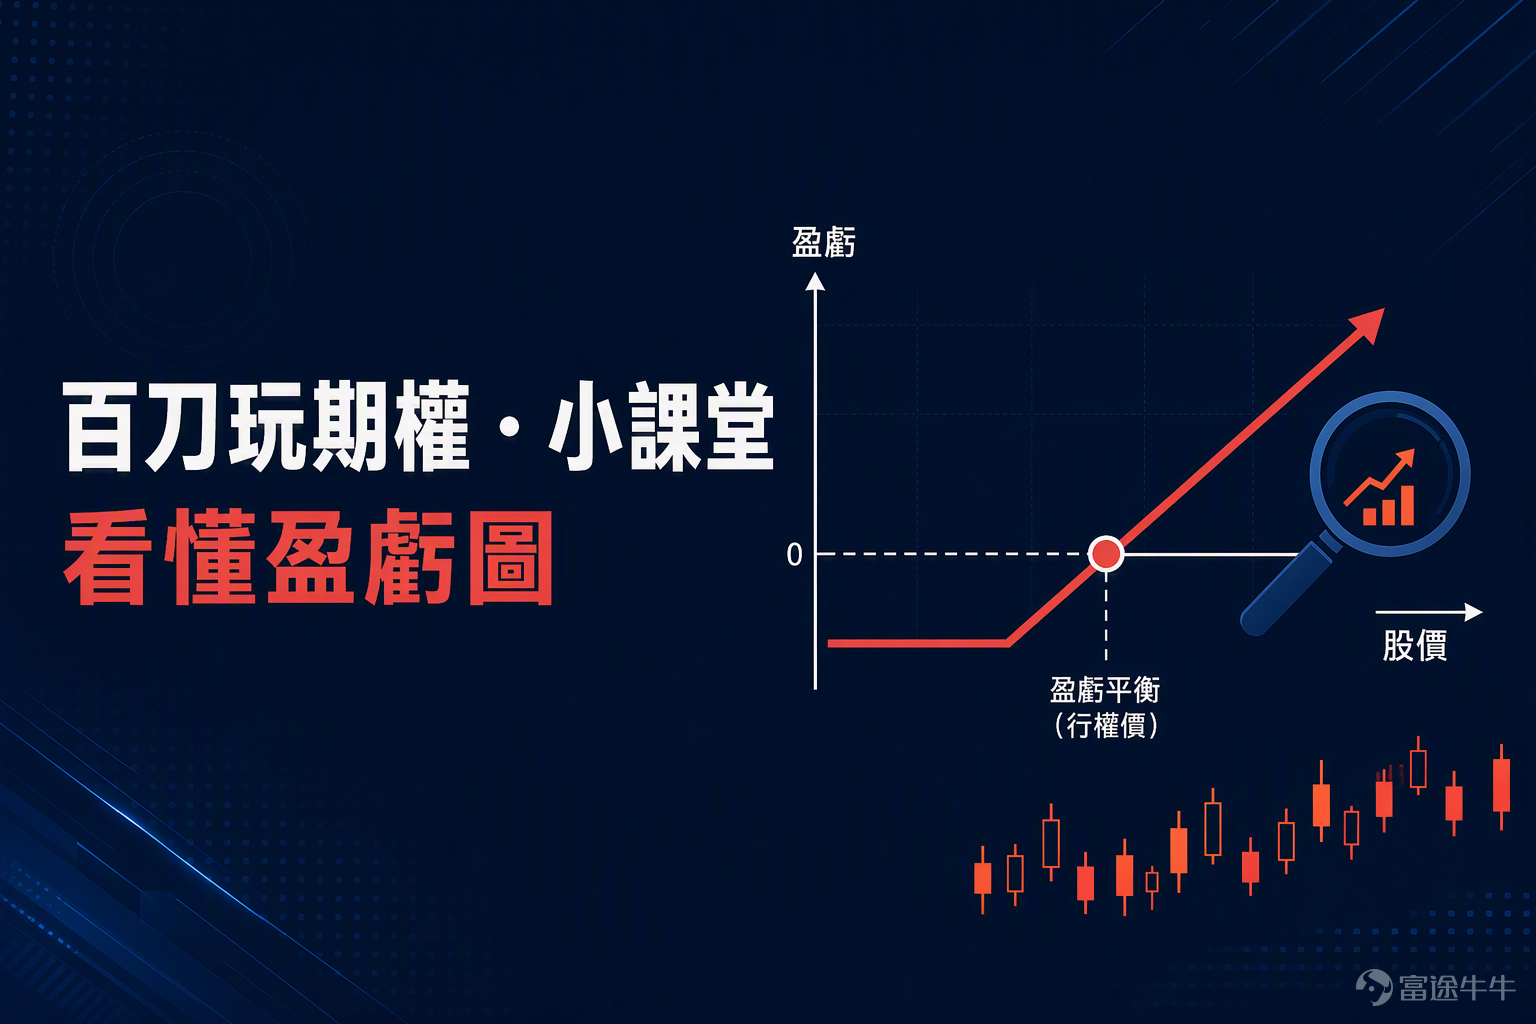
BaiDao Options Mini-Class 03 | Understand Your Profit and Loss Instantly with One Chart! A Complete Guide to Options P/L Charts
Every Wednesday, the 'BaiDao Mini-Class' starts right on time! Starting from scratch, each episode focuses on just one key concept—building knowledge step by step, from simple to complex. Learn episode by episode, and you’ll see options aren’t as hard as you think!
In addition to the Wednesday mini-class, we also have 'Opportunity Pool' on Mondays to discuss potential trade ideas, and 'Weekly Recap' on Fridays to break down cases from the week—each of these three segments has its own focus, and they work even better when consumed together.Follow NiuNiu’s official account 'BaiDao Plays Options' so you never miss an update~

Why should you learn to read this chart?
Fellow investors, have you ever had this experience: you open an options page, see a bunch of numbers and a wavy line, and instantly feel overwhelmed, thinking, ‘What on earth does this mean?’
In fact, that line is your ‘report card’ in the options world—Profit/Loss Chart (P/L Chart)。
It lets you instantly see, before placing an order:
If the stock price rises to a certain level, how much will I earn?
If the stock price falls to a certain level, how much will I lose?
What’s my worst-case loss, and what’s my best-case gain?
Once you learn to read this chart, you’ll no longer be trading blindly—you’ll trade with confidence. In today’s episode, we’ll thoroughly break down this chart.
1. The Two Axes of a Profit/Loss Chart: X-axis Shows Stock Price, Y-axis Shows Your P&L
Imagine a coordinate graph in front of you, just like the ones you drew in middle school math class.
Horizontal axis (X-axis): Stock price
From left to right, it represents the price of the underlying stock—the further right, the higher the price.
Vertical axis (Y-axis): Your profit or loss (P&L)
There’s a horizontal line in the middle representing 'zero'; above the line indicates profit (positive numbers), and below the line indicates loss (negative numbers).
That’s all there is to it.The X-axis tells you 'where the stock price is,' and the Y-axis tells you 'whether you’re making or losing money.'
Here’s a relatable analogy: the X-axis is like the scale on a thermometer (what the temperature is today), and the Y-axis is like your mood index (happy or sad). As the stock price moves, your wallet feels either 'happy or sad'—a profit/loss diagram simply visualizes this relationship.
II. Strike Price: The Key 'Inflection Point'
On the profit/loss diagram, you’ll see a critical point—often marked as a 'kink' or labeled explicitly—that is theStrike Price。(For multi-leg option strategies, the profit/loss diagram usually features more than one inflection point; here, however, we’ll stick to the basic 'four core option strategies.')
What is the strike price? It’s the 'agreed-upon transaction price' specified in your contract.
Think of it like buying a house:
You signed a contract with the landlord stating, 'In three months, I have the right to buy this property for NT$10 million.'
This 'NT$10 million' is the strike price.
If, in three months, the property price rises to NT$12 million, you can still buy it for NT$10 million—making a profit. If the price drops to NT$8 million, you can choose not to buy (i.e., let the option expire), losing at most the deposit you initially paid (the option premium).
Back to options:
Buying a call option with a strike price of $190 means, 'At expiration, I have the right to buy this stock at $190.'
If the stock price exceeds $190, your option starts to become profitable; if the stock price is below $190, this call option has no value to you.
The strike price corresponds to the 'starting line' on the profit-and-loss diagram—the stock price must cross this line for your option to gain intrinsic value.
3. Breakeven Point: The 'Passing Grade' for Profit
Just surpassing the strike price isn't enough. Remember, buying an option costs money—that amount is calledthe option premium。
So, the stock price not only needs to exceed the strike price, but also rise a bit further to 'recoup' the premium you paid—only then do you truly start making a profit.
This 'break-even' point is calledBreak-even Point。
Break-even Point formulas for the four basic option strategies:
Long Call: Break-even Point = Strike Price + Premium
Long Put: Break-even Point = Strike Price – Premium
Short Call: Break-even Point = Strike Price + Premium
Short Put: Break-even Point = Strike Price – Premium
Fellow investors can see that buyers and sellers share the same break-even point—but they stand on opposite sides of profitability: the buyer starts profiting once the price moves beyond the break-even point, while the seller starts incurring losses.
Do a real calculation, and you’ll understand right away.
Using the previous NVDA example:
NVDA is currently trading at $170, and you're bullish on it taking off next month
Buy one call option with a strike price of $190, premium $2 (one contract covers 100 shares, total cost $200)
Breakeven point = $190 + $2 = $192
What does this indicate?
If NVDA rises to $192, you break even—neither gain nor lose
If it rises to $200, your profit is ($200 − $192) × 100 = $800
If it doesn’t rise above $190, the call expires worthless, and your maximum loss is $200(which is the premium you initially paid)
The breakeven point is your 'passing grade'—only when the stock price crosses this line do you start making real money.
4. One chart to understand four possible outcomes
Now, let's 'read' the entire profit-and-loss chart. Take a long call as an example:

Here’s the key point: this is what the profit-and-loss chart of a long call looks like—

On the left, there’s a flat horizontal line (limited loss—the most you can lose is the premium paid)
On the right, there’s an upward-sloping straight line (unlimited profit—you gain as much as the stock price rises)
This is the 'non-linear payoff' of a long call—Capped losses, uncapped gains。
Try it yourself
After finishing this lesson, open your Futubull app and pick any stock you’re familiar with:
1. Go to 'Options' → 'Option Chain'
2. Select any call option and check its strike price and premium
3. Use the formula you learned today to calculate your breakeven point yourself
4. Then go into the 'Profit & Loss Analysis' feature and check the breakeven chart generated by the system—see if it matches your calculation
In the next episode, we’ll use this chart to break down the complete trading logic behind 'buying a call option at $100'!
Finally, we’ve got a little perk for our fellow investors—feel free to claim it!Options Starter Pack~
This event is exclusively open to invited HK users. Click to learn more.Detailed terms and conditions of the promotion >>

Disclaimer
This content does not constitute an offer, solicitation, recommendation, advice, opinion, or any form of guarantee regarding any securities, financial products, or instruments. Trading options carries substantial risk of loss. In certain scenarios, your losses may exceed the initial margin deposit. Even if you set contingency instructions such as 'stop-loss' or 'limit orders,' these may not necessarily prevent losses, as market conditions could render such instructions unexecutable. You may be required to deposit additional margin on short notice. If you fail to meet the margin call within the specified timeframe, your open positions may be liquidated. Nevertheless, you remain fully liable for any resulting deficit in your account. Therefore, prior to trading options, you should thoroughly study and understand options trading and carefully consider whether such trading aligns with your financial situation and investment objectives. If you do trade options, you must become familiar with the procedures, rights, and obligations associated with exercising options and their expiration.
Risk Disclaimer: The above content only represents the author's view. It does not represent any position or investment advice of Futu. Futu makes no representation or warranty.Read more


Comments (230)
to post a comment
235
60