Apple and Amazon reported starkly contrasting earnings— which one are you bullish on?

SMCI surged nearly 20% in a single day—does this signal short-term selling pressure or a turning point in the trend?
$Super Micro Computer (SMCI.US)$ will release a preliminary earnings update after market close on July 21. The company expects Q4 revenue to be near the lower end of its $11–12.5 billion guidance range. However, what truly triggered a significant market reaction were two figures that exceeded expectations: first,gross margin improved substantially, significantly outperforming prior guidance;Second,Q4 new orders surpassed $60 billion, pushing the backlog of orders to an all-time high.This order figure directly validates Super Micro Computer’s pivotal role in NVIDIA’s GPU supply chain, indicating that demand for AI server infrastructure is accelerating rapidly.
Following the announcement,Super Micro Computer surged as much as 25% intraday on July 22,marking its largest single-day gain in 2024, and closed up approximately 19.7%. Multiple institutions quickly revised their ratings: Goldman Sachs upgraded the stock to Buy on the same day (maintaining a $30 price target); Needham raised its price target from $40 to $46 while maintaining a Buy rating; Rosenblatt Securities initiated coverage with a Buy rating and a $45 price target; Barclays maintained a Hold rating but increased its price target from $34 to $38, citing strong order momentum. Notably, Mizuho Securities lowered its price target to $34 while keeping a Hold rating, reflecting lingering institutional skepticism about the sustainability of the sharp rally.The company will release its full Q4 and FY2026 earnings report after market close on August 11,at which time details of its various business segments and data will be further validated.
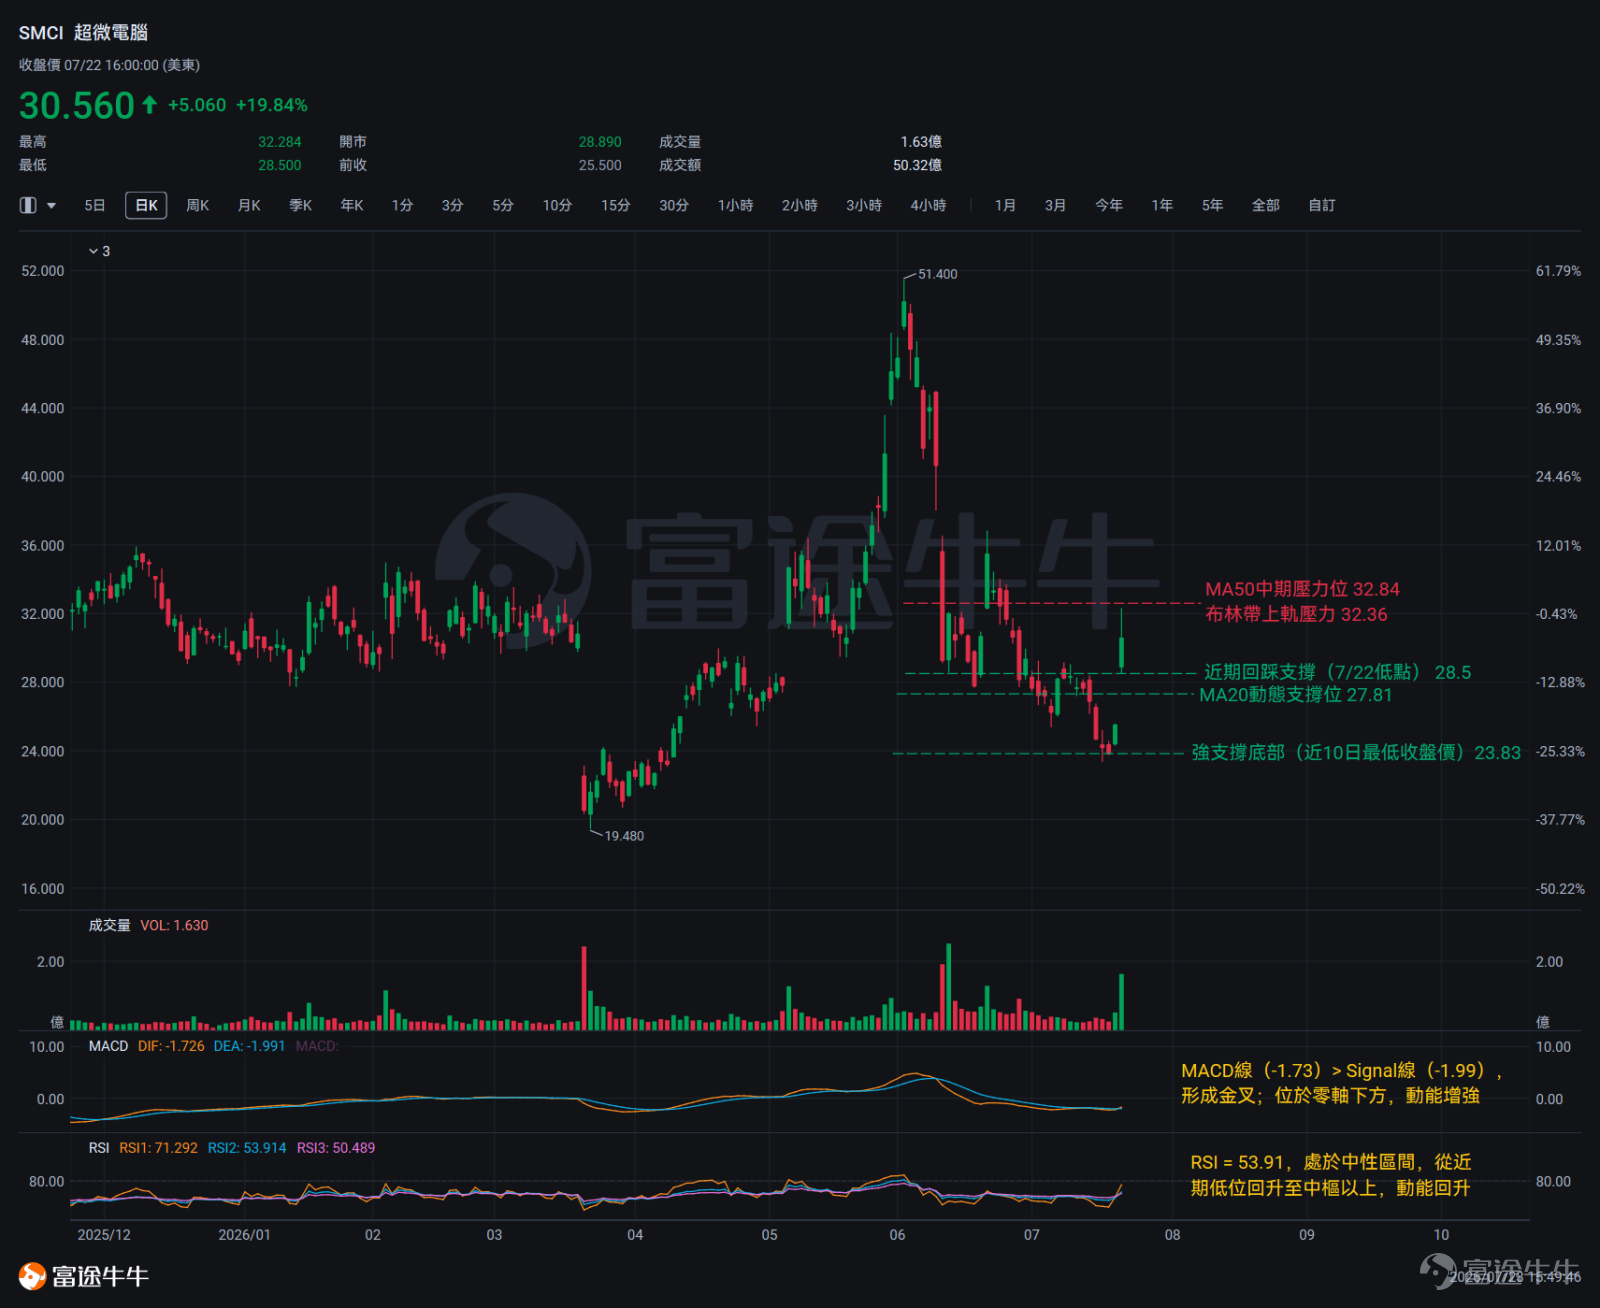
Recent stock price movement

From the perspective of moving average patterns, the current price has reclaimed the 20-day moving average (MA20) at $27.81, indicating thatthe very short-term downtrend has been interrupted, and the near-term trend has temporarily shifted from weakness to stability. The medium-term moving average system remains in a bearish alignment, and the bearish pressure structure has not dissipated.Regarding Bollinger Bands, the price has jumped from near the lower band into the zone between the middle band ($27.81) and the upper band ($32.36), causing a sharp spike in short-term volatility.
On the candlestick chart,a complete bottom reversal pattern has formed over the past 10 trading days:From July 13 to July 20, five consecutive bearish candles appeared, with closing prices declining gradually from $27.66 to $23.83. Trading volume patterns approached the tail end of panic selling,signaling clear bottom-formation behavior.On July 21, the candle showed a relatively long lower wick, a small real body positioned toward the upper end, and emerged within the bottoming zone following the five-day decline,constituting an initial reversal signal,which was confirmed the next day. On July 22, a gap-up bullish candle fully engulfed prior bearish candles, posting a single-day gain of 19.7% and forming a strong bullish engulfing pattern.is a relatively reliable signal confirming a reversal at the bottom of this phase.
Notably, on July 22, the price retreated from the high of $32.28 to $30.56, indicating thatsignificant selling pressure has already been encountered near the $32 level.—this selling pressure was already evident intraday; whether the price can effectively break above and firmly close above this zone will be the key test for short-term bullish momentum. Overall,a short-term rebound structure has already formed on the daily chart, but conditions for a medium-term trend reversal are not yet in place.
On the support side,$28.50 (the low of the strong bullish candle on July 22, which was also an intraday high-volume trading zone) serves as the most immediate support level.—a break below this level would indicate damage to the short-term rebound structure, at which point attention should shift to whether the starting point of the previous rally around$25.50 can provide subsequent support;if the price falls further belowthe dynamic MA20 support level ($27.81), short-term technical signals will turn broadly bearish.In extreme scenarios, the recent lowest closing price$23.83 forms a strong support zone and serves as a key psychological anchor for both bulls and bears.
On the resistance side,The upper Bollinger Band at $32.36 and the 50-day moving average (MA50) at $32.84 create a dual resistance zone,The upper shadow on July 22 reached $32.28, already confirming actual selling pressure in this range.If the price subsequently breaks above $32.84 with increased volume and closes firmly above this level,it would signal a potential reversal in the medium-term trend,at which point attention should be paid to whether the MA50 can transition from resistance to support, thereby confirming a shift in the medium-term signal.
Key Technical Indicator Analysis
Moving Averages (MA):MA20 = $27.81, MA50 = $32.84; price is above MA20 but below MA50. Short-term moving averages are showing bullish signs, yet MA20 remains below MA50, indicating the overall downtrend has not yet been repaired.
RSI:The current value is 53.91, within the neutral range, having rebounded from recent lows back above the midline, indicating recovering momentum.
MACD:MACD line (-1.73) > Signal line (-1.99), forming a golden cross; located below the zero line, with strengthening momentum.
Bollinger Bands:Price is trading between the middle Bollinger Band ($27.81) and the upper band ($32.36), with the bands in an expanding state; price has surged sharply from near the lower band into the upper-middle range, causing a sudden spike in short-term volatility.
IV Analysis

IV Percentile at 100% and IV Rank at 100—both metrics are simultaneously at their maximum levels,marking the most expensive time window for SMCI options.An IV/HV ratio of 1.16x indicates that the market’s priced-in fear premium is approximately 16% higher than actual (realized) volatility,presenting a genuine opportunity window for options sellers.
Options Strategy Reference #1: Covered Call

(The design image displayed on screen is for illustrative purposes only and does not constitute any investment advice or guarantee; market conditions change frequently, and the prices shown do not reflect real-time data.)
Ideal for investors who already hold SMCI shares and wish to collect option premiums to reduce their cost basis.
Suggested strike price: $35 (approximately 15% out-of-the-money relative to the current share price, allowing room for upside potential in the underlying stock)
Reference expiration date: 2026-08-07
Reference premium: approximately $105.5 per contract, reducing the effective holding cost by $1.05 per share
Option strategy reference #2: Collar (protective collar)

(The chart above illustrates the simulated profit/loss profile of this strategy at expiration. The design image shown on screen is for demonstration purposes only and does not constitute any investment advice or guarantee; market conditions change rapidly, and the prices depicted do not reflect real-time data.)
Suitable for investors who already hold SMCI shares and, facing uncertainty around the earnings release on August 11, are willing to sacrifice some upside potential in exchange for downside protection.
The essence of a collar strategy is the reallocation of volatility:It sells tail risk (extreme downside) to the put seller and upside excess returns (extreme upside) to the call buyer, keeping the investor within a 'safe zone' in the middle,Transforming the profit/loss distribution from unlimited to a defined range.
In a high implied volatility (IV) environment, this strategy offers exceptional value—because the market is willing to pay a high premium for tail risk, and the investor simultaneously monetizes that risk while also selling the underlying’s upside potential at elevated prices,effectively lowering the cost basis.
Finally, Options Sir has a small giveaway for fellow investors—feel free to claim it!Options Starter Pack
*This promotion is exclusively available to invited Hong Kong users. Click to learn more.Detailed terms and conditions of the promotion >>
Market conditions are complex and ever-changing,Options strategiesToo many choices and unsure how to proceed? Let Futubull help you build a strategy in three simple stepsOptions strategies, making investing simple and efficient!

Options Risk Disclosure:An option is a contract that grants the holder the right—but not the obligation—to buy or sell an underlying asset at a predetermined price on or before a specified date. Option prices are influenced by multiple factors, including the current price of the underlying asset, the strike price, time to expiration, and implied volatility. Implied volatility reflects the market’s expectation of future price fluctuations over the life of the option; it is derived by reverse-engineering the Black-Scholes pricing model and is commonly viewed as an indicator of market sentiment. When investors anticipate higher volatility, they may be willing to pay more for options to hedge their risk, resulting in higher implied volatility. Traders and investors use implied volatility to assess the attractiveness of option prices, identify potential mispricings, and manage their risk exposure.
Disclaimer:This content does not constitute an offer, solicitation, recommendation, opinion, or any form of guarantee regarding any securities, financial products, or instruments. The risk of loss in trading options can be substantial. In certain circumstances, your losses may exceed the initial margin deposit. Even if you place contingent orders such as 'stop-loss' or 'limit' orders, there is no assurance that losses will be avoided, as market conditions may prevent execution of these orders. You may be required to deposit additional margin on short notice. If you fail to meet such margin calls within the stipulated time, your open positions may be liquidated. You remain fully liable for any resulting deficit in your account. Therefore, prior to trading options, you should thoroughly research and understand how options work and carefully consider whether such trading aligns with your financial situation and investment objectives. If you trade options, you should become familiar with the procedures for exercising options and handling expiration, as well as your rights and obligations upon exercise or expiration. Options trading involves significant risk and is not suitable for all investors. Investors should carefully read"Characteristics and Risks of Standardized Options"。
Risk Disclaimer: The above content only represents the author's view. It does not represent any position or investment advice of Futu. Futu makes no representation or warranty.Read more


Comments (2)
to post a comment
10
20