
SpaceX officially joins the Nasdaq 100—can it spark a rebound rally?

Bull Bull Technical Intelligence | SpaceX accelerates its downward trend, falling back into the IPO price range; watch these two key support levels next
Since its listing, $SpaceX (SPCX.US)$ In less than a month,the stock plunged sharply by approximately 38% from its recent high of $225, closing at $139.14 as of July 13.On the very same day that the share price broke below the $140 level, Bank of America released a research report stating that SpaceX still has about 68% upside potential at its current price, maintaining a 'Buy' rating and a $235 price target—highlighting significant divergence among institutional views on fundamentals and a notable disconnect with short-term technical indicators. Meanwhile, Cathie Wood’s fund chose to aggressively buy during SpaceX’s price decline, which the market interpreted as a signal of long-term capital positioning.
On July 13, the U.S. Federal Aviation Administration (FAA) officially announced the conclusion of its investigation into the Starship’s 12th flight anomaly, clearing the path for the planned 13th test flight this week. Raymond James promptly reaffirmed its $800 price target, characterizing this upcoming test flight as a 'real-world stress test' of SpaceX’s execution capabilities and viewing it as a pivotal observation point that will determine the extent of future valuation recovery.
SpaceX is currently facing pressure not only on the valuation front but also from the supply side.Lock-up periods on internal company shares will continue to expire through 2027, potentially giving employees and early investors increasing opportunities to sell, meaning share supply in the market will remain in an expansionary state over the long term—even if the long-term investment thesis remains solid.Persistent shareholder selling will continue to weigh on the stock price.This is especially true as SpaceX has just completed its IPO and the market is still in the valuation discovery phase, making sentiment particularly volatile; combined with lock-up expirations and the deflation of speculative bubbles, these factors constitute the most immediate downside risks in the near-to-medium term.
Notably, on the very day SpaceX was officially added to the Nasdaq-100 Index (July 7), its shares fell more than 5%.The market’s reaction to this cluster of positive catalysts confirms the current bearish dominance in technical sentiment.Below is a technical breakdown of the recent price structure and key levels.
SpaceX (SPCX)

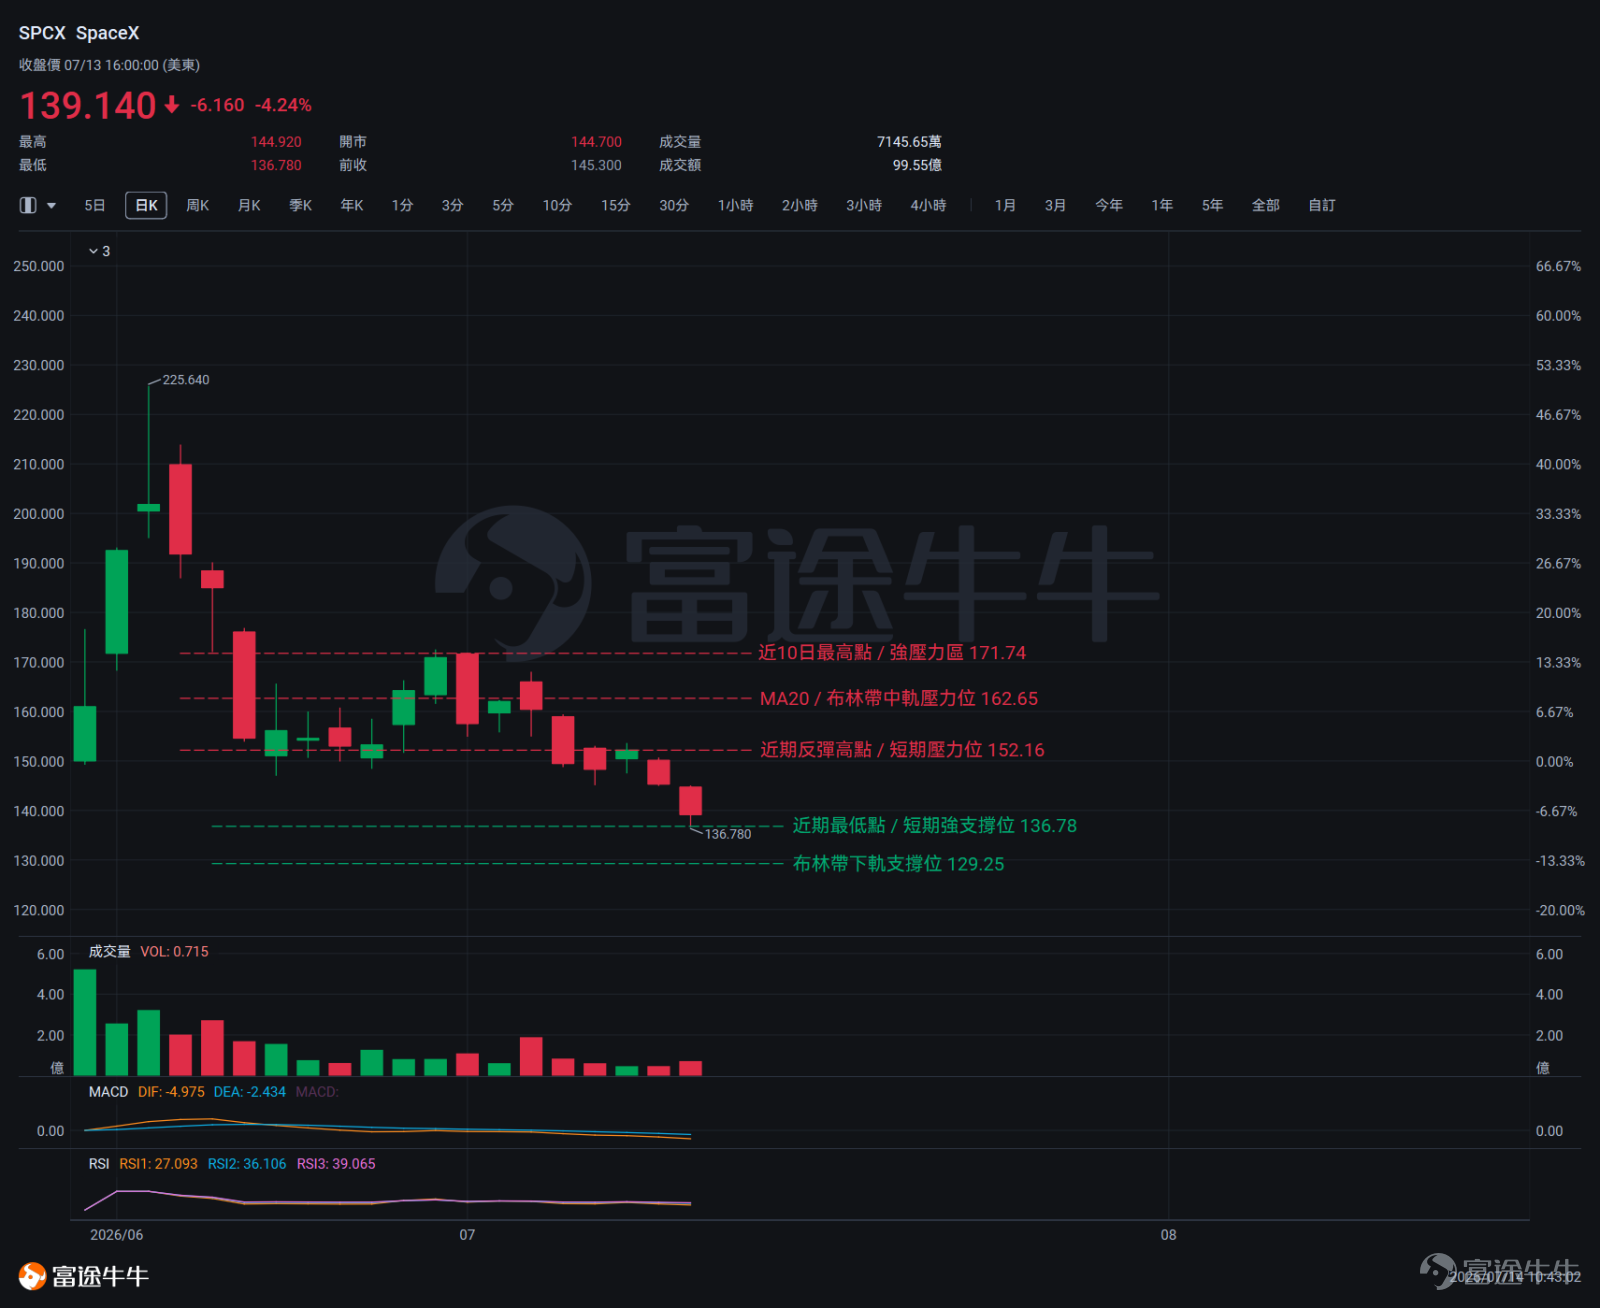
The turning point of this decline can be traced back to July 1. The stock opened near $171.57 that day, showed almost no upside momentum during the session, and then fell steadily to close at $157.54—a single-day drop of as much as 8.2%. The top was formed right at the open, especially against the backdrop of two strong bullish candles on June 29 and 30.This formed a bearish reversal pattern, marking the substantive starting point of the trend shift.
In early July, the bearish continuation became increasingly evident. Three consecutive down days on July 7, 8, and 9 each closed lower than the previous, with each open near the prior day’s real body and virtually no bullish rebound candles. Every attempt by bulls to step in was overwhelmed by sellers. On July 9, a single-day rebound candle appeared (closing at $152.16), but its real body was entirely engulfed by the surrounding bearish candles; the very next day (July 10), prices broke below and made a new low,further confirming the sustained dominance of the bears.
On July 13, the stock opened at $144.70, hit an intraday low of $136.78, and closed at $139.14, with an extremely short upper wick—indicating consistent bearish control throughout the session and a failure to meaningfully recover from the intraday losses. Combined with moving averages and Bollinger Bands,the price remains deeply below the 20-day moving average (MA20) at $162.65, and there is currently no valid signal indicating an end to this bearish bias.
Key Technical Indicator Analysis
Moving Averages (MA):MA20 = $162.65; the price has significantly broken below the MA20, deviating by approximately 14.4%. The moving average is sloping downward, reflecting clear bearish dominance.
RSI:The current RSI is approximately 36.11, positioned in the lower part of the neutral range and has not yet reached the oversold threshold (30). With the stock price continuing to decline recently, a potential bearish divergence warning exists if the RSI does not decline in tandem.
Bollinger Bands:Middle band at $162.65, lower band at $129.25, currently in an expansion phase. The current stock price of $139.14 lies between the middle and lower bands and continues moving toward the lower band. Bollinger Band expansion indicates the market is in an accelerating downtrend rather than a consolidating or sideways phase.
Technical综合 Judgment
Current support levels$136.78 (intraday low on July 13) is the nearest technical support level at this stage;If this level is breached,the Bollinger Band lower band at $129.25 will become the second line of defense, but accelerated downside risk should be closely monitored.
To halt the continuation of the short-term downtrend,the price must first reclaim and stabilize above $145.30 (July 10 closing price / lower boundary of recent high-volume trading zone); further recovery would require a breakout above $152 (July 9 rebound high).It has the conditions to extend toward the 20-day moving average (MA20) at $162.65, which coincides with the middle Bollinger Band.The 20-day moving average (MA20) / middle Bollinger Band at $162.65 is a key level for identifying whether a meaningful trend reversal has occurred.

Risk Disclaimer: The above content only represents the author's view. It does not represent any position or investment advice of Futu. Futu makes no representation or warranty.Read more


Comments (8)
to post a comment
43
72