
BullBull Tech Intel | INTC soars 11% in a single day, MRVL joins the S&P 500—Is the semiconductor rally a 'genuine reversal' or just a 'bounce from oversold levels'?
On the trading day of June 8 in U.S. Eastern Time, the semiconductor sector saw a collective rebound, with two stocks standing out for their particularly strong gains. $Intel (INTC.US)$ One surged more than 11% in a single day, $Marvell Technology (MRVL.US)$ while the other rose by approximately 10%.
According to reports, Google has shifted the manufacturing of approximately 3 million TPU chips to Intel, and NVIDIA is also said to be evaluating Intel as a potential backup manufacturer. The market interpreted these two developments together as a substantive breakthrough for Intel’s foundry business. Marvell Technology’s recent momentum stems from the positive news that it will officially join the S&P 500 index on June 22, which provides clear support from anticipated passive index-tracking buying.
Directly buoyed by these news catalysts, the technical charts of both stocks have shown notable changes, though they are at very different stages of their respective trends—Intel remains in a bottom-seeking phase following a recent deep correction, while Marvell Technology continues its medium- to long-term uptrend.
Intel (INTC)

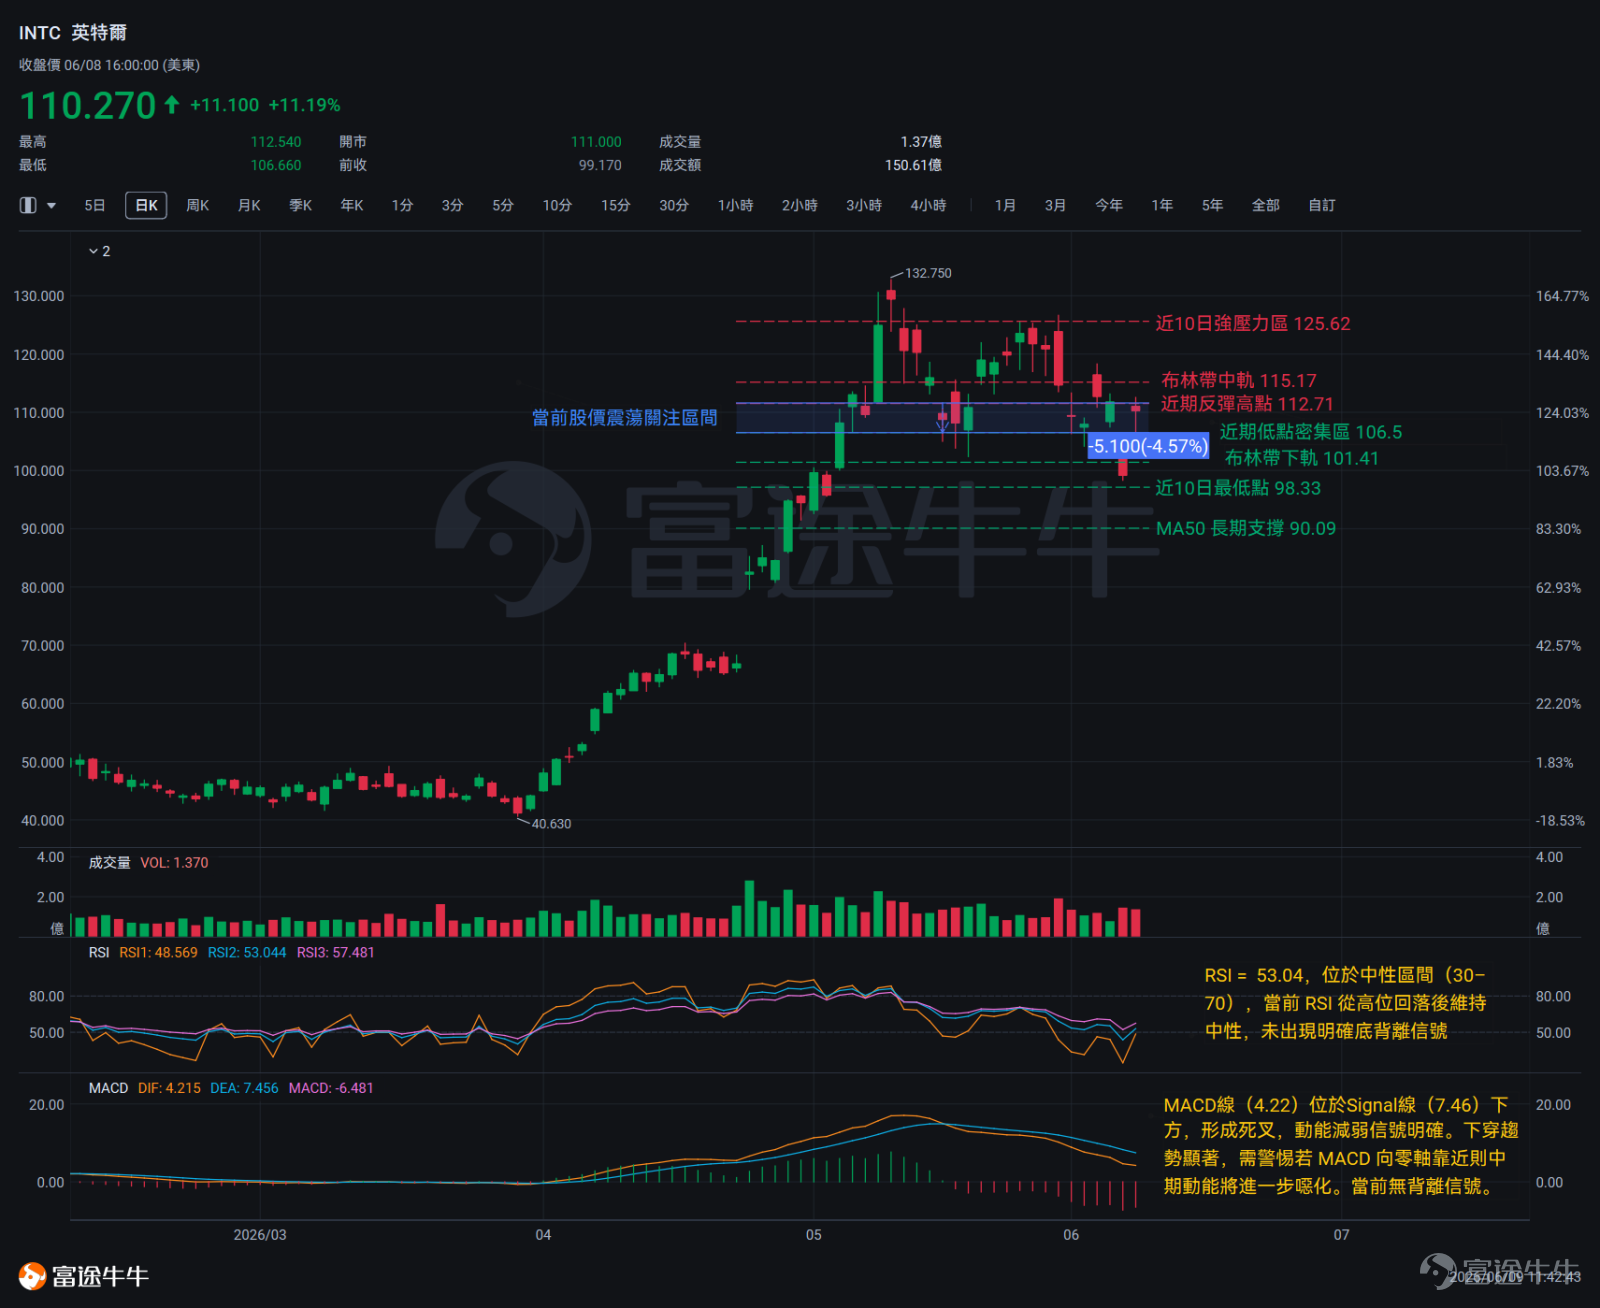
Intel is currently trading at $110.27 per share,and its recent price action overall reflects a weak, range-bound phase.Although the price remains above the 50-day moving average (MA50) at $90.09—indicating that the medium-term moving average structure has not completely broken down—it has clearly fallen below the 20-day moving average (MA20) at $115.17, signaling bearish short-term momentum. More visibly, the past 10 trading days have exhibited wide-ranging volatility characterized by a sharp decline from highs followed by a bounce from lows: the stock dropped from its peak of $126.64 on May 29 to a low of $98.33 on June 5, before rebounding sharply on the major positive news of securing Google’s large TPU manufacturing order. The current price is trading in the lower portion between the middle Bollinger Band ($115.17) and the lower band ($101.41), and the medium-term trend direction still awaits further confirmation.
At the candlestick pattern level, several notable signal points have emerged over the past 10 days.
Large bearish candle on May 29 (a potential reversal signal from high levels):The price range for the day dropped from a high of USD 126.64 to a low of USD 113.54. This high-volume bearish candle decisively broke through the prior consolidation platform, marking the acceleration phase of the current rapid decline and serving as one of the most critical reference anchor points for subsequent price action.
June 1–2: Emerging piercing pattern (temporary easing of selling pressure):In this two-candle formation, the June 2 bullish candle closed at USD 107.93, slightly above the previous day’s (June 1) open of USD 107.45, initially exhibiting characteristics of a piercing pattern and suggesting some short-term relief in selling pressure. However, since the close failed to surpass the midpoint of the prior day's real body (approximately USD 108), the bullish reversal signal remains weak—acting more as a 'short-term warning' than a 'confirmed reversal.'
June 5 bearish candle (panic-selling signal):The session opened at its intraday high of USD 106.48 and closed at USD 99.17, posting a single-day drop exceeding 11% with no upper shadow. Such extreme declines typically reflect concentrated emotional selling and are referred to in technical analysis as 'capitulation.' Following such an extreme bearish candle, a swift recovery on the next trading day often carries short-term bottoming implications.
June 8: Emerging counterthrust pattern (stabilization observation phase):The session tested a low of USD 106.66 and closed at USD 110.27, showing a pronounced lower shadow. However, it ultimately closed lower, failing to form a complete hammer pattern. Together with the extreme low seen on June 5, these two candles jointly defined a short-term bottom-testing zone between USD 98.33 and USD 106.66.
Taken together, the above patterns indicate thatthe panic-selling candle on June 5 and the long-lower-shadow bearish candle on June 8 jointly form a suspected 'two-day bottom-probing structure,' signaling initial signs of short-term selling pressure convergence.However, there is currently no valid engulfing bullish candle or high-volume upward breakout to confirm a reversal, so the nature of this potential bottom remains inconclusive.We need to wait for subsequent bullish candles to confirm the validity of this support.
Key Technical Indicators Interpretation
Moving Average (MA):The 20-day moving average (MA20) at $115.17 is above the 50-day moving average (MA50) at $90.09. The current share price is below MA20, making the short-term moving average a resistance level; MA50 is approximately $20 below the current price, offering medium- to long-term support.
RSI:The current reading is 53.04, within the neutral range (30–70). No clear bullish divergence signal has emerged yet.
MACD:The MACD line (4.22) is below the Signal line (7.46), forming a bearish crossover and clearly indicating weakening momentum. The downward trend is pronounced; caution is warranted—if the MACD approaches the zero line, medium-term momentum could deteriorate further. No divergence signals are currently present.
Bollinger Bands:The current share price ($110.27) lies between the middle band ($115.17) and the lower band ($101.41), closer to the lower band. Recent volatility has increased significantly, reflecting heightened market divergence. While the price has not touched the lower band yet, it is trading within a wide range, and a directional breakout will require confirmation after the Bollinger Band width narrows.
Comprehensive Technical Assessment
Near-term focus should be on the key support zone at $106.50—a high-volume trading area formed by the confluence of three recent lows: $104.17 (June 2), $107.48 (June 4), and $106.66 (June 8).This clustering is relatively dense and carries some significance as a potential base formation. If this support zone is breached, the next dynamic buffer would be the Bollinger Bands lower band at $101.41. Of greater concern is the $98.33 level (June 5 low); a decisive break below this point would leave little near-term support beneath it, opening significant downside potential.
Key resistance levels to watch on the upside: $112.71 → $115.17 → $120.89—$112.71 corresponds to the June 3 rebound high, marking the upper boundary of a recent dense trading zone. The rebound must first overcome this obstacle. $115.17 represents the confluence of the 20-day moving average (MA20) and the middle Bollinger Band, creating dual technical resistance that makes a breakout relatively difficult. If price can firmly close above $115.17, the next key level for assessing the nature of this rebound will be $120.89 (the lower edge of a prior consolidation range).Reclaiming this level would signal a shift in trend from a 'weak rebound' to 'structural recovery'; conversely, if price faces selling pressure near $120.89, the current rally would still fall within the scope of a weak pullback.
Marvell Technology (MRVL)

Marvell Technology is currently trading at $288.85, and from multiple technical perspectives,it is clearly situated within an uptrend channel.Notably, since June 2, the stock has exhibited a pattern of sharp gap-up gains followed by sideways consolidation at elevated levels, indicating short-term momentum is facing periodic digestion pressure.
On the candlestick chart, the past 10 days have seen a complete cycle—from bottom confirmation to trend acceleration and then to divergence at higher levels.
Bullish candlestick cluster from May 28 to June 1 (confirmation of a阶段性 bottom):Three consecutive bullish candles (closing at $204.83, $205.00, and $219.43 respectively) emerged after the sharp declines on May 26 and 27, reflecting gradually strengthening buying interest at lower levels and carrying bullish implications for a阶段性 bottom confirmation.
Breakout bullish candle on June 2 (key inflection point for trend acceleration):The stock opened at $253.46 and closed at $290.79, surging nearly $37 in a single day with virtually no upper shadow and an extremely short lower shadow (approximately $1), indicating buyers dominated trading from open to close without any meaningful selling pressure. This candle appeared precisely at the breakout point of a prior consolidation range, delivering a powerful trend-acceleration signal. It also created a significant gap near $252.43, which has since served as a structural support level tested multiple times.
June 3 to June 8: High-level consolidation pattern (phase of bullish-bearish divergence):Four consecutive candlesticks (alternating bearish, bullish, bearish, and bullish) showed significant price swings within the $261–$324 range, reflecting clear confrontation between bulls and bears near the highs, with direction still uncertain. On June 5, a bearish candle closed at $263.47, nearly retesting the gap created on June 2 ($252.43). This was followed by a bullish close at $288.85 on June 8, confirming support above the gap—an indication of a阶段性 bullish rebound amid high-level consolidation.
Overall pattern analysis suggests thatMarvell Technology maintains an intact uptrend framework,with the base formation and the strong bullish candle on June 2 establishing the primary upward bias. However, short-term momentum is currently undergoing a digestion phase.Confirmation of trend continuation hinges critically on whether the price can subsequently break above the recent high of $324.20 with convincing volume.
Key Technical Indicators Interpretation
Moving Average (MA):The 20-day moving average ($214.46) remains above the 50-day moving average ($169.16), showing a bullish alignment and a structurally intact uptrend.
RSI:Current RSI stands at 69.18, near the upper end of the neutral zone. Attention should be paid to whether the current RSI falls below the peak level recorded on June 3—if the June 3 RSI peak was higher, this would constitute an initial bearish divergence warning signal requiring further confirmation.
MACD:MACD line (34.75) sits above the Signal line (26.48), forming a golden cross with strengthening momentum and no divergence signals observed so far.
Bollinger Bands:The stock price at $288.85 is trading between the middle Bollinger Band at $214.46 and the upper band at $309.96, leaning toward the upper band zone. Current volatility is extremely high, indicating a phase of accelerating trend expansion rather than a narrowing breakout from prior ranges.
Comprehensive Technical Assessment
Key near-term support levels to watch: $277.56 → $252.43 → $214.46— $277.56 marks the lowest consolidation point during the June 4 pullback and serves as the 'first line of defense' in the recent weak correction. If this level is decisively breached, attention should shift to whether the $261 area can provide support. $252.43 aligns with the lower edge of the gap-down that occurred on June 2 and represents structural support established just before the current acceleration phase began. A break below this level would inflict substantive damage on the trend structure. $214.46 (dynamic MA20 support) acts as the anchor for the medium-term trend.As long as the price remains above this moving average, the overall framework of the uptrend remains fundamentally intact.
Key resistance zone to monitor closely: the range between $309.96 and $324.20— $309.96 corresponds to the upper Bollinger Band, serving as a 'overheated' warning threshold indicated by volatility metrics. $321.50 (June 4 intraday high) and $324.20 (recent absolute high on June 3) together form the strongest resistance band overhead.If the stock attempts to break above $324.20 on declining volume, caution is warranted regarding the risk of another rejection at highs forming a 'double top.' Conversely, if it breaks and sustains above this level on significantly increased volume, it would signal entry into a new acceleration phase, further opening upside potential.

Risk Disclaimer: The above content only represents the author's view. It does not represent any position or investment advice of Futu. Futu makes no representation or warranty.Read more

Comments
to post a comment
14
23