

存储三巨头即将放榜!高景气度能否延续?
韩国股市不贵,但有点脆
一、估值水平与盈利状况
KOSPI 今年翻了一倍。目前KOSPI 前瞻 PE 大概 8.2 倍。标普 500 是 22 倍,日经 18 倍,MSCI 亚太除日本大约 14 倍。8.2 倍放到哪里都是便宜货。问题是,KOSPI 历史上的周期顶部 PE 也就 10 倍左右。这个市场的估值顶原本不高——财阀治理、股东回报差、地缘风险,韩国折价不是新东西。8.2 倍离 10 倍只有大概 20% 的距离。
盈利端倒是真实的好。当前各大国际行对KOSPI 今年盈利增速一致预期从 48% 修到了 277%。Q1 实际增长 218%。
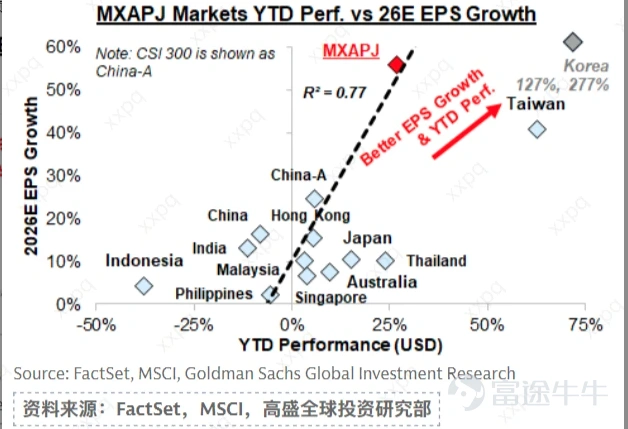
驱动力主要是存储芯片。美国四大云厂商今年资本开支 6400 亿美元,同比增长 70%。韩国占了全球 HBM 九成、存储芯片七成。把三星和海力士剔掉,剩余市场今年盈利增速是 57%。韩国指数的涨幅主要由三星(36%) 和海力士 (29%)贡献,俩加起来 65%。剩下八百只股票分那 35%。
所有的便宜都架在同一个假设上:存储芯片的超级周期会继续。如果这个假设成立,那确实便宜。如果 AI 资本开支意外减速,那便宜就成了贵。
二、谁在买、谁在卖?
外资年初至今净卖出约 500 亿美元,90% 砸在三星和海力士两只股票上。但一个反直觉的事实是:KOSPI 外资持股比例反而从 36% 涨到了 39%,年初至今增加了 3 个百分点。一边是狂卖,一边仓位越来越重——因为这两只股票涨得太快,没卖掉的那部分市值膨胀的速度超过了卖出的金额。

外资为什么卖?
外资卖出的主要原因并不是看空,是合规逼的。涨势迫使再平衡驱动的减持,以避免过度的行业和国家集中度。这意味着如果股价回调,外资可能反而是买盘。但另一个信号需要注意。根据瑞银的数据 ,新兴市场主动基金在韩国的配置已降至"接近历史低位"。外资是被动基金(ETF)在加仓,主动基金经理在撤退。这两类资金的行为逻辑不同:被动 ETF 追涨杀跌,主动基金在做判断。
谁在接?
散户接了 320 亿美元,本土机构接了 210 亿美元。1500 万人炒股,5100 万人口,每三个人里有一个。活跃账户 1.05 亿,人均两个以上。一季度未成年人开户同比增长 10 倍。银证转账余额两个月从 89.5 万亿跳到 119.5 万亿韩元。杠杆 ETF 资产规模达 350 亿美元,占自由流通市值的 1.2%(高盛)。
美股敞口
韩国散户 2025 年净买美股 736 亿美元,全球第三。韩国海外投资组合 63% 是美股,发达经济体均值只有 25%。散户同时重仓韩国半导体和美国科技股——两边高度同向。AI 叙事一旦松动,双边挨打。
三、杠杆水平:结构性脆弱
先说一个反直觉的事实:韩国融资余额占总市值只有 0.5%,而且这个比例一直在降——因为市场涨得比借钱速度快。但杠杆问题不能看一个数——需要拆开四层,结论完全不一样。
存量杠杆 — 池子里有多少借来的钱

资料来源:摩根大通,高盛
谁在借钱、钱往哪去
韩国国会议员姜民国办公室从金融监督院调取的底层数据显示,50 岁以上人群持有信用交易融资余额的 60% 以上。50 到 59 岁 9.06 万亿韩元,同比 85%。60 到 69 岁 6.17 万亿,同比 118%。70 岁以上 2.13 万亿,同比翻倍。这些不是年轻人的零花钱。这是退休金、防老储蓄,是系统性从银行存款向风险资产转移。一个 65 岁的人用融资买三星股票——爆仓不是亏损,是养老金没了。
动态杠杆 — 跌起来会怎样
指标数据来源KOSPI2 挂钩 Short Gamma亿摩根大通43 亿(期货日均 15%)摩根大通 6/43 月霍尔木兹危机两天跌 18%,触发熔断公开信息
杠杆 ETF 的做市商必须在涨时追买、跌时追卖。涨得越多,Gamma 存得越大——然后在下跌时全部反向释放。不需要融资余额碰到上限才会崩,一次 5% 的回调就触发 $43 亿被动抛盘,这还不算融资盘追保。3 月和 5 月的熔断证明这个机制已经运转过两次了。
四、集中度:一个被两股绑架的市场
三星电子和 SK 海力士加起来,占 KOSPI 指数权重的 53%。三星 29%,海力士 24%。两家市值已经到了 1.4 万亿和 1.1 万亿美元。作为对比,标普 500 前三大加起来约 15%。韩国市场的集中度不是偏高,是另一个量级。
MSCI 韩国指数里三星加海力士占约 60%。KOSPI200 前十大占 76% 到 80%。外资持有韩国股票的组合里,这两家占的比重高到触及了合规上限。
行业维度同样极端。半导体一家占了 KOSPI 总市值的一半左右。汽车 4% 到 5%,金融 3% 到 5%,互联网 3% 到 4%。其余所有行业加起来不到 30%。KOSPI 名义上是一个综合指数,实际上是一个半导体单行业指数。今年 KOSPI 涨了约 109%,三星贡献 36 个百分点,海力士贡献 29 个百分点。两家合计 65%。剔除它们,涨幅缩水到 30% 左右。
市场宽度更诚实。5 月 27 日,KOSPI 涨了 2.56%,当天只有 8% 的股票上涨,87% 下跌。年初至今,大概一半股票上涨、一半下跌。指数在新高,市场在分化。
这意味着什么呢?
第一,买 KOSPI 本质上是在买两家公司的存储芯片业务。三星 Q1 利润的 94% 靠存储。海力士更纯。任何对 AI 资本开支、存储价格、供给周期的负面冲击,会同时打穿两家的盈利和估值。指数没有给你任何分散保护。
第二,第三章写的杠杆问题,实际上也是集中度问题的延伸。资金正通过杠杆工具进一步向最大的两家集中,而不是分散。
第三,风险传导不需要多重触发。只需要存储芯片的故事出一个裂缝——三星和海力士的盈利预期下调→指数跌→杠杆 ETF 的做市商被动抛期货→加速下跌→融资盘追保。一条直线,不拐弯。
2026 年的韩国牛市,换句话说,是全球投资者用指数基金和 ETF 的形式,对 HBM 内存芯片下了一个巨大的、集中的、越来越带杠杆的单边赌注。
五、风险
前面四章拆开看,每一层都有合理解释。但拼回去,这些维度不是独立运行的。
盈利预期一下修,外资的技术性卖出就会变成方向性卖出。瑞银数据显示新兴市场主动基金在韩国的配置已经在历史最低水平,跑起来没有阻力。散户接不住之后,杠杆 ETF 的做市商会被动抛期货对冲 Gamma,接着融资盘追保,最后全部压力聚焦到占指数 53% 的两只股票上。3 月和 5 月的熔断已经演示过这条链路是怎么运转的。
风险提示:
杠杆踩踏螺旋:一次 5% 到 10% 的回调触发追保,强制平仓制造更大跌幅。
杠杆踩踏螺旋:一次 5% 到 10% 的回调触发追保,强制平仓制造更大跌幅。
AI 资本开支叙事逆转:CSP 削减 Capex 指引,存储超级周期叙事崩塌,盈利和估值同时往下杀。
中老年养老金蒸发:50 岁以上占了融资总量的六成以上。持续下跌不是"亏损",是退休金没了。半导体周期正常化:新增产能释放,存储价格回落,市场从"超级周期"的定价切换回"正常周期"的定价。
中老年养老金蒸发:50 岁以上占了融资总量的六成以上。持续下跌不是"亏损",是退休金没了。半导体周期正常化:新增产能释放,存储价格回落,市场从"超级周期"的定价切换回"正常周期"的定价。
2026 年的韩国牛市不是传统意义上的泡沫。估值有盈利支撑,外资流出有技术原因,杠杆在总量层面不算极端。但所有正确的判断同时指向同一个方向,所有对冲机制同时缺失。这不是"会不会跌"的问题,是"跌起来会怎样"的问题。
风险及免责提示:以上内容仅代表作者个人观点,不代表富途任何立场,亦不构成任何投资建议,富途对此不作任何保证与承诺。更多信息

评论(1)
发表评论
6