Ganfeng Lithium's rebound faces resistance; the 70 yuan level becomes key resistance, and the 66.9 yuan support line is under test
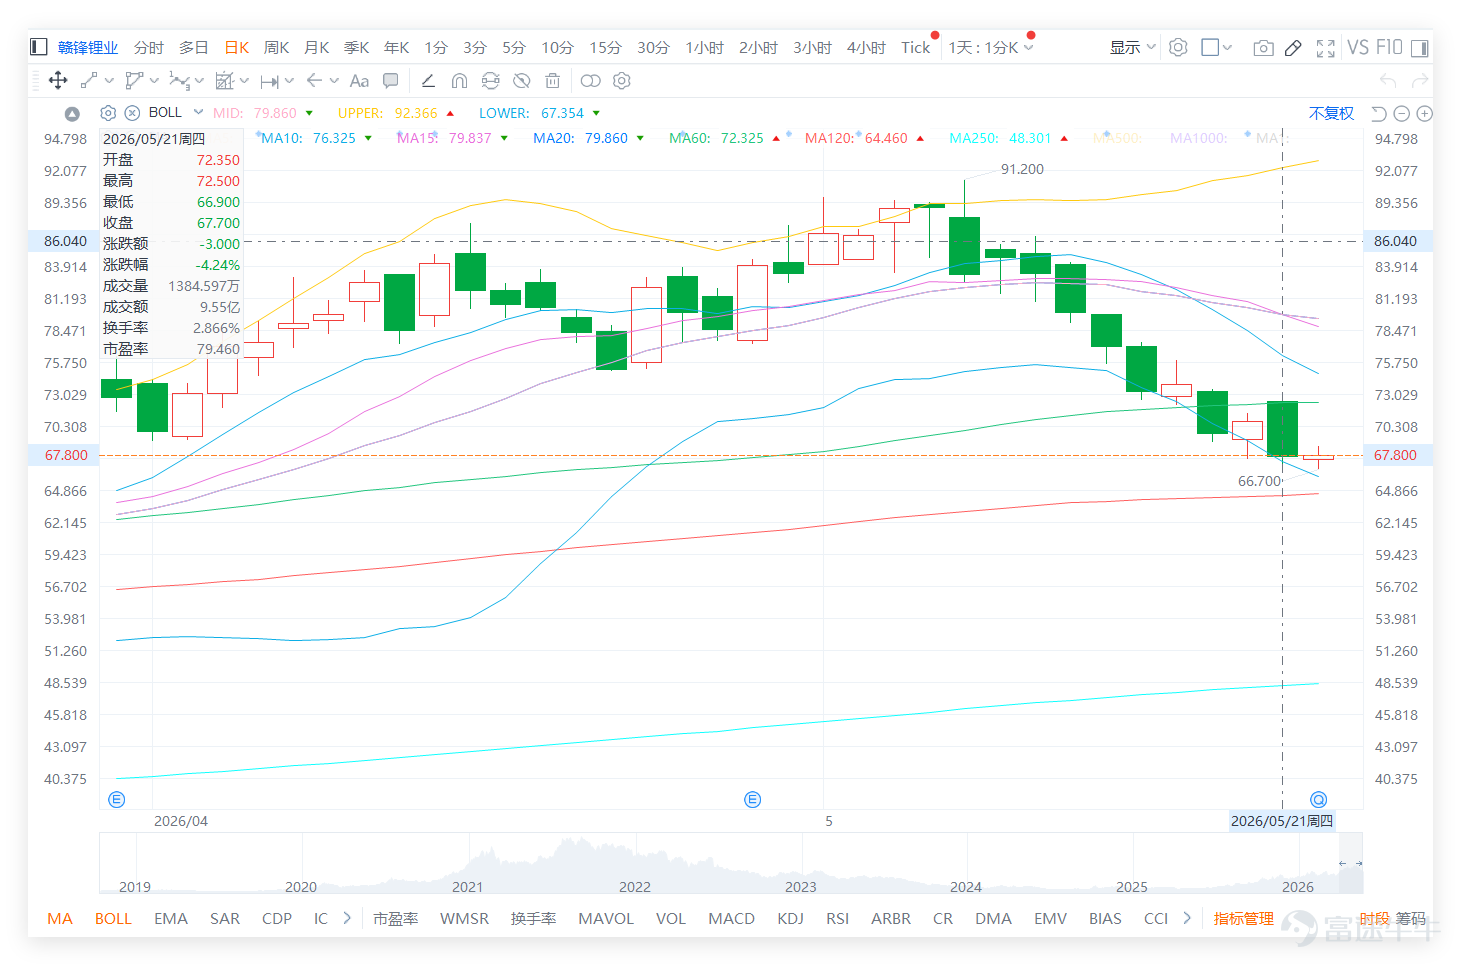
$GANFENGLITHIUM (01772.HK)$ On the previous trading day (the 21st), it closed at 67.700 yuan, down 3.000 yuan or 4.24% for the day. The stock reached a high of 72.500 yuan and a low of 66.900 yuan, closing at just 67.700 yuan—clearly retreating significantly from its intraday high and ending near the session’s low. This indicates that the early or intraday rebound failed to hold, with selling pressure overhead still not fully absorbed. For short-term retail investors, the most important signal from yesterday wasn’t the 4.24% decline, but rather that the price briefly surged to 72.500 yuan yet ultimately failed to hold above 70 yuan, reflecting insufficient buying momentum and an unstable rebound.

Ganfeng Lithium (technical signal: 'Buy' due to oversold recovery). Compared with leading peers in the lithium sector, $TIANQI LITHIUM (09696.HK)$ Closed at approximately HK$64.00 (RSI around 78, technically strong). This indicatesdivergent price movements within the lithium sector, with Tianqi Lithium in a strong rebound zone, while Ganfeng Lithium remains constrained by a dense cluster of moving averages, showing notably weaker short-term recovery strength compared to peers.

Technically, Ganfeng Lithium’s previous closing price remained below the 10-day moving average at HK$76.325, the 20-day MA at HK$79.860, and the 30-day MA at HK$79.993. All three key short-term moving averages sit above the current share price, indicating continued short-term weakness. This structure suggests that even if a rebound occurs, it will quickly encounter overhead resistance. The immediate critical level is HK$70.046—the short-term pivot point—followed by the previous day's high of HK$72.500, and then the 10-day MA at HK$76.325. In other words, for Ganfeng to meaningfully repair its technical outlook, a one-day rebound isn’t sufficient; it must first reclaim HK$70.046 and then challenge HK$72.500 to increase confirmation of a sustainable rebound.
Regarding Bollinger Bands, the middle band is at HK$79.860, the upper band at HK$92.366, and the lower band at HK$67.354. The stock closed at HK$67.700, very close to the lower Bollinger Band at HK$67.354, indicating an oversold short-term position and theoretically creating conditions for a technical rebound. If the price holds above HK$67.354 and HK$66.900, there remains potential for technical recovery from this low level; however, if HK$66.900 is breached, the downtrend may extend further, with support to watch near HK$63.
The Relative Strength Index (RSI) is approximately 19.875, reflecting a clearly oversold condition and insufficient short-term momentum. At this level, market sentiment often splits: some investors believe the stock has fallen enough and see a bounce as worth betting on, while others view the trend as broken and consider any rebound merely an exit opportunity. Technically, both views have merit. The low RSI does create short-term rebound potential, but the price remains below multiple key moving averages, and the rebound lacked volume confirmation—thus, a trend reversal cannot yet be confirmed prematurely.
From key comments, market sentiment toward Ganfeng Lithium is highly divided. Bulls are primarily focused on accumulating at lows, waiting for a rebound, hoping the price stabilizes above HK$70 or HK$72, and believing that negative catalysts have been fully priced in, allowing room for a counterattack. Some investors mentioned support at HK$66, placed orders at HK$67, said they hadn’t finished building their base position at HK$68, or admitted entering impulsively at HK$69. Others hope the stock returns to HK$70, stabilizes above HK$72, or even targets HK$80. These comments reflect a segment of retail investors who believe the stock has corrected significantly from its highs and, given its proximity to the lower Bollinger Band, may offer short-term rebound potential.
Bearish comments, meanwhile, emphasize the ongoing downtrend, lack of credible rebounds, capital outflows, untested or unsustainable support near HK$66, and potential declines toward HK$60 or lower. Some investors argue the stock is already in a bearish pattern with no buy signals; others note that rebounds so far lack credibility unless support emerges near HK$66; still others fear a freefall if HK$69 breaks. These views align somewhat with the technical structure, as the price remains below key short-term moving averages and yesterday’s rebound failed to hold its gains. As long as HK$70.046 isn’t reclaimed convincingly, bears and cautious observers retain strong justification for staying defensive.
Neutral and emotional comments reveal significant pressure among existing holders. Some ask whether they should cut losses and exit, others mention 30% drawdowns accompanied by pain and frustration, and some wonder if the stock will ever reach HK$80 again or why it keeps falling. These remarks show the market has shifted from simply anticipating rebounds to intensely focusing on risk management. After the substantial pullback from recent highs, many holders aren’t just asking if a rebound will happen—they’re asking whether it will be strong enough to reduce their losses. In this emotional climate, technical levels become even more critical, because relying solely on hope for a rebound can easily leave investors exposed if key supports break down.
Common questions can be grouped into three.
First, has Ganfeng Lithium already bottomed? Currently, we can only say the price is nearing the lower Bollinger Band, creating short-term technical rebound conditions—but a confirmed bottom cannot yet be declared. This is because the price remains below key moving averages, yesterday’s rebound occurred on declining volume, and the price clearly retreated from its intraday high.
Second, is it a good entry point near RMB 66? The levels of RMB 66.900 and RMB 67.354 are indeed key short-term support zones. If the stock holds above these levels and shows signs of breaking back above RMB 70.046, the likelihood of a rebound from lower levels will increase. However, if RMB 66.900 is breached, the downtrend is likely to continue.
Third, can it rally back to RMB 80? Technically, RMB 80 is not the immediate target, as the price must first reclaim RMB 70.046, then break through RMB 72.500 and RMB 76.325 before it becomes feasible to consider the midline around RMB 79.860 and higher levels.
In terms of short-term strategy, the most critical task for Ganfeng Lithium right now is to hold above RMB 67.354 and RMB 66.900. This zone aligns with the lower Bollinger Band and yesterday’s low, forming a key short-term defensive line. If the stock stabilizes here and breaks back above RMB 70.046, the rebound could gain momentum. The next resistance levels to watch would be RMB 72.500 and RMB 76.325. RMB 72.500 was yesterday’s high; reclaiming it would signal weakening selling pressure at higher levels. RMB 76.325 corresponds to the 10-day moving average—recovering this level would significantly improve the short-term technical structure.
Conversely, if the stock breaks below RMB 66.900, yesterday’s rebound may be deemed a failure. Although the Relative Strength Index (RSI) is already quite low—meaning shorting after a breakdown may not be risk-free—for existing long positions, such a breach would signal escalating risk. In that scenario, support near RMB 63 would become the next focus. If the price further breaches the RMB 63 area, the downtrend would deepen, and market discussion about a potential test of RMB 60 would intensify. However, at this stage, the most immediate judgment remains whether RMB 66.900 can hold—traders should avoid jumping ahead to more distant targets prematurely.
Overall, Ganfeng Lithium declined from a high of RMB 72.500 to close at RMB 67.700, accompanied by declining volume, reflecting insufficient buying interest during the rebound. Among market comments, bulls hope the RMB 66–68 range will serve as a solid support zone, allowing a move back toward RMB 70, RMB 72, or even RMB 80. Bears argue the stock remains in a downtrend, with RMB 66 not yet confirmed as support—and a breakdown could lead toward RMB 60. Observers are primarily concerned about whether to cut losses, add to positions, or if a bottom has formed. Technically, the answer is relatively clear: RMB 67.354 and RMB 66.900 form the short-term defensive line, while RMB 70.046 is the make-or-break level for the rebound. Until the price breaks above RMB 70.046, Ganfeng remains in a weak rebound phase; if RMB 66.900 is lost, short-term weakness will re-intensify.
Latest Update (Morning of May 22):
Ganfeng Lithium is currently trading at RMB 67.85, up 0.48% for the day. It remains oscillating above the RMB 66.90 support line but has yet to reclaim the key resistance at RMB 70.046. Short-term direction will depend on whether the price breaks out of the RMB 66.90–70.00 range.
Reply to some investors' views:
@231328112RMB 60 is a relatively low level. For now, focus first on the areas near RMB 66.900 and RMB 63. Only if RMB 66.900 is breached would we look lower.
@31834460After the pullback from recent highs, I’ve taken an initial position as a trial trade. Short-term safety depends on holding above RMB 66.900 and reclaiming RMB 70.046.
@111錦鯉111For a reversal to occur, the price must at least return above RMB 70.046. Until that happens, it can only be considered a low-level bounce.
Based on the above analysis, the strategies for deployment can be divided into the following main approaches:

For more market analysis, stay tuned to Jenny's daily updates on 'Hong Kong Stock Warrants'!
Reminder: This article does not constitute any investment advice.
This article is for reference only and does not constitute any investment advice. Market data, opinions, and analysis contained herein may change at any time without prior notice. We are not responsible for any loss or damage caused by reliance on the information in this article. Technical analysis only shows whether certain technical conditions are met; asset performance should be comprehensively evaluated using other sources of information, and trading decisions should not be made solely based on this article. Please note that past performance is not indicative of future results.
#HongKongStocks #GanfengLithium #RealTimeAnalysis #WarrantPicks #WarrantStrategy #DerivativesHedging #HKStocksWarrantsJenny #BlueChipStocks #TechnicalAnalysis
Risk Disclaimer: The above content only represents the author's view. It does not represent any position or investment advice of Futu. Futu makes no representation or warranty.Read more
Comments
to post a comment