華虹半導體升勢未壞但追價風險升溫,122.6元成重要防守位
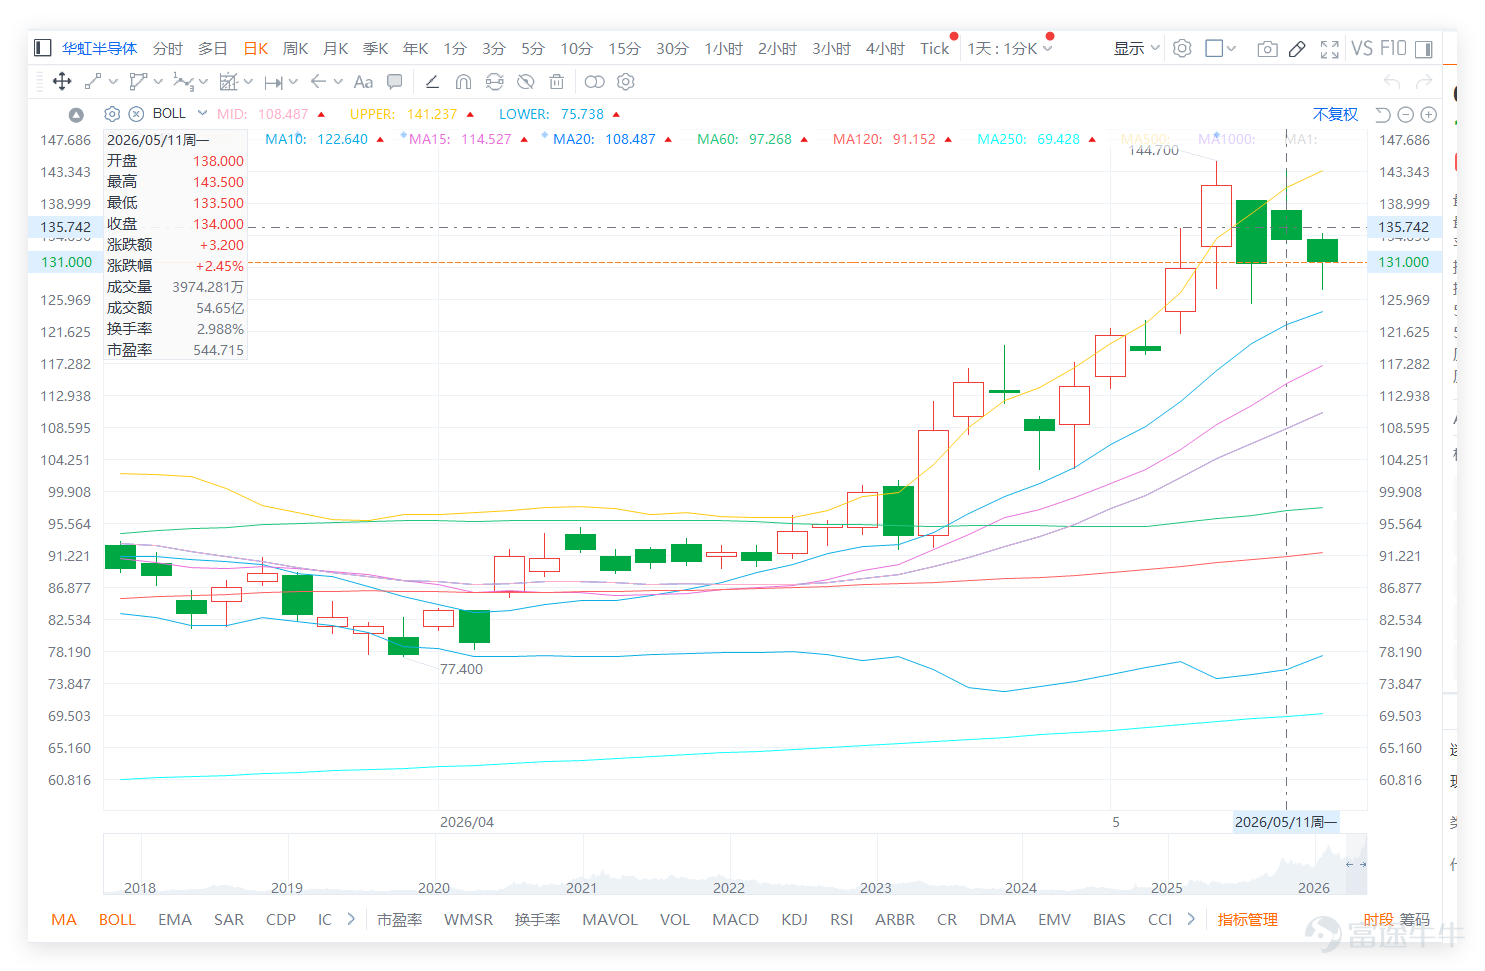
上日(11日)全日收報134.00,單日升約2.45%,短線仍屬強勢股,但已不再是低位剛起步,而是急升後進入高位消化階段。從日線結構看,股價仍明顯高於10日線約122.64、20日線約108.49及30日線約100.68,反映中短線升勢仍然完整。不過,近期股價曾高見144.70,上日雖然仍然上升,但收在134附近,距離高位已有一段回落,代表高位獲利盤開始出現。

華虹技術信號為「賣出」,RSI高達77,已進入極度超買區。對比半導體製造同業, $中芯國際 (00981.HK)$ 技術信號同樣為「賣出」,RSI約71,亦處於超買狀態。這意味著華虹的急升回落,並非個股獨立現象,而是整個港股半導體製造板塊(華虹、中芯)均處於「技術性超買」的高位震盪期。兩者均呈現「高位放量、RSI>70」的典型獲利回吐特徵,板塊聯動性極強。華虹能否守住134元,不僅取決於自身承接,也需觀察中芯國際是否會出現高位補跌,從而拖累板塊情緒。

技術上,134元是目前短線情緒位,也是上日收市附近位置。若股價能守在134附近並重新向上,代表高位消化後仍有資金承接;若跌穿134並持續轉弱,市場會開始測試下一級支持。下方第一重要支持在122.64,即10日線附近,這是目前升勢能否維持的關鍵防守位。只要不跌穿122.64,華虹仍屬強勢整理;若跌穿,則代表這一輪急升開始進入較深回調。更下方支持在108.49,即20日線附近。
上方阻力方面,141.24是保歷加通道上軌附近,144.70則是近期高位。換句話說,華虹若要重新打開升勢,首先要收復141.24,再挑戰144.70。只有重新升穿144.70,市場才有條件討論150元;若未能重上141至145區間,150及160仍只是投資者情緒目標,而不是已確認的技術目標。
相對強弱指數約77,仍屬偏強,但已接近偏熱區。這代表華虹仍有動能,但追價的安全邊際已明顯下降。這種圖形最容易出現兩種走法:一是高位消化一兩日後再破頂;二是未能反包,然後跌回10日線附近尋找支持。因此,現階段最重要的不是單純看升,而是看能否重新反包高位陰影。
投資者情緒明顯非常亢奮。看多留言中,有人把華虹與美光比較,認為可上200;亦有人在143買入,仍對股價有信心;也有人直接看150、160,甚至認為「有排升」。這反映市場已經把華虹視為半導體強勢股,而不是普通反彈股。近期半導體板塊氣氛強,加上市場對AI、晶片、國產替代相關概念重新定價,確實為華虹提供了題材支持。
不過,這種亢奮亦帶來明顯風險。當大量留言集中在150、160甚至200,代表市場已經開始用情緒目標推動交易,而不是只看現有技術位置。華虹現價134,距離144.70高位仍有約10元空間,若未能先收復高位,直接討論150或160會太早。強勢股可以繼續強,但越接近高位,越需要成交及承接確認。
看空留言則集中在三個方向:
第一,是認為股價可能回落至110;
第二,是擔心財報有雷;
第三,是短線想沽空或買Put。
這類聲音說明市場並非單邊看好,高位已開始吸引空方進場。尤其當股價升幅大、RSI偏高,短線空方會更願意在高位嘗試反手。若華虹無法快速收復141至145區間,這批空方會更有信心壓低股價。
觀望留言最值得重視。有人問「升咁高點追」,有人說「上日唔反包就走」,也有人覺得「好似累咗」。這些聲音其實比單純看多或看空更貼近市場真實狀態。華虹不是沒有人想買,而是很多人開始覺得位置太高;不是完全轉弱,而是升勢需要休息。這種心理會令股價在134至145之間大幅波動,追高者容易被震走,低位持貨者則會考慮是否先鎖定利潤。
「上日唔反包就走」這句尤其關鍵。對急升股而言,反包能力就是資金強弱的測試。如果次日或短期內能重新收復141.24,代表高位回吐後買盤仍強;如果持續低於134至141區間,則說明市場開始接受高位震盪甚至回調。
短線策略上,華虹半導體應以122.64作強弱防守位,以141.24及144.70作反攻確認位。守住122.64,升勢仍未破壞;重新升穿141.24,代表動能回復;突破144.70,才可再看150。若跌穿122.64,則要防止回試108.49,屆時短線強勢會明顯降溫。
總結一句,華虹半導體不是弱,而是升得快、情緒熱、位置高。看150至160可以有想像空間,但真正要確認強勢延續,必須先收復141.24及144.70;否則,134附近只是高位拉鋸,不是新一段升浪的起點。
回復部分投資者觀點:
針對上述格局,部署上可分為以下主要策略:

想獲取更多市場分析,請持續關注「港股窩輪Jenny」的每日更新!
溫馨提示:本文章不構成任何投資建議。
本文章僅供參考,並不構成任何投資建議。內容所載的市場數據、觀點與分析可能隨時變動,恕不另行通知。對於因依賴本文章資訊而導致的任何損失或損害,我們概不負責。技術分析僅顯示部分技術條件是否滿足,應結合其他資料全面評估資產表現,不應單憑本文作出交易決策。請注意,過往表現不代表未來結果。
#港股 #華虹半導體 #即時分析 #窩輪精選 #窩輪攻略 #衍生品避險 #港股窩輪Jenny #藍籌股 #技術分析
風險及免責聲明:以上內容僅代表作者個人觀點,不代表富途任何立場,亦不構成任何投資建議,富途對此不作任何保證與承諾。更多信息


評論
發表評論
6
1