
The S&P 500 has risen for seven consecutive weeks—should you chase the rally or take profits?
Surging Japanese and Korean stock markets leaving you unsure how to invest? Here's an ETF guide you'll want to keep handy.
If you've been following the global markets recently, you must have been impressed by the performance of the Japanese and Korean stock markets.
In Japan, on May 7, after a five-day holiday hiatus, Japanese stocks experienced a surge in a 'catch-up rally' (yes, Japan also has a Golden Week during May Day). $Nikkei 225 (.N225.JP)$ The index surged nearly 6% during the session, breaking through the 63,000-point level and hitting a new all-time high.
The semiconductor sector emerged as the absolute leader, $Advantest (6857.JP)$ rising nearly 7%, $Tokyo Electron (8035.JP)$ up 9%,domestic memory chip manufacturers $Kioxia Holdings (285A.JP)$It even hit a 20% price limit, far from the bleak scene of 'three lost decades'.
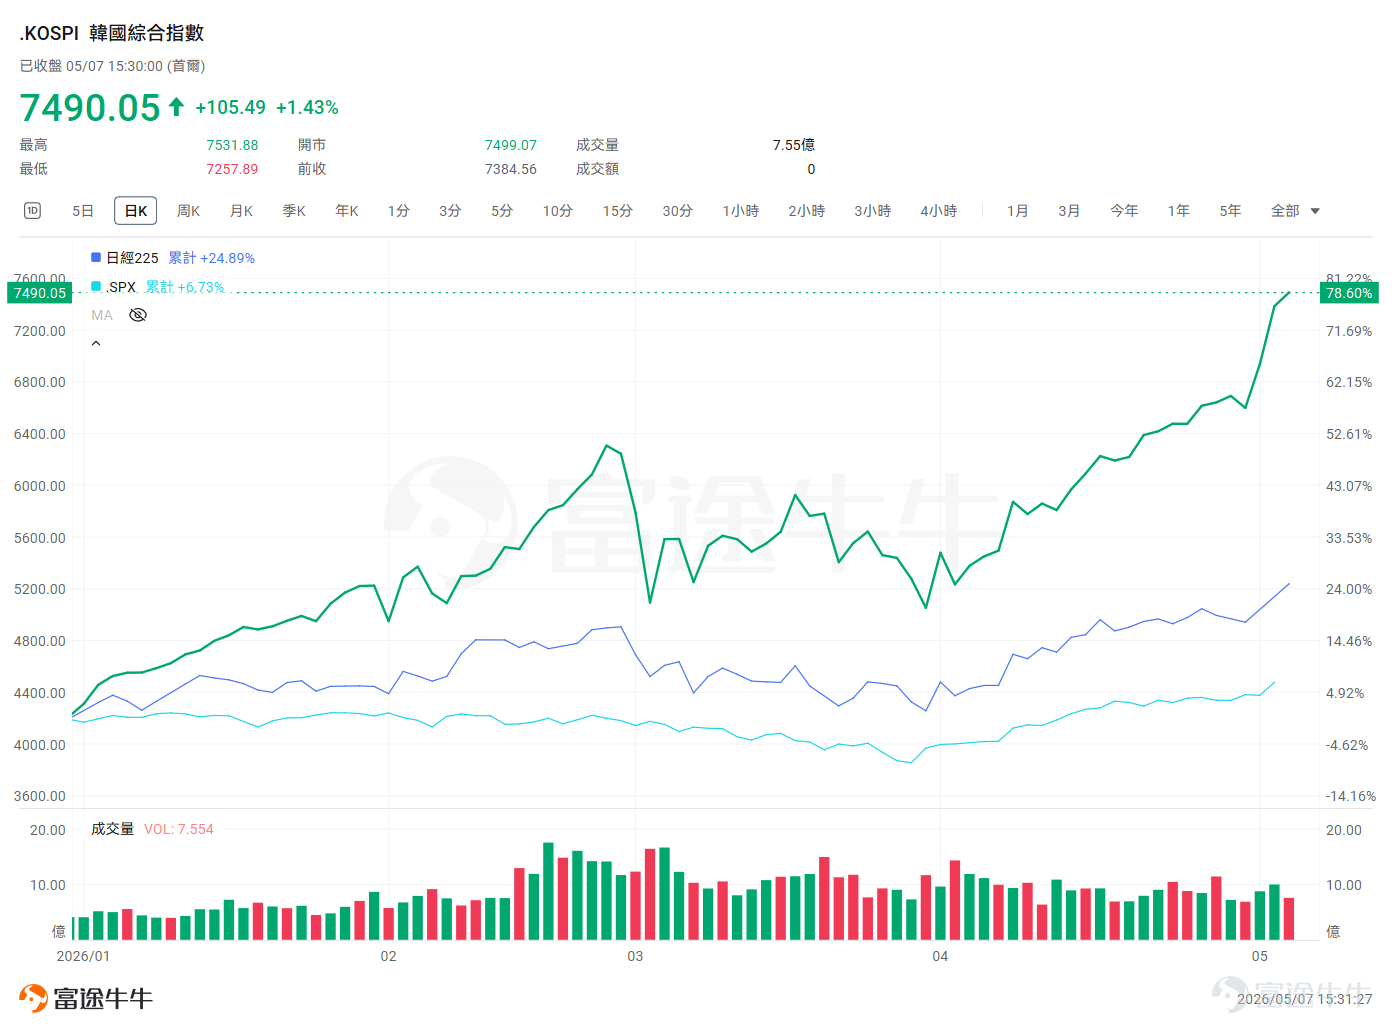
South Korea is even more fierce. On May 6th, $Korea Composite Index (.KOSPI.KR)$ it broke through the 7,000-point mark for the first time, with a single-day increase exceeding 6%. This came just about two months after the KOSPI first broke through 6,000 points on February 25.The index's year-to-date cumulative increase is already close to 80%, making it one of the most impressive major markets globally.The two storage giants account for over 40% of the weight in the KOSPI, directly driving the index to soar. Samsung Electronics' stock price reached 270,000 Korean won per share; SK Hynix's stock price hit a high of 1,665,000 Korean won per share, both doubling within the year.

Faced with such a market, many fellow investors may feel both envious and troubled: they want to get in, but how should they invest? Directly buying individual stocks in Japan and South Korea has high barriers, information asymmetry, and significant exchange rate fluctuation risks. Don't worry, we will guide you step by step through the logic behind the surge, currency hedging, leverage tools, and selection methods to help you understand Japan-Korea ETF investments.
Why are the Japanese and Korean stock markets continuously surging?
Japan: Starting with Buffett’s demonstration effect
Since Buffett heavily invested in Japan's five major trading companies in 2020, he has increased his holdings multiple times, publicly stating that he plans to 'hold long-term and never sell,' essentially issuing an invitation to global capital to confidently buy into Japan. Many institutional and individual investors have only begun to reassess the Japanese market in recent years under the influence of the Oracle of Omaha. Moreover, amid the AI wave, the rationale behind Japan's stock rise has further deepened.
Although Japan's semiconductor companies may not be as dazzling as their U.S. counterparts, their role in the supply chain cannot be overlooked, with many acting as hidden champions and holding key positions in the global AI computing power arms race. Leading semiconductor equipment companies like Tokyo Electron and Advantest have become core targets in Japan's stock market.
Even TOTO, globally recognized as the 'leading toilet manufacturer'$TOTO (5332.JP)$, has surged significantly since late last year due to its production of a key consumable in chip manufacturing—ceramic electrostatic chucks.

Under strong demands from regulators and investors, Japanese companies are actively promoting governance reforms, improving capital efficiency, addressing cross-shareholding issues, and enhancing shareholder returns. Both dividend payouts and stock buybacks have shown an upward trend.
South Korea: 'Structural Revaluation' Amid an AI Storage Super Cycle
The core driver of South Korea's stock market is the super cycle for AI storage chips.Strong demand from global tech giants building AI data centers has constrained supply, sharply driving up memory chip prices and giving rise to two 'giants'—Samsung Electronics and SK Hynix.
Samsung Electronics’ Q1 2026 financial report showed that its semiconductor division generated revenue of 81.7 trillion Korean won, with an operating profit of 57.2 trillion Korean won, a staggering year-on-year increase of 756%. The first-quarter profit already surpassed the total for the entire fiscal year of 2025. SK Hynix also reported record-breaking quarterly profits, with Q1 net income reaching 40.33 trillion Korean won, far exceeding expectations.
The market is forming a critical judgment: the role of memory chips in AI infrastructure has shifted from being 'cyclical' to becoming a 'structural' demand.。This implies that the demand will not disappear with short-term fluctuations but has become a long-term necessity in the AI era. However, it is worth noting that Samsung and SK Hynix hold overly concentrated weights in the index, meaning any minor changes could trigger significant volatility in the index.
The surge in South Korea’s stock market has also led to a record influx of foreign capital. On May 6, foreign investors made a net purchase of 3.13 trillion Korean won worth of South Korean stocks, marking the largest single-day inflow ever recorded.The best reflection of investor enthusiasm is the $CSOP Samsung Electronics Daily (2x) Leveraged Product (07747.HK)$and $CSOP SK Hynix Daily (2x) Leveraged Product (07709.HK)$— the latter saw nearly $16 billion in inflows in the first quarter, surpassing similar products from Tesla and Microsoft to become the world's most lucrative single-stock leveraged ETF during the same period.
Moreover, Japan and South Korea are among the economies most reliant on imported energy globally.This week’s major breakthrough in the US-Iran ceasefire talks represents significant cost savings for Japan and South Korea—every $10 drop per barrel in oil prices translates into tens of billions in reduced costs, directly boosting corporate profits and improving trade balances. This has also been a shared catalyst for the recent simultaneous rallies in both markets.
EWJ vs HEWJ: The Essential Concept of 'Currency Hedging'
When investing in the Japanese stock market, one unavoidable issue is currency risk.The yen has experienced significant depreciation in recent years. If you directly purchase Japanese assets denominated in yen, even if the stock price rises, the returns may be significantly eroded by yen depreciation when converted back to your home currency.

Why has the yen continued to depreciate? The core reason is actually quite straightforward.The most direct driver is the interest rate differential—the Bank of Japan has raised rates to 0.75% (the highest in 30 years), but this remains extremely low compared to economies like the US. Capital naturally flows from low-interest-rate Japan to higher-interest-rate markets. With inflation rising in Japan, the real interest rate (nominal interest rate minus inflation) remains negative, meaning holding yen-denominated assets effectively results in losses, further reducing demand for the yen.
To make matters worse, the fiscal expansion under the Koike administration has heightened market concerns. An economic stimulus plan exceeding 21 trillion yen, along with proposals to cut consumption taxes without clear funding sources, has triggered a sell-off in government bonds and raised worries about debt sustainability, further undermining support for the yen.However, the Japanese government has taken notice of the continuously falling exchange rate and recently carried out foreign exchange intervention. USDJPY once dropped from 160 to around 155.
Let’s use EWJ and HEWJ as examples. Both track the MSCI Japan Index and cover exactly the same stocks. The only difference is that HEWJ hedges against the dollar-yen exchange rate, while EWJ does not.
When you buy Japanese stocks with US dollars, your returns are influenced by two factors: the rise or fall of the Japanese stocks themselves and the movement of the yen-dollar exchange rate.
$iShares MSCI Japan ETF (EWJ.US)$(Non-hedged): Your return = Japanese stock performance + yen exchange rate fluctuation. If Japanese stocks rise by 10% but the yen depreciates by 8%, you effectively only gain about 2%.
$iShares Currency Hedged MSCI Japan ETF (HEWJ.US)$(Hedged): By locking in the exchange rate through financial derivatives, your return ≈ Japanese stock performance. Regardless of how the yen fluctuates, the exchange rate factor is neutralized.
Historical data shows that during periods of sustained yen depreciation, HEWJ's returns significantly outperformed EWJ. Due to the additional currency hedging feature, HEWJ's fee is slightly higher than EWJ's (0.53% vs. 0.49%).

If you believe the yen will continue to depreciate, thenHEWJis a better choice as you benefit purely from the rise in Japanese stocks without bearing exchange rate losses; if you think the yen has bottomed out and may appreciate in the future, thenEWJis more suitable, allowing you to earn dual returns from 'stock price increases + currency appreciation'.
EWY vs KORU: The Hidden Cost of Decay
Turning to the Korean market, the two most common ETFs areEWYandKORU, both tracking the MSCI Korea Index but with completely different characteristics.
$iShares MSCI South Korea ETF (EWY.US)$: A standard 1x ETF, where if the MSCI Korea rises by 1%, it rises by approximately 1%.
$Direxion Daily MSCI South Korea Bull 3X ETF (KORU.US)$: A 3x leveraged ETF, where if the MSCI Korea rises by 1%, it rises by approximately 3%. Conversely, if the index falls by 1%, it falls by 3%.
Leveraged ETFs amplify daily index returns through financial derivatives such as futures and swap contracts. Take KORU as an example; its objective is to achieve three times the daily return of the MSCI Korea Index.
The keyword here is 'daily.' Leveraged ETFs rebalance at the end of each trading day—adjusting their holdings to ensure they maintain a 3x leverage ratio at the start of the next trading day. This mechanism leads to an important characteristic:The cumulative returns from long-term holding do not equal three times the cumulative increase of the index.

Assume the index performs over two consecutive days as follows: a 10% increase on the first day, followed by a 10% decrease on the second day.
EWY: 100 → 110 → 99 (actual loss of 1%)
KORU (3x): 100 → 130 → 91 (actual loss of 9%)
While the index only lost 1%, the 3x leveraged ETF lost 9%. This is known as 'volatility decay'—even if your long-term directional view is correct, excessive intermediate fluctuations can still result in losses for leveraged ETFs.
For the vast majority of investors, EWY is the more prudent choice.It has moderate volatility, lower fees, and is suitable for medium- to long-term holding, allowing you to fully benefit from the growth dividends of the Korean index.
KORU is better suited for traders with a clear short-term market outlook. For example, if you believe that the Korean stock market will experience a surge due to a specific catalyst (such as Samsung's earnings report) in the coming days, you can use KORU to amplify your returns. However, always remember: the longer you hold it, the greater the volatility decay. It is absolutely not advisable to blindly hold leveraged ETFs for the long term.
Easily find Japan-Korea ETFs on Futubull!
After understanding the product, the final step is to locate them. The biggest hurdle for cross-border investment isn't capital, but rather "not knowing what to buy or where to find it."The good news is that Futubull has already compiled Japan-Korea related ETFs, and you only need to follow three steps:
Path: Market > ETF > Thematic ETF

Whether it's the few ETFs we mentioned above or other products tracking the Japan-Korea market, they can all be browsed, compared, and traded here in one stop.
This round of surging in the Japan-Korea stock markets essentially reflects a revaluation of the global AI industry wave within the Asia-Pacific region.Japan holds an upstream position with semiconductor equipment and materials, while Korea acts as the "AI enabler" through memory chips, both standing at the forefront of this era. However, it’s important to note that risks may be lurking behind the celebration. Repeated tensions in the Middle East, shifts in Federal Reserve policies, or a cooling of AI demand could all lead to significant market volatility. Staying rational and managing positions effectively will ensure gains are secured.
Risk Disclaimer: The above content only represents the author's view. It does not represent any position or investment advice of Futu. Futu makes no representation or warranty.Read more


Comments (217)
to post a comment
371
434