Zijin Mining's pullback gains 'buy' support, with short-term focus on the support at 34 yuan and resistance at 36.2 yuan
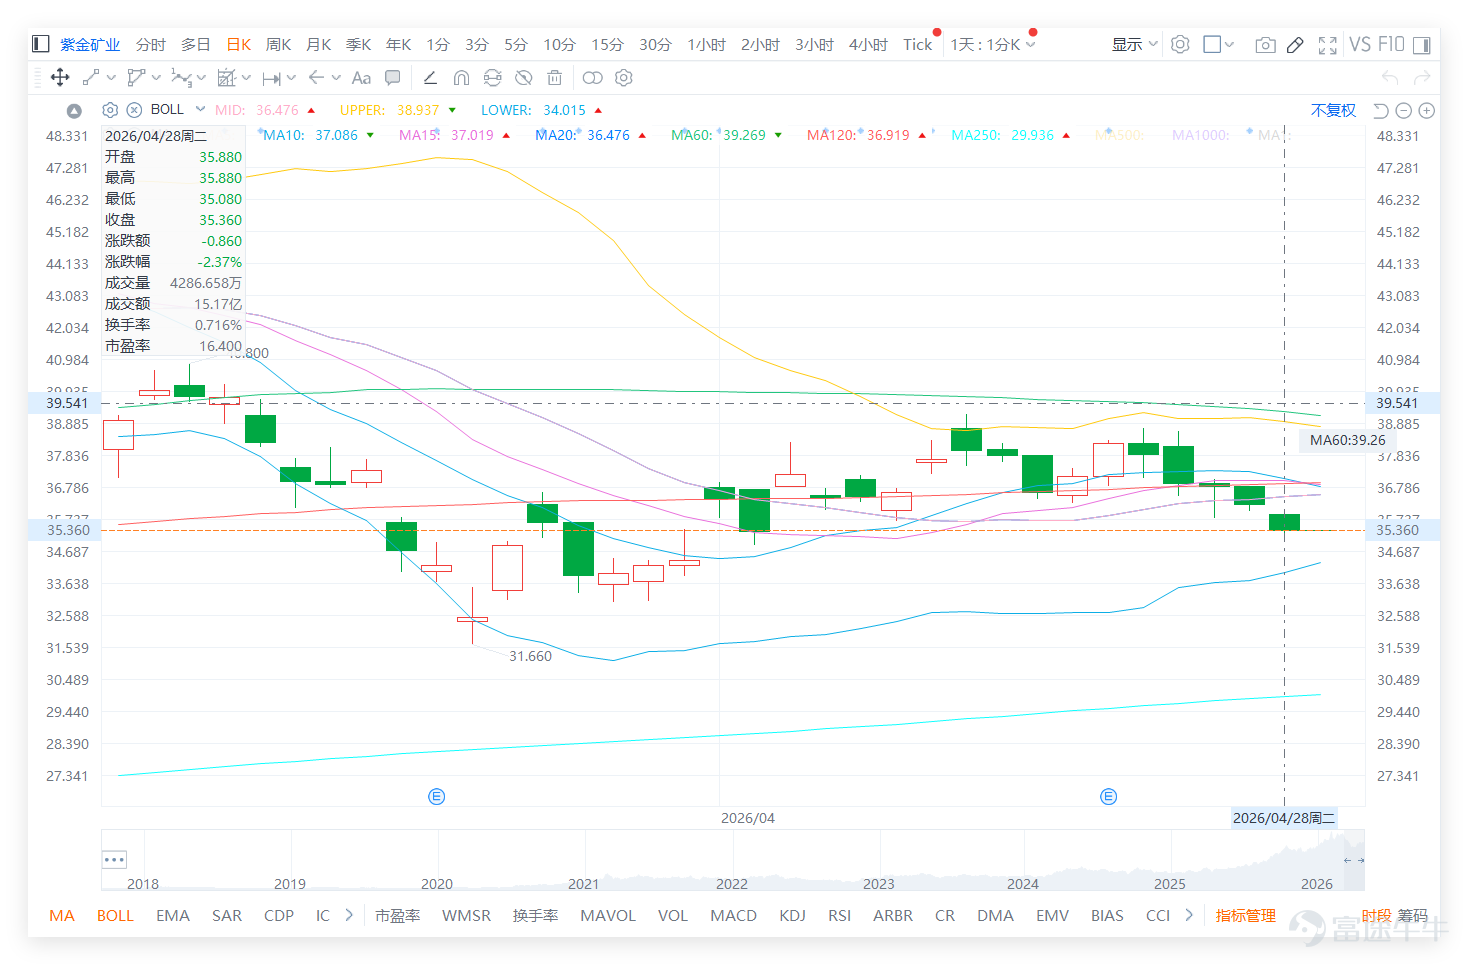
The closing price on the previous day (August 28) was HKD 35.36, with a single-day drop of 2.37%.

Looking at the mining and resources sector, Zijin Mining's technical indicators show a 'buy' signal. Meanwhile,$CHIFENG GOLD (06693.HK)$ 、 $CHINAHONGQIAO (01378.HK)$ 、 $CMOC (03993.HK)$ 、 $JIANGXI COPPER (00358.HK)$ the technical signal is also 'buy', with only $CHALCO (02600.HK)$ being 'neutral'.
This indicates that Zijin's pullback consolidation is occurring in an environment where the sector’s overall technical picture remains generally bullish with positive system ratings. The divergence between its 'buy' signal and weaker stock price typically signals underlying support for a technical rebound. Investors' focus on 'support around 34 yuan' corroborates with the technical 'buy' signal, suggesting this area may become a key battleground for bulls and bears. However, confirmation of a rebound will still require the stock price to regain critical moving averages (such as 36.161 yuan).

Sentiment in Zijin Mining's comment section leans negative, with market attention focused on three points:
First, when will the stock price return near 39 yuan;
The second point is whether it’s a good entry point at 34 yuan;
The third point is whether the short-term volatility has already completed.
Overall, investors still anticipate the next upward wave, but there is a noticeable increase in short-term disappointment.
Many comments mentioned phrases like 'the more you buy, the more it falls,' 'daily hope leading to daily disappointment,' and 'weak trend,' reflecting market dissatisfaction with short-term performance. However, some investors believe that around 34 yuan offers support value and could even be considered a good buying opportunity, indicating that the market isn’t entirely bearish but rather waiting for clearer support levels.
Technically, Zijin Mining's closing price yesterday was 35.360, below the 5-day, 10-day, 20-day, and 30-day moving averages, showing weakening short-term rebound momentum. The 35.360 level is still above the lower Bollinger Band at 34.015, but until it can retest the range of 36.161 to 36.476, the stock remains in a pullback consolidation phase. The Relative Strength Index (RSI) stands at 30.113, indicating weak short-term momentum, though it is near a low point without confirmation of a rebound.
For short-term strategy, 36.161 is the key turning point. If it can break back above 36.161 to 36.476, there may be an opportunity to retest 38.937, after which 39.2 can be reconsidered. Conversely, if it breaks below 34.015, further downside towards 31.660 should be watched. At this stage, risk-reward is moderately low, making it more suitable to wait and see if the 34 yuan level holds before deciding on potential rebound conditions.
Reply to some investors' views:
@大家有錢賺 Every day is full of hope, but every day ends in disappointment
Until it moves back above 36.161, the strength of the rebound remains insufficient.
@不识曲中意矣 The recent trend has been too weak. When will a clear trend emerge?
The key to establishing a new trend is breaking above 36.476 and holding steady.
@231035150 How low can it drop before it’s a good time to buy?
34.015 is the first observation level; only if it holds will there be conditions for a low-risk entry.
Based on the above analysis, the strategies for deployment can be divided into the following main approaches:


For more market analysis, stay tuned to Jenny's daily updates on 'Hong Kong Stock Warrants'!
Reminder: This article does not constitute any investment advice.
This article is for reference only and does not constitute any investment advice. The market data, opinions, and analysis contained herein may change at any time without prior notice. We are not responsible for any loss or damage caused by reliance on the information in this article. Technical analysis only shows whether certain technical conditions are met; a comprehensive assessment of asset performance should be conducted using additional data. Decisions to trade should not be based solely on this article. Please note that past performance is not indicative of future results.
#HKStocks #ZijinMining #Real-TimeAnalysis #WarrantPick #WarrantGuide #DerivativesHedging #HKWarrantsJenny #Blue-ChipStocks #TechnicalAnalysis
Risk Disclaimer: The above content only represents the author's view. It does not represent any position or investment advice of Futu. Futu makes no representation or warranty.Read more

Comment (1)
to post a comment
4