Baidu's rebound has faced setbacks, with increasing pressure for a pullback; focus on the support level at 116 yuan.
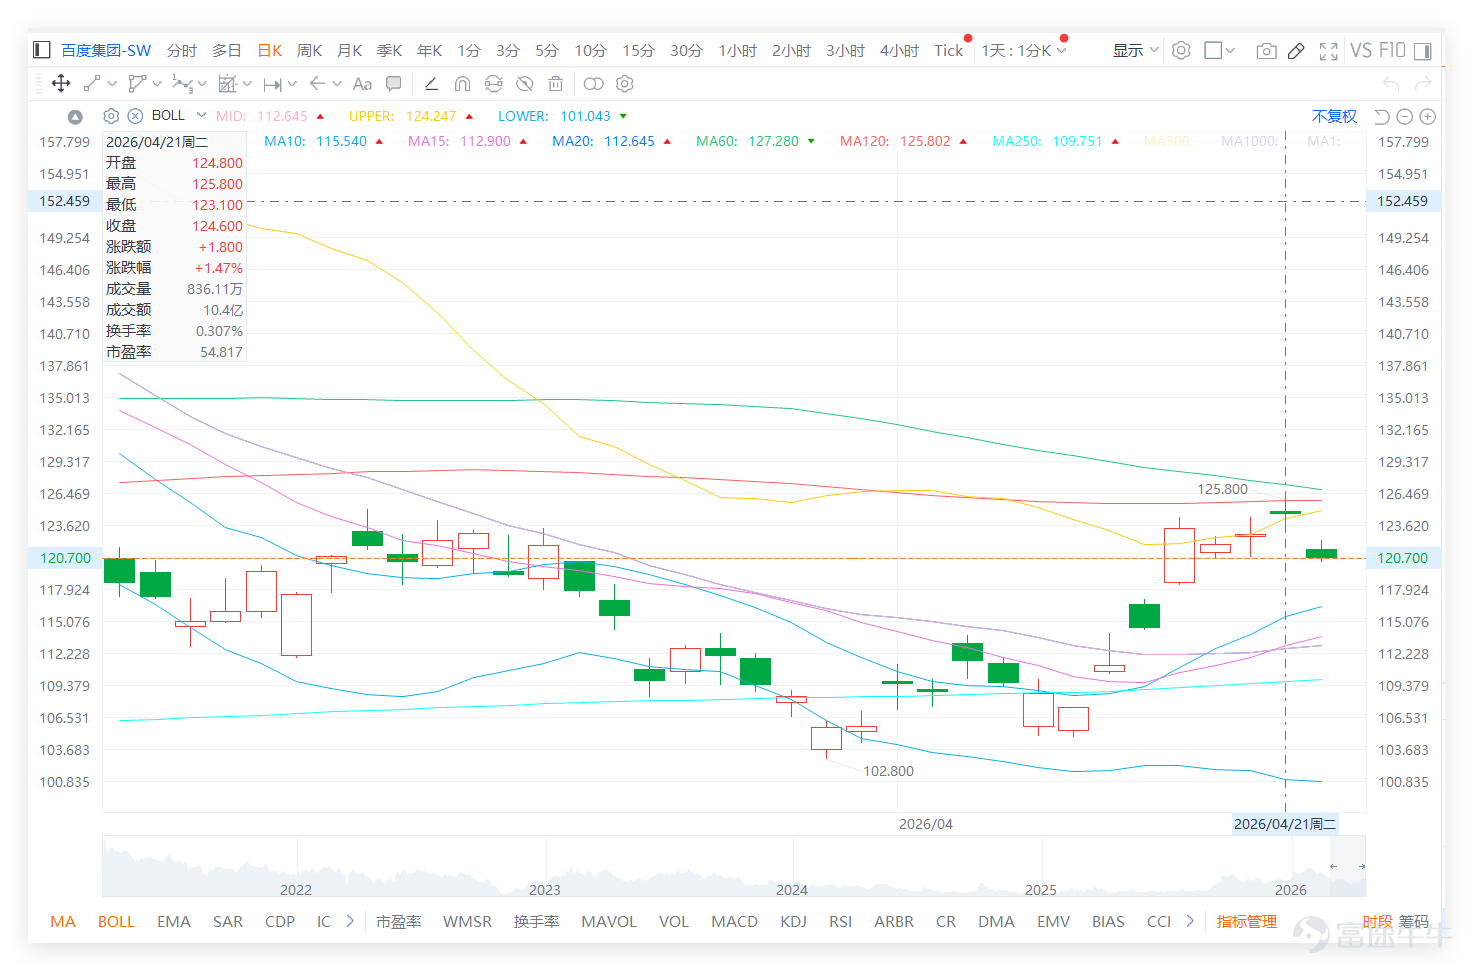
The recent trend has significantly improved, with the stock price continuing to recover after bouncing back from a low of 102.8. On the previous day (the 21st), it closed at 124.6, surpassing multiple short-term moving averages, indicating a clear strengthening in the short term structure. The closing price on that day was close to the resistance zone between 124 and 125 yuan, while also nearing the upper Bollinger Band, reflecting that the uptrend is continuing. However, this also suggests that the stock price has reached a relatively high position, and further upward movement in the short term will require stronger momentum.
![$BIDU-SW (09888.HK)$ The recent trend has significantly improved, with the stock price continuing to recover after bouncing back from a low of 102.8. On the previous day (the 21st), it closed at 124.6, surpassing multiple short-term moving averages, indicating a clear strengthening in the short term structure. The closing price on that day was close to the resistance zone between 124 and 125 yuan, while also nearing the upper Bollinger Band, reflecting that the uptrend is continuing. However, this also suggests that the stock price has reached a relatively high position, and further upward movement in the short term will require stronger momentum. [Share Link: April 21 [Hong Kong Stock Podcast] Part-1 Hang Seng Index, Mixue Ice City, Baidu] $MIXUE GROUP (02097.HK)$ Looking at the large technology and internet sectors, the market showed a mixed performance on the previous day (the 21st), with Baidu rising by 1.47%, $MEITUAN-W (03690.HK)$Up 1.53%, while$BABA-W (09988.HK)$ 、 $TENCENT (00700.HK)$ 、 $NTES-S (09999.HK)$) all recorded declines. Technical signals diverged: Baidu’s RSI reached 63 (entering overbought territory), and although its technical rating is "neutral," it carries a "strong sell" signal, indicating strong rebound momentum but also elevated pullback risks. Notably, Alibaba and Tencent’s technical signals are both "sell," with both showing signs of being overbought. This indicates that Baidu’s strengthening upward movement is not an isolated case but part of a broader sector rebound followed by widespread profit-taking...](https://nnqimage.futunn.com/sns_client_feed/1162342/20260422/web-1776825980195-QLqpIKugoR.png/big?area=1&is_public=true&imageMogr2/ignore-error/1/format/webp)
Looking at the large technology and internet sectors, the market showed a mixed performance on the previous day (the 21st), with Baidu rising by 1.47%, $MEITUAN-W (03690.HK)$Up 1.53%, while$BABA-W (09988.HK)$ 、 $TENCENT (00700.HK)$ 、 $NTES-S (09999.HK)$ ) have all recorded declines. Technical signals are mixed: Baidu’s RSI reached 63 (entering overbought territory), and despite a “neutral” technical rating, it carries a “strong sell” signal, indicating strong rebound momentum but high pullback risks. Notably, Alibaba and Tencent’s technical signals both indicate “sell,” with warnings of overbought conditions.
![$BIDU-SW (09888.HK)$ The recent trend has significantly improved, with the stock price continuing to recover after bouncing back from a low of 102.8. On the previous day (the 21st), it closed at 124.6, surpassing multiple short-term moving averages, indicating a clear strengthening in the short term structure. The closing price on that day was close to the resistance zone between 124 and 125 yuan, while also nearing the upper Bollinger Band, reflecting that the uptrend is continuing. However, this also suggests that the stock price has reached a relatively high position, and further upward movement in the short term will require stronger momentum. [Share Link: April 21 [Hong Kong Stock Podcast] Part-1 Hang Seng Index, Mixue Ice City, Baidu] $MIXUE GROUP (02097.HK)$ Looking at the large technology and internet sectors, the market showed a mixed performance on the previous day (the 21st), with Baidu rising by 1.47%, $MEITUAN-W (03690.HK)$Up 1.53%, while$BABA-W (09988.HK)$ 、 $TENCENT (00700.HK)$ 、 $NTES-S (09999.HK)$) all recorded declines. Technical signals diverged: Baidu’s RSI reached 63 (entering overbought territory), and although its technical rating is "neutral," it carries a "strong sell" signal, indicating strong rebound momentum but also elevated pullback risks. Notably, Alibaba and Tencent’s technical signals are both "sell," with both showing signs of being overbought. This indicates that Baidu’s strengthening upward movement is not an isolated case but part of a broader sector rebound followed by widespread profit-taking...](https://nnqimage.futunn.com/sns_client_feed/1162342/20260422/web-1776825969648-nIziVrXcQa.png/big?area=1&is_public=true&imageMogr2/ignore-error/1/format/webp)
This suggests that Baidu's strengthening upward movement is not an isolated trend, but rather part of a broader sector rebound facing widespread profit-taking pressure. Whether it can break through the resistance level at 124.8 yuan depends not only on its own momentum but also on whether peers (especially Alibaba and Tencent, which are similarly oversold) can absorb technical selling pressure; otherwise, it could easily be dragged down by sector-wide pullbacks.
Market commentary shows that investor sentiment has clearly turned optimistic, with attention focused on whether the stock price is breaking out and whether there will be opportunities to challenge higher levels afterward. Some investors still expect medium-term potential for Baidu, while others are starting to pay attention to the possibility of a breakout with increased volume, reflecting that market confidence has shifted from previous观望 (wait-and-see) to anticipation of further upside. However, this rise in sentiment often indicates that the stock price is no longer in the low range but entering a phase where confirmation of a breakout is needed.
The most common questions in the market revolve around several key areas: whether the current price has confirmed a reversal, whether 123 yuan can hold steady, whether 124.8 can be broken through, and whether there’s short-term potential to test 128 yuan. These questions point to one core issue: although Baidu's trend has strengthened, resistance is right ahead, and investors are more focused on whether this rebound will evolve from technical recovery into a new upward wave.
Technically, today (the 22nd), the latest price of 120.6 yuan has fallen below the short-term critical level of 123.1 yuan, signaling that the rebound structure has been compromised and short-term upward momentum has paused. Based on key support data at the current price, 116 yuan becomes the first major support level, marking the bottom of the previous consolidation zone and a crucial defense line for bulls. If the price can stabilize here with increased volume, the rebound may continue. If it breaks below further, the next support to watch is 110.4 yuan, a stronger historical support level coinciding with multiple mid-term moving averages and previous lows, carrying significant technical importance.
Overall, Baidu’s current risk-reward ratio is moderately low, as the current price has deviated from the strong zone. The future trend depends on whether support can be found and maintained within the 116 to 110.4 yuan range. For existing holders, it’s recommended to monitor the 116-yuan level, considering reducing positions to lock in profits if it fails to hold. For those not yet invested, it’s advisable to wait for the stock price to stabilize and break back above 123.1 yuan before reassessing, avoiding premature bottom-fishing. Short-term resistance remains focused on 124.8 yuan; if it cannot break through, the stock will likely consolidate between 110.4 and 124.8 yuan instead of directly surging to new highs.
Reply to some investors' views:
@王牌大贱谍 Such themes could boost market imagination regarding Baidu, but technically, the focus remains on whether the immediate resistance can be broken.
@真实的吼哈 The current trend is indeed strengthening, but the closer it gets to the resistance zone, the greater the potential volatility may become.
@AnotherTrade Intraday highs help boost sentiment, but the real key is whether a sustainable breakout can be achieved.
Based on the above analysis, the strategies for deployment can be divided into the following main approaches:
![$BIDU-SW (09888.HK)$ The recent trend has significantly improved, with the stock price continuing to recover after bouncing back from a low of 102.8. On the previous day (the 21st), it closed at 124.6, surpassing multiple short-term moving averages, indicating a clear strengthening in the short term structure. The closing price on that day was close to the resistance zone between 124 and 125 yuan, while also nearing the upper Bollinger Band, reflecting that the uptrend is continuing. However, this also suggests that the stock price has reached a relatively high position, and further upward movement in the short term will require stronger momentum. [Share Link: April 21 [Hong Kong Stock Podcast] Part-1 Hang Seng Index, Mixue Ice City, Baidu] $MIXUE GROUP (02097.HK)$ Looking at the large technology and internet sectors, the market showed a mixed performance on the previous day (the 21st), with Baidu rising by 1.47%, $MEITUAN-W (03690.HK)$Up 1.53%, while$BABA-W (09988.HK)$ 、 $TENCENT (00700.HK)$ 、 $NTES-S (09999.HK)$) all recorded declines. Technical signals diverged: Baidu’s RSI reached 63 (entering overbought territory), and although its technical rating is "neutral," it carries a "strong sell" signal, indicating strong rebound momentum but also elevated pullback risks. Notably, Alibaba and Tencent’s technical signals are both "sell," with both showing signs of being overbought. This indicates that Baidu’s strengthening upward movement is not an isolated case but part of a broader sector rebound followed by widespread profit-taking...](https://nnqimage.futunn.com/sns_client_feed/1162342/20260422/web-1776826061722-6wavEktom5.png/big?area=1&is_public=true&imageMogr2/ignore-error/1/format/webp)
![$BIDU-SW (09888.HK)$ The recent trend has significantly improved, with the stock price continuing to recover after bouncing back from a low of 102.8. On the previous day (the 21st), it closed at 124.6, surpassing multiple short-term moving averages, indicating a clear strengthening in the short term structure. The closing price on that day was close to the resistance zone between 124 and 125 yuan, while also nearing the upper Bollinger Band, reflecting that the uptrend is continuing. However, this also suggests that the stock price has reached a relatively high position, and further upward movement in the short term will require stronger momentum. [Share Link: April 21 [Hong Kong Stock Podcast] Part-1 Hang Seng Index, Mixue Ice City, Baidu] $MIXUE GROUP (02097.HK)$ Looking at the large technology and internet sectors, the market showed a mixed performance on the previous day (the 21st), with Baidu rising by 1.47%, $MEITUAN-W (03690.HK)$Up 1.53%, while$BABA-W (09988.HK)$ 、 $TENCENT (00700.HK)$ 、 $NTES-S (09999.HK)$) all recorded declines. Technical signals diverged: Baidu’s RSI reached 63 (entering overbought territory), and although its technical rating is "neutral," it carries a "strong sell" signal, indicating strong rebound momentum but also elevated pullback risks. Notably, Alibaba and Tencent’s technical signals are both "sell," with both showing signs of being overbought. This indicates that Baidu’s strengthening upward movement is not an isolated case but part of a broader sector rebound followed by widespread profit-taking...](https://nnqimage.futunn.com/sns_client_feed/1162342/20260422/web-1776826061725-WB5EXOFEiX.png/big?area=1&is_public=true&imageMogr2/ignore-error/1/format/webp)
For more market analysis, stay tuned to Jenny's daily updates on 'Hong Kong Stock Warrants'!
Reminder: This article does not constitute any investment advice.
This article is for reference only and does not constitute any investment advice. The market data, opinions, and analysis contained herein may change at any time without prior notice. We are not responsible for any loss or damage caused by reliance on the information in this article. Technical analysis only shows whether certain technical conditions are met; a comprehensive assessment of asset performance should be conducted using additional data. Decisions to trade should not be based solely on this article. Please note that past performance is not indicative of future results.
#HKStocks #Baidu #Real-TimeAnalysis #WarrantSelection #WarrantGuide #DerivativesHedging #HKWarrantsJenny #Blue-ChipStocks #TechnicalAnalysis
Risk Disclaimer: The above content only represents the author's view. It does not represent any position or investment advice of Futu. Futu makes no representation or warranty.Read more

Comment (1)
to post a comment
3