Tencent's 10-day moving average is in contention; the short-term key is whether it can hold steady at this level
$TENCENT (00700.HK)$ The stock dropped over 2%, hitting a low of 505.5 yuan during trading, with prices retreating to near the 10-day moving average (around 507 yuan) where it remains in contention. The short-term technical trend is showing a deadlock.
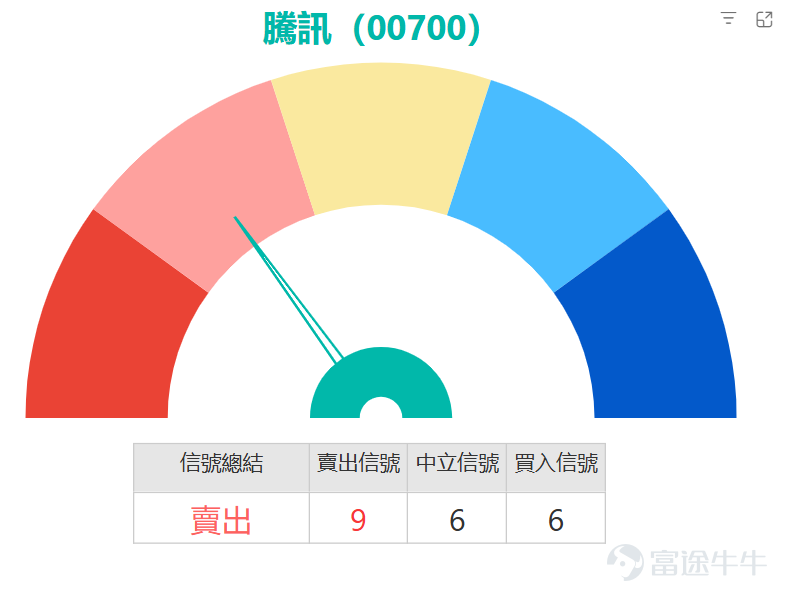
Based on an analysis of key technical indicators, signals are mixed, indicating that the market is in a phase of directional decision-making. Multiple oscillation indicators are giving conflicting signals: both the Stochastic Oscillator and Williams %R are issuing 'sell' signals, suggesting that recent rebound momentum may be weakening and the stock faces short-term adjustment pressure. Meanwhile, the Relative Strength Index (RSI) stands at 55, which is in the neutral-to-strong region but close to the overbought threshold, also signaling caution against chasing higher prices.
However, some indicators show that underlying support is building. The Bull/Bear Power indicator and Rate of Change (ROC) indicator are issuing 'buy' signals, reflecting a slowdown in downward momentum, with potential bargain-hunting by investors at lower levels. Additionally, the price is still contending near the 10-day moving average, while Bollinger Bands have not shown significant expansion, meaning recent volatility remains within a normal range without forming one-sided breakout panic.
From a technical perspective, the current key first support level is at RMB 498, which is close to the recent consolidation range bottom and the psychological threshold of RMB 500; this level must hold. If it breaks below that, it may test the second support level at RMB 487. On the upside, the primary resistance level is near RMB 523. If it can break through, the next target will aim at the higher target of RMB 535.


In summary, Tencent’s short-term technical signals are mixed, showing a range-bound consolidation pattern with 'resistance above and support below.' Although some momentum indicators weakening suggest adjustment risks, there are also fund flow indicators showing buying interest at lower levels. For professional investors, chasing gains or cutting losses is not advisable at the moment. A more prudent strategy is to observe the breakout direction within the RMB 498 to RMB 523 range. If the market can rise above and stabilize above the RMB 523 resistance in significant volume, the short-term rebound structure could continue. Conversely, if the critical support at RMB 498 is breached, caution should be exercised as adjustments may deepen. Until the direction becomes clear, trading within the range by selling high and buying low may remain the dominant strategy.
If investors believe that Tencent can break through the recent resistance and launch a rebound, they may consider deploying call warrants or bull certificates. Regarding call warrants, $BITENCT@EC2609E.C (28036.HK)$ with an exercise price of RMB 580.5, providing approximately 8.8 times actual leverage, its feature is relatively low implied volatility, helping to reduce the impact of time decay. Another option is $HSTENCT@EC2609E.C (27509.HK)$ with an exercise price of RMB 580.2, offering about 8.9 times actual leverage. This warrant has the lowest premium among similar products, and both its implied volatility and leverage levels are ideal, providing higher cost efficiency.
For investors with slightly higher risk tolerance who wish to capture a rebound at a lower cost, bull certificates are a more direct choice. $BI#TENCTRC2612Q.C (61677.HK)$ with a recovery price of RMB 470, providing approximately 8.9 times actual leverage, and relatively low premium. Another $BP#TENCTRC2609F.C (69399.HK)$ has a recovery price of RMB 467, offering about 9.4 times actual leverage, also benefiting from a relatively low premium. Both are suitable for investors who are bullish on the underlying stock and can tolerate the risk of being called back.
If investors expect Tencent to fail to maintain its support level, and the market may face downward pressure, they can consider put warrants or bear certificates. Regarding put warrants, $BITENCT@EP2606A.P (23122.HK)$ with an exercise price of RMB 499.8, providing approximately 10.7 times actual leverage, and having the lowest premium among similar products. Its implied volatility and leverage levels are both favorable. $SGTENCT@EP2606A.P (21910.HK)$ The strike price is also 499.8 yuan, with an actual leverage of about 10.6 times. Its implied volatility is relatively low, making it a more defensive choice.
For investors who are bearish on the market and can tolerate higher risks, bear certificates can provide higher leverage effects. $UB#TENCTRP2812T.P (62051.HK)$ The recovery price is 550 yuan, offering an actual leverage of up to approximately 16.5 times, with low premium, suitable for aggressive investors looking to capture potential downside movements. If you prefer slightly lower recovery risk, consider $UB#TENCTRP2812S.P (61361.HK)$ with a recovery price of 559 yuan, providing about 13.5 times actual leverage. Its premium is the lowest among similar products, and the actual leverage remains at a relatively high level. High resistance zone.

Reply to some investors' views:
@水綠一世 Stabilizing above 500 yuan indeed reflects that the trend has become more stable than before, but there is still resistance above that needs addressing.
@美少女戰士V$BABA-W (09988.HK)$ If it weakens, it could indeed slow down the overall sentiment in the tech stock sector, including Tencent.
@羊羊羊博士 The recent pullback hasn't damaged the structure yet, but if it breaks below 515.500, be more cautious, as a retest of 507.220 might occur.
@wushn If the broader market adjusts, it will naturally be harder for Tencent to strengthen independently, so support levels are even more important. @Luck Baby If it returns near 510 yuan, it would indeed get closer to the level some funds are waiting for.
Friendly Reminder: This article does not constitute any investment advice.
This article is for reference only and does not constitute any investment advice. The market data, opinions, and analysis contained herein may change at any time without prior notice. We are not responsible for any loss or damage caused by reliance on the information in this article. Technical analysis only shows whether certain technical conditions are met; a comprehensive assessment of asset performance should be conducted using additional data. Decisions to trade should not be based solely on this article. Please note that past performance is not indicative of future results.
#HKStocks #RealTimeAnalysis #WarrantPick #WarrantGuide #DerivativesHedging #HKWarrantsJenny Tencent #00700#TechStocks #TechnicalAnalysis$Hang Seng Index (800000.HK)$$Hang Seng TECH Index (800700.HK)$$Hang Seng China Enterprises Index (800100.HK)$
Risk Disclaimer: The above content only represents the author's view. It does not represent any position or investment advice of Futu. Futu makes no representation or warranty.Read more
Comment (1)
to post a comment