
CPU returns to the core of AI! Who are the big winners?
[Harvest Macro] | Global Financial Markets Weekly Report 20260416
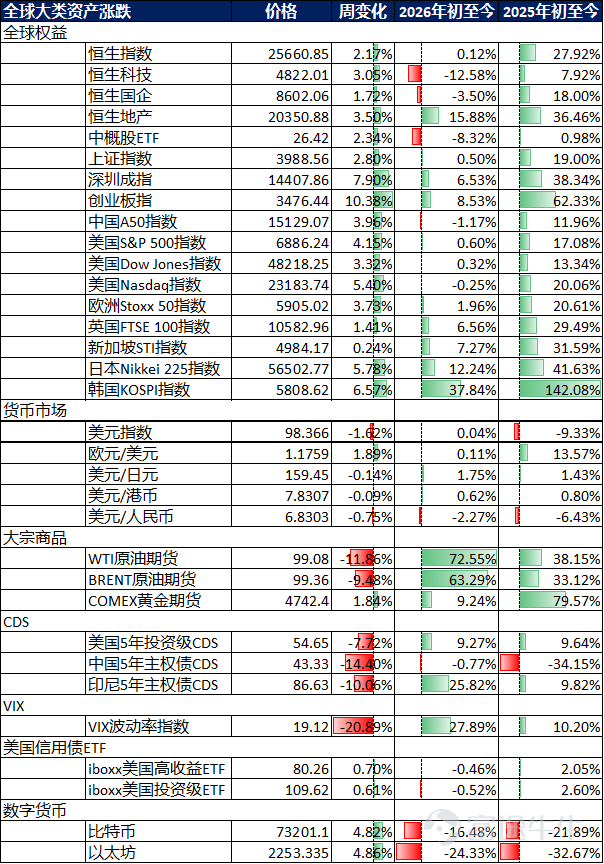
Market performance over the past week

Data Source: Bloomberg and HARVEST
Global capital flows
According to EPFR data, during the week of April 1 – April 8, global equity markets turned to net outflows, while the bond market recorded its 50th consecutive week of net inflows (last week’s net inflow was $3.3 billion). Specifically, A-shares recorded net outflows for the second consecutive week (last week’s net outflow was $2.8 billion); Hong Kong stocks recorded net inflows for the second consecutive week (last week’s net inflow was $0.26 billion); emerging markets turned to net inflows (last week’s net outflow was $2.4 billion); US stocks recorded net inflows for the second consecutive week (last week’s net inflow was $13.15 billion); developed European stock markets turned to net inflows (last week’s net outflow was $0.63 billion); Japanese stocks recorded net outflows for the second consecutive week (last week’s net inflow was $0.13 billion).

Data source: EPFR and Harvest
Stock market
Review and Outlook of the Past Week
United States:
This week, major global indices exhibited a deep V-shaped trend characterized by a violent rebound after extreme geopolitical risk release, record highs in the semiconductor sector, and rapid return of risk-off capital. The core focus centered on the dramatic shift in the US-Iran situation from a '48-hour bombing ultimatum' at the brink of war to a 'two-week temporary ceasefire,' alongside the bulls-and-bears tug-of-war triggered by record-low March US CPI data and consumer confidence. The S&P 500 rose 3.56% this week; the Nasdaq Composite Index surged 4.68%; and the Dow Jones Industrial Average climbed 3.04%. At the beginning of the week, Trump's threat of 'Power Plant Day' against Iran and the US military pilot rescue operation caused volatility, pushing WTI oil prices to a four-year high as risk aversion triggered a flash crash in US stocks; subsequently, news of a two-week ceasefire agreement between the US and Iran, along with Iran agreeing to reopen the Strait of Hormuz, led to the largest short-covering rally since 2020. The semiconductor sector performed strongly, with the Philadelphia Semiconductor Index surging over 6.3%, hitting a record high. However, private credit markets faced a redemption wave, with Blue Owl shares hitting a record low, reflecting ongoing high liquidity risks.
Japan:
This trading week, the Japanese stock market showed characteristics of 'deep pricing of energy crisis - storage chip logic-driven - significant recovery after fluctuation.' The Nikkei 225 index surged retaliatorily throughout the week, closing at 56,924.11 points, with a single-week gain of 3,800.62 points. The core focus was Japan’s heavy reliance on Middle Eastern energy (90% crude oil dependence on the Strait of Hormuz) and the sharp swing in geopolitical tensions. Early in the week, threats from Trump to destroy Iranian civilization and the risk of strait blockage caused the Nikkei Index to plunge deeply; the yield on Japan’s 10-year government bonds hit a 27-year high, and institutional selling pressure surged. Subsequently, following the ceasefire agreement and easing fears of energy supply disruptions, along with Japanese LNG tankers passing through the strait, the energy crisis alert eased, significantly restoring market sentiment. Sector performance showed strong gains in semiconductors and stabilization in traditional manufacturing, with Kioxia recording record trading volumes, reflecting the high prosperity of the AI-driven storage industry.
Eurozone:
This trading week, European stock markets showed the core characteristic of 'violent rebound after extreme geopolitical pressure, heightened expectations of trade frictions.' Early in the week, under the shadow of escalating Middle East conflict and the blockade of the Strait of Hormuz, Europe faced severe imported stagflation risks, with indices opening lower under pressure. However, with the unexpected two-week temporary ceasefire agreement between the US and Iran, the alarm of energy supply disruption hanging over Europe temporarily lifted. The Stoxx 600 closed at 614.84, gaining 24.25 points for the week, with core national indices such as Germany, France, and the UK collectively recovering strongly by the end of the week: the FTSE 100 in London closed at 10,600.53 points, gaining 251.74 points for the week; the CAC40 in France closed at 8,259.6 points, rising 350.86 points for the week; the DAX in Germany showed strong resilience, closing at 23,803.95 points, surging 882.36 points for the week; the MIB index in Italy closed at 47,609.36 points, rising 2,197.57 points, significantly driven by improved global risk appetite.
Emerging Markets:
South Korea
The core focus centered on 'AI storage chip business model reshaping and explosive earnings growth.' South Korea’s main board outperformed all others this week, driven entirely by fundamental hard-core performance: Samsung Electronics’ operating profit in Q1 surged 755% year-on-year, with quarterly profits exceeding the total of last year. Additionally, Microsoft and Google are negotiating three-year DRAM supply agreements with SK Hynix and unprecedentedly introduced a prepayment mechanism ranging from 10% to 30%. This rush to purchase memory chips as 'strategic reserve resources' directly pushed the KOSPI index to rise strongly, gaining 327.68 points for the week and closing at 5,778.01 points, with year-to-date cumulative gains reaching 34.07%, as the semiconductor sector absorbed the majority of returning foreign liquidity.
India
The core focus revolved around 'valuation recovery after black swan events dissipate.' As a net importer highly sensitive to crude oil prices, India’s market initially faced foreign capital withdrawal pressures due to the IEA's 'Black April' warning. However, following the US-Iran ceasefire agreement and the pullback of WTI crude oil spot premium, the sword of Damocles of imported inflation temporarily lifted. Improved macro liquidity expectations directly drove the Nifty 50 Index to surge 1,082.35 points for the week, closing at 26,328.55 points (year-to-date loss narrowed to -8.65%), with widespread gains in financial and domestic demand sectors.
Vietnam.
The core contradiction focuses on 'expectations of external demand recovery versus the dividend from supply chain restructuring.' Disruptions to maritime logistics caused by geopolitical tensions eased later this week. Despite pressures from high global energy price volatility, the recovery in tech end-markets (e.g., progress in Apple's foldable screen supply chain and rising shipment expectations for AI devices) has provided order support for the transition from low-end manufacturing to mid-to-high-end contract manufacturing. The Ho Chi Minh Index steadily rebounded after risk aversion subsided, gaining 75.01 points for the week to close at 1767.84 (-1.93% year-to-date).
Bond market
Past Week Review
Last week, movements on the one-year SOFR curve were mixed; the US 2-year Treasury yield fell by 7.6bps, while the 10-year yield declined by 3.7bps. In terms of Chinese rates, the 3-year government bond yield rose by 1.8bps, whereas the 10-year yield dropped by 1.8bps. The inversion of the US-China 10-year yield spread stood at 250bps.

Data Source: Bloomberg and HARVEST
Government bonds:This week, US dollar yields were primarily influenced by global geopolitical headlines and domestic data. At the start of the week, President Trump emphasized during a press conference that reopening the Strait of Hormuz must be part of any ceasefire agreement, driving oil prices above $114. However, equity markets still closed higher. Subsequently, both parties positively responded to Pakistan’s proposal, leading to a ceasefire deal, which boosted market risk appetite as Iran reopened the strait. Although attacks persisted across the Middle East, markets remained relatively calm. Oil prices fell 16% to around $91, while the E-mini index gained 2.8%, resulting in a bull-steepening yield curve with short-term yields dropping by 12bps. Midweek, the fragile ceasefire unraveled after Israel attacked Hezbollah, prompting Iran to close the Strait again. Israeli Prime Minister Netanyahu clarified that the ceasefire did not include Lebanon, causing US bond duration to sell off to pre-agreement levels and oil prices to rebound to $100. However, later in the week, Trump urged Netanyahu to scale back attacks, which was met positively, pushing duration back up. The first round of negotiations held Saturday morning in Islamabad is worth watching closely. On the data front: March ISM Services Index came in at 54.0, below expectations of 54.9 and down from 56.1, signaling stagflation risks. The prices paid index surged to 70.7 (from 63.0), its highest since 2022, while the employment index fell to 45.2 (from 51.8), its lowest since 2023. The Fed's March FOMC minutes showed a dovish-hawkish mix: reaffirming a 'higher for longer' stance while also expressing concerns about labor market weakness. Current fed funds futures pricing suggests the Fed will cut rates cumulatively by 7bps by year-end.
Credit bonds:This week, spreads on Chinese offshore dollar bonds generally tightened by 2-5bps. Risk sentiment significantly improved following the end of the long holiday and news of a temporary US-Iran ceasefire, with credit spreads narrowing by 2-5bps on the first trading day post-holiday. As the week drew to a close, credit trading was subdued ahead of the release of US March CPI inflation data, with spreads giving back 1-2bps of gains, though selling pressure remained restrained. By sector: In the internet space, Alibaba’s 10-year dollar bond spread narrowed by 4bps, while Meituan’s 10-year dollar bond spread tightened by 3bps. In the financial sector, short-dated AMC and brokerage bonds saw buying interest, with spreads tightening by 2-5bps. In the leasing sector, Bank of China Leasing’s 7-year dollar bond spread narrowed by 4bps. Hong Kong names also tightened, with Hongkong Electric’s 10-year dollar bond spread narrowing by 3bps and LINK REIT’s 10-year dollar bond spread tightening by 2bps.
Outlook:The Federal Reserve released the minutes of its March FOMC meeting at 2 AM on April 9 (Hong Kong time), providing further details on last month’s policy decision and future path. Compared to January’s minutes, key changes included: 1) Geopolitical risks shifted from being a ‘peripheral variable’ to a ‘core variable’; 2) A fundamental shift in risk assessment, with downside risks to employment resurfacing alongside heightened upside risks to inflation; 3) Forward guidance turning slightly hawkish, with ‘some’ participants explicitly advocating for a ‘two-way’ rate description in the post-meeting statement; 4) Artificial intelligence (AI) explicitly incorporated as a structural factor in labor market risk assessments.
Currently, the US economy is characterized by ‘steady growth but weakening momentum.’ Core PCE inflation has hovered near 3% for several months—well above the 2% target—and faces upward pressure amid energy price shocks. The labor market remains in a ‘low hiring, low firing’ equilibrium, though this balance is fragile, and any additional hit to labor demand could trigger a nonlinear rise in unemployment. Moreover, job growth is concentrated in sectors like healthcare, which are less cyclical, potentially underestimating underlying vulnerabilities in the broader labor market. Regarding GDP growth, Fed staff projections have been revised downward from ‘above potential’ in January to ‘roughly equal to potential’ in March. Looking ahead, the Fed’s policy path largely hinges on developments in the Middle East conflict. Under the baseline scenario, the Fed is expected to pause rate cuts in the first half of the year and implement at least one cut by year-end. However, if US unemployment rises sharply and oil prices fall, two rate cuts may occur in the second half. Additionally, to anchor inflation expectations, the Fed retains the option to hike rates. For global market participants, energy price trends, US inflation data (especially core PCE), labor market indicators (particularly hiring rates in the JOLTS report and unemployment figures in the NFP report), and progress on leadership transitions at the Fed should be closely monitored. Data released Friday showing weaker-than-expected March CPI inflation and a decline in the University of Michigan’s April consumer sentiment index may signal increased expectations for Fed rate cuts as Middle East tensions ease. Currently, fed funds futures price in a cumulative 7bp rate cut this year.
In terms of market dynamics, possible trends include: 1) Interest rate markets—under current conditions, the US Treasury yield curve will continue to be shaped by multiple interacting factors. The short end is supported by delayed expectations of Fed policy rate hikes and rising inflation compensation, keeping yields elevated, but could drop sharply if tensions in the Middle East ease. The long end is pressured by weakening growth prospects and safe-haven demand, while term premiums may expand due to geopolitical uncertainty. 2) Equity markets—the US stock market faces multiple headwinds, including eroded corporate profits from rising energy costs, delayed rate-cut expectations, AI disruption fears impacting the software sector, and suppressed risk appetite from geopolitical uncertainty. Energy and defensive sectors may benefit relatively, while industries heavily reliant on imported energy and consumer layers will face pressure. Rising redemption pressures in private credit funds represent another potential risk transmission channel to watch. 3) Foreign exchange markets—the US dollar benefits in the later stages of Middle East conflicts due to its safe-haven status, rising Treasury yields, and the US position as a net energy exporter (terms of trade). However, if conflict escalates and undermines global growth prospects, the dollar’s trajectory will depend on the interplay between safe-haven demand, economic fundamentals, and fiscal conditions—raising the possibility of simultaneous declines in US stocks, bonds, and the currency. 4) Commodity markets—volatility in crude oil and natural gas prices will remain above normal levels; supply disruptions in related commodities like fertilizers and helium warrant attention; precious metals (e.g., gold) will perform well if concerns arise over US fiscal conditions/dollar credibility or if slower US economic/employment growth boosts expectations for Fed rate cuts.
Note that on April 8, The New York Times cited three Iranian officials saying that Iran’s decision to accept Pakistan’s two-week ceasefire proposal came after diplomatic efforts by Pakistan and last-minute pressure from China. They stated that China urged Iran to show flexibility to de-escalate tensions. Given China’s influence and timing of intervention, the upcoming US-Iran talks set to begin in Islamabad on the morning of April 11 may mark the beginning of the end of the US-Israel-Iran military conflict. If tensions escalate again in the future, it will be harder to find a credible and influential mediator to allow the US to disengage from the Middle East vortex and prevent Iran from incurring greater losses. If this reasoning holds, Middle East tensions are likely to gradually ease with some oscillation in the foreseeable future, broadly benefiting risk assets. However, sporadic headline risks—particularly concerning Israel—may still impact market sentiment.
Foreign exchange market
Offshore Renminbi:This week’s March FOMC minutes highlighted dual risks stemming from the US-Israel-Iran military conflict: on one hand, Fed officials worry that escalating conflict could exacerbate inflation; on the other, some officials fear prolonged war might harm the labor market. Economic data-wise, February’s core PCE inflation edged down slightly from the previous month, while overall PCE inflation remained unchanged. Meanwhile, US personal consumption grew 0.5% MoM in February, below market expectations of 0.6%, leaving markets grappling between inflation and recession concerns. Last weekend’s easing of US-Iran tensions triggered sharp market swings, with the dollar nearly wiping out its year-to-date gains. However, given the difficulty of aligning core demands from both sides, multiple scenarios remain possible. After an initial rapid drop earlier this week, USD/CNH stabilized around 6.83, with two-way interest observed, while southbound stock connect flows showed mixed inflows and outflows. Markets expect the renminbi to remain strong amid Middle East military tensions, with focus now on whether it can break through the 6.8 support level.
US Dollar:Risk sentiment continued to dominate the markets this week. With liquidity reduced due to the Easter holidays, market movements were relatively volatile. Following an ultimatum from President Trump, the US and Iran announced a two-week ceasefire agreement, which boosted market optimism. Driven by this headline news, the US dollar was heavily sold off, with the DXY index dropping nearly 1.7%, hitting its lowest level in about four weeks. Oil prices also plummeted, with Brent crude falling 16% to $92 per barrel at one point, then consolidating near $100 for the rest of the week, while equities rose. However, Iran later claimed that the US violated the ceasefire and attacks within Lebanon continued, prompting the re-closure of the Strait of Hormuz, causing some pullback in the markets. This weekend, US Vice President Vance will travel to Islamabad to negotiate with Iran, and Trump expressed he is 'very optimistic' about reaching an agreement with Iran. Currently, both sides seem to have paused their strikes in the region, including Israel's ongoing operations against Hezbollah, Tehran-backed forces in Lebanon. Overall, the dollar remains weak, down about 1.6% for the week, currently holding above key moving averages (MA).
Macroeconomics
China:
In March, CPI saw a moderate decline influenced by seasonal factors, dropping 0.7% month-on-month, slightly below the historical average for the same period, with year-on-year growth easing from 1.3% to 1.0%. Food prices underperformed seasonality, declining 2.7% month-on-month, lower than the historical average of -2.3%. Among these, pork prices fell 7.3% month-on-month due to concentrated hog production releases. Prices of fresh vegetables, fruits, and aquatic products dropped 10.1%, 3.3%, and 2.6% respectively, all below seasonal levels, mainly due to warmer weather increasing supply and post-holiday consumer demand retreating. Energy prices continued to rise, driven by escalating Middle East geopolitical tensions, OPEC+ tightening supply, and global demand recovery. In March, Brent crude oil futures averaged a 43.6% increase month-on-month, pushing domestic gasoline prices up 11.1%. Fuel prices for transportation increased from 2.8% in the previous month to 10.0% month-on-month, turning from a 9.0% year-on-year decrease to a 3.4% increase; utility fuel prices shifted from flat to a 0.2% increase month-on-month, with the yearly increase expanding to 0.6%. Regarding PPI, it rose 1.0% month-on-month and 0.5% year-on-year in March, with five major petrochemical industry chains contributing 0.48 percentage points to the monthly increase. For Q1, CPI rose 0.9% year-on-year while PPI declined 0.6% year-on-year. Considering that approximately 70% of the GDP deflator is made up of PPI, it is expected that the GDP deflator for Q1 has turned positive. The narrowing PPI-CPI spread indicates gradual repair of upstream industrial enterprises’ profitability, with improvements in the profit distribution between upstream and downstream sectors. After the US-Iran conflict, high-frequency data related to infrastructure investment and petrochemical products continued to improve. Domestic investment demand is expected to continue rising, and there are risks that the pace of PPI's yearly increase could exceed expectations.
United States:
Policy divisions within the Federal Reserve deepen amid signals of sticky inflation and slowing growth. Meeting minutes revealed that most officials worried that war damage to the labor market necessitated rate cuts, but many policymakers emphasized inflation risks, believing that rate hikes might ultimately be required. The US added 178,000 jobs in March, with unemployment dropping to 4.3%. The 'new Fedwire' noted that better-than-expected employment temporarily resolved the Fed's dilemma. However, the final March services PMI fell to 49.8, marking the first contraction in 2023, with overall economic growth annualized rate slowing to around 0.5%; the ISM services PMI retreated to 54, with the prices paid index spiking to its highest since October 2022, and the employment index falling into contraction territory. The final reading of Q4 real GDP annualized quarter-on-quarter growth was revised down to 0.5%. On the inflation front, March CPI rose 3.3% year-on-year, with a 0.9% month-on-month increase—the largest rise in nearly four years—driven by record gas price increases since 1967, bringing rate hike discussions back into focus. February’s core PCE price index rose 3% year-on-year, while real spending nearly stagnated and the savings rate plunged to 4.0%. The preliminary April University of Michigan consumer sentiment index hit a historic low of 47.6, with initial one-year inflation expectations surging to 4.8%. Additionally, February’s core durable goods orders rose 0.8% month-on-month, but overall figures were dragged down by aircraft, marking three consecutive months of negative growth. The Trump administration seeks a $1.5 trillion defense budget for fiscal year 2027, the largest annual military expenditure increase since WWII, including $65.8 billion in shipbuilding budgets and $350 billion in mandatory spending. Concurrently, the US initiated one of its largest-ever tax refund programs, opening applications on April 20. In terms of financial risk, the US private credit sector experienced a redemption rush, with Blue Owl’s stock hitting a record low. Goldman Sachs’ fund redemptions neared the 5% cap, forcing Barings to cap redemptions at 5%.
On core economic and market dynamics, industry logic and geopolitical games are deeply intertwined, with AI computing power demand and the Middle East ceasefire negotiations becoming focal points. One-year contracts are now a thing of the past as Samsung and SK Hynix push hard for 3-to-5-year long-term supply agreements (LTA), with Microsoft and Google vying to sign long-term DRAM deals. AI demand continues to support the market, with Samsung’s Q2 DRAM prices soaring 30%, surpassing gold. Amazon Web Services (AWS) cloud business AI revenue annual run rate exceeded $15 billion, doubling its custom chip scale to $20 billion. CoreWeave secured a $21 billion mega-deal with Meta, covering all four AI giants. Broadcom executives highlighted three bottlenecks in the AI supply chain (lasers, advanced process wafers, and PCBs), indicating a computing power gap that may persist until 2027; optical module giant Lumentum stated they could sell out their entire 2028 capacity within two quarters. Moreover, SpaceX has finalized IPO details, planning a June roadshow targeting $75 billion in funding, valuing the company at up to $1.75 trillion. Less than 12 hours after threatening to 'destroy civilization,' Trump accepted a two-week ceasefire, claiming Iran agreed to reopen the Strait of Hormuz. However, disputes over transit fees followed, with Iran proposing a $2 million toll for passing tankers, prompting a firm warning from Trump advocating 'joint control.' The first round of US-Iran talks took place on the 11th in Pakistan. Despite the ceasefire, Trump stated that US forces would 'continue to remain in and around Iran,' and if the deal is breached, hostilities would reignite 'on an unprecedented scale.' Furthermore, Trump again targeted Greenland, publicly criticizing NATO. On energy exports, Middle East conflicts triggered a rush for oil, driving Asian buyers toward North America and boosting US crude exports to a new high of 5.2 million barrels per day in April.
Japan:
Fears over inflation combined with weakening expectations of Fed rate cuts drove Japan’s 10-year government bond yields to a 27-year high, forcing Japanese institutions to sell overseas risky assets and repatriate funds due to valuation losses. Meanwhile, domestic finances face severe tests: Japan’s government fuel subsidies burn through about 600 billion yen monthly, with current funds lasting at most three months, compounded by summer electricity subsidy pressures potentially raising monthly costs to 900 billion yen. Middle East conflicts also led to a 30% drop in Japan's March naphtha imports, directly impacting automobile parts supply chains and forcing carmakers to reduce or halt production. The tech sector and foreign investments became absolute highlights. Kioxia Holdings, buoyed by AI-driven tight NAND supply-demand dynamics and expectations of its first dividend post-IPO, recorded trading volumes exceeding 1 trillion yen on April 8 and 9, a first in Japanese stock market history, with year-to-date share price gains reaching 2.6 times. Simultaneously, Berkshire Hathaway, led by Buffett, returned to the yen bond market, issuing approximately $1.7 billion (272.3 billion yen) worth of bonds, marking its third-largest issuance ever, highlighting deepening strategic foreign investments in Japan’s core assets. A drastic change in the storage chip business model reshaped cost structures, with Samsung and SK Hynix launching a business model revolution this week, abandoning short-term quarterly contracts to aggressively push 3-to-5-year LTAs. Meanwhile, the latest server DRAM chip prices soared to $37 per chip, with per gram prices even surpassing gold. This extreme strengthening of upstream pricing power left Japanese domestic semiconductor materials and equipment suppliers overwhelmed with orders, while implying that downstream consumer electronics and automakers in Japan will be forced into a long-term high-cost framework locked in both price and volume.
Europe:
Expectations of ECB interest rate hikes 'cooled overnight.' Following the US-Iran ceasefire agreement, the sharp drop in oil prices quickly alleviated market concerns over a rebound in Eurozone inflation. Traders swiftly pared back bets on rate hikes, removing one 25 basis point hike expectation each from the European Central Bank and the Bank of England, resulting in the largest single-day rally in European bonds since 2023. Since early 2024, the EU has imposed hefty fines totaling over €6 billion (approximately $7 billion) on American tech giants like Google, Apple, and Meta. This anti-monopoly move faced strong backlash from the Trump administration this week, with the US directly calling it equivalent to 'tariffs' and threatening to consider retaliatory tariffs, sharply escalating US-EU trade tensions. Against this backdrop, export-oriented European firms (particularly German manufacturing and French luxury goods) face significant uncertainty in their external earnings environment. On the other hand, the EU and the US are nearing a critical minerals agreement aimed at creating competitive advantages for non-dominant market suppliers through mechanisms like minimum pricing incentives. The spillover effects of AI infrastructure are evident, with Europe’s traditional industries unexpectedly benefiting from the global surge in AI capital expenditures. Driven by massive demand for self-built power plants by large data centers, Siemens Energy secured a record-breaking €8.75 billion order for gas turbines in the first fiscal quarter, extending delivery schedules to 2029-2030. This structural demand explosion provides new fundamental support for revaluing Europe's industrial sector.
Global cyclical phase synchronization indicators:
China remains on the edge of recession; the probability of a US recession is low; Europe emerges from recession.

Data Source: Bloomberg and HARVEST
– China:Year-over-year real estate sales, year-over-year new real estate starts, year-over-year M1, year-over-year electricity generation, PMI new orders, auto sales
– United States:Unemployment-related indicators, real estate pre-sale permits, auto sales, consumer expectations, investor sentiment, new orders, stock drawdowns
– Eurozone:Economic activity indicators, real estate pre-sale permits, consumer confidence, manufacturing PMI, services PMI, credit spreads, stock drawdowns
Leading indicators of the global corporate earnings cycle
Growth LEI: Q1 China's economy may recover; European corporate earnings growth has stabilized; US corporate earnings growth is upward.

Data Source: Bloomberg and HARVEST
Key economic data from last week (Source: Bloomberg and Harvest Fund:
• [US March CPI Year-on-Year to 3.3%]: Energy prices pushed US March CPI year-on-year to 3.3%, with a 0.9% month-on-month increase—the largest in nearly four years—record-breaking gas price rises, bringing rate hike discussions back into view.
• [US March Nonfarm Payroll Addition]:The US added 178,000 nonfarm jobs in March, with the unemployment rate dropping to 4.3%.
• [U.S. March Services PMI]: Final reading fell to 49.8, marking the first contraction in 2023, with overall economic growth slowing to an annualized rate of approximately 0.5%; the March ISM Services PMI dropped to 54, while the prices paid index surged to its highest level since October 2022. The employment index fell into contraction territory.
• [U.S. March S&P Global U.S. Services PMI]: Initial reading was 51.1; previous reading was 51.7.
• [U.S. February Core PCE Price Index]:The price index increased 3% year-over-year, with real spending nearly stagnant and the savings rate plummeting to 4.0%.
• [China March PPI]: Year-over-year increase of 0.5%, with a month-over-month gain of 1.0%. The five major petrochemical industry chains contributed a combined +0.48 percentage points to the monthly PPI increase; Q1 CPI increased 0.9% year-over-year, PPI increased 0.6% year-over-year. Considering that approximately 70% of the GDP deflator is made up of PPI, it is estimated that Q1’s GDP deflator has turned positive.
• [China March CPI]:Due to seasonal declines in food and service prices, March CPI fell by 0.7% month-over-month, with the year-over-year increase dropping from 1.3% in the previous month to 1.0%.
• [Divergence in the performance of China's industrial consumer goods prices]:In March, affected by rising raw material costs and strong demand, prices for data storage devices and communication tools increased by 5.5% and 0.5% respectively compared to the previous month; with the launch of spring clothing, apparel prices rose 0.4% month-on-month.
Disclaimer:
Investment involves risks, including possible loss of principal. Past performance or any forecasts or expectations do not indicate future performance. Before making investment decisions, investors should review relevant sales documents, including risk disclosures. Investment returns not denominated in Hong Kong dollars or US dollars are subject to exchange rate fluctuations.
The interests of this company are not offered or sold in Hong Kong through advertisements, invitations, or any other documents, except in cases where it does not constitute a public offering. This document has not been approved under the Securities and Futures Ordinance or the Companies Ordinance and is intended solely for authorized persons. It must not be distributed to unauthorized persons in Hong Kong or to unauthorized persons in any other jurisdiction. This material has not been reviewed by the Securities and Futures Commission of Hong Kong. For the purposes of this statement, 'authorized persons' shall mean professional investors as defined under the Securities and Futures Ordinance whose ordinary business involves purchasing, selling, or holding securities (whether as principals or agents). Distribution of this material may be restricted in certain jurisdictions.
In cases where it would be illegal to make an offer to any person within a jurisdiction, this document shall not be deemed as an offer or invitation to such persons. This document is for reference only and does not constitute any investment advice or recommendation, nor does it constitute an offer or invitation. It is not a basis for contracts involving the purchase or sale of any securities or instruments, nor is it a basis for Harvest Fund Management Co., Ltd., Harvest Global Investments Limited, or their affiliates to enter into or arrange any type of transaction based on the information contained herein.
Although the third-party information provided above is sourced from what should be reliable sources, neither Harvest Fund Management Co., Ltd., Harvest Global Investments Limited, their authorized issuers, affiliates, nor any of their directors or employees shall bear any responsibility for any errors or omissions therein. The information and opinions expressed herein are for reference only and may be adjusted without notice, and therefore should not be relied upon for making investment decisions. You should consult your investment advisor before making any investment decision.
The issuer of this document is Harvest Global Investments Limited. This document belongs to Harvest Global Investments Limited, which holds the copyright. Further circulation of this document is prohibited without the written consent of Harvest Global Investments Limited. All rights reserved.
All rights reserved ©2026 Harvest Global Investments Limited
Risk Disclaimer: The above content only represents the author's view. It does not represent any position or investment advice of Futu. Futu makes no representation or warranty.Read more
Comments
to post a comment
1