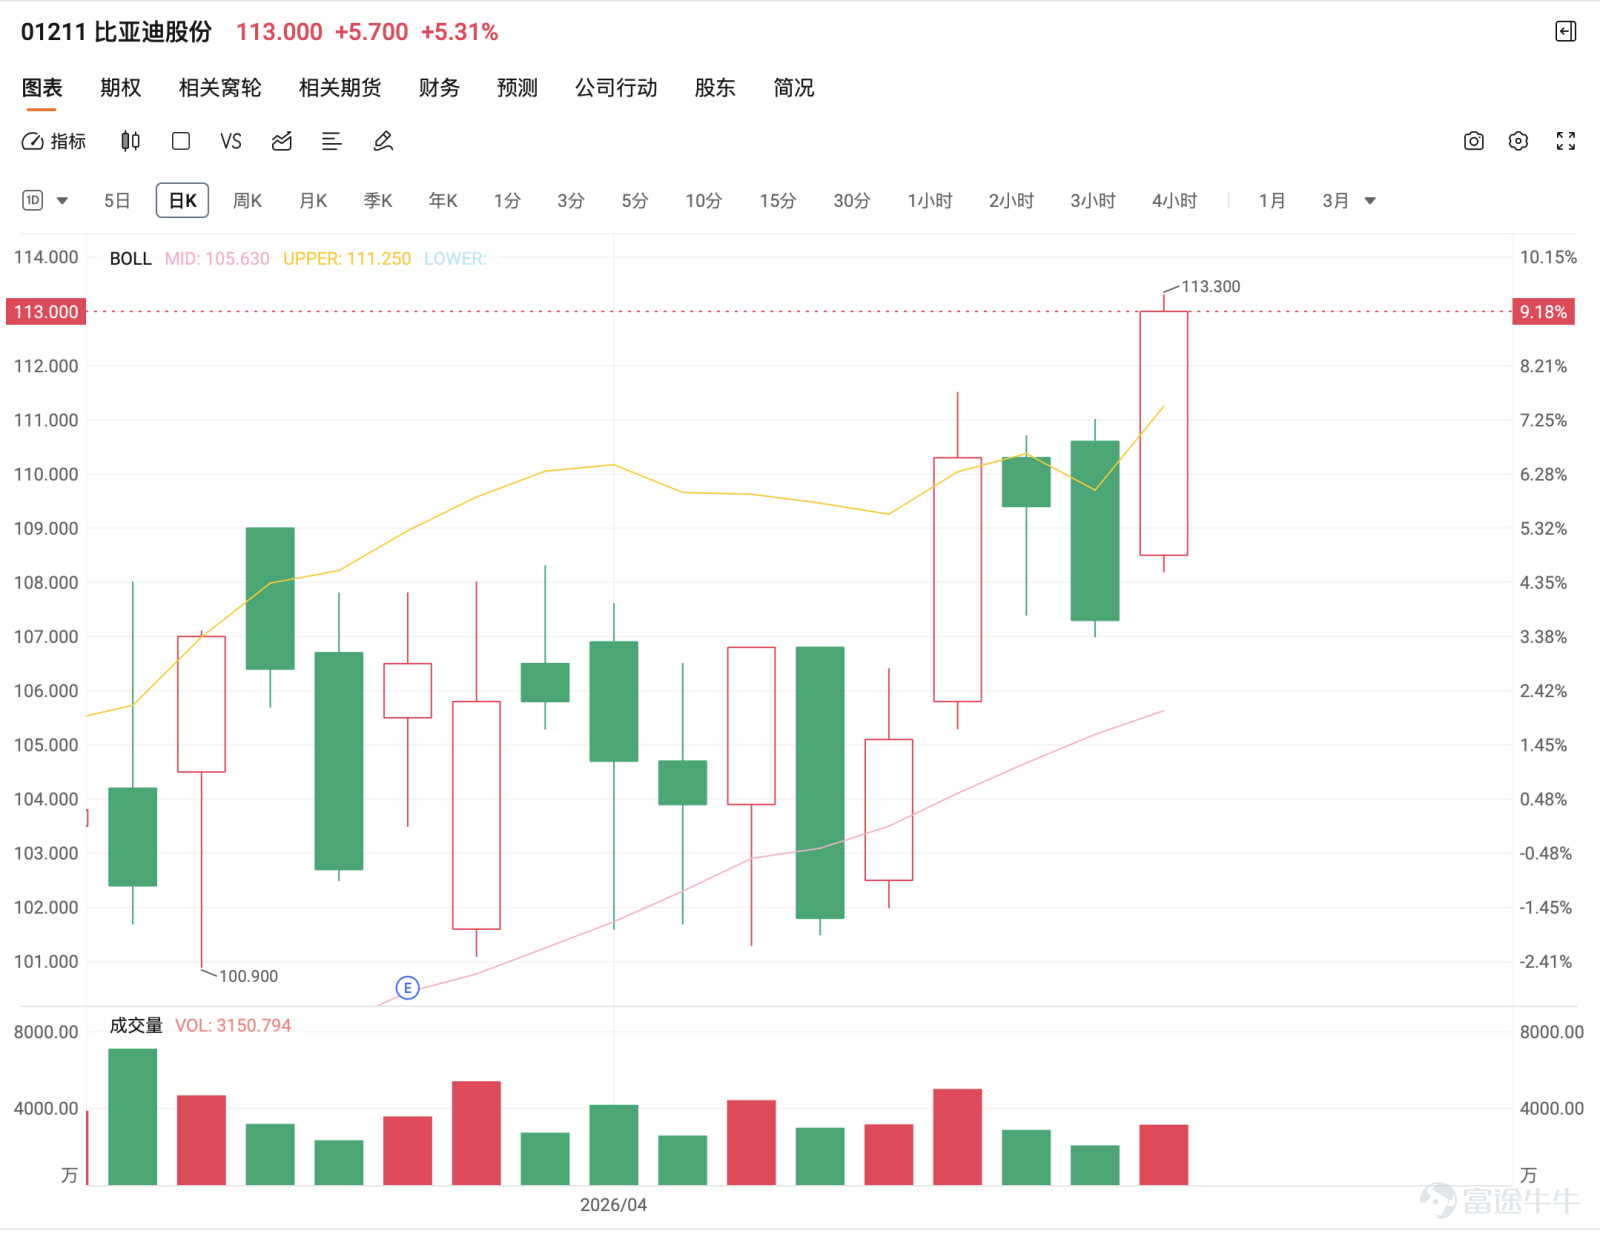
English
Back
Open Account
港股窩輪Jenny
commented on a stock · Apr 16 15:44

BYD (1211) maintains a bullish moving average alignment, and the mid-term trend remains strong: it needs to stabilize above $111 to confirm a bullish reversal.

Based on technical data as of April 16, 2026, BYD is trading at $113.1, up 5.31%. The 5-day volatility is 9.5%, currently consolidating at a high level after a rebound. Technically, the current key support levels are $105.4 and $101.8, with resistance levels at $116.2 and $119.6. The moving average system remains in a bullish arrangement: MA10 ($106.66), MA30 ($102.74), and MA60 ($99.92) are all below the current price, indicating a strong mid-term trend.
The RSI indicator is at 64, within the neutral zone, showing no signs of overbought or oversold pressure. Multiple oscillation indicators signal 'neutral,' with the RSI being neutral, the Williams %R indicator showing overbought conditions but issuing a neutral signal, and the stochastic oscillator issuing a buy signal. The CCI indicator also signals neutral. ADX, psychological line, and momentum oscillators remain neutral, and the rate of change indicator is similarly neutral. The bull-bear power indicator issues a buy signal, while the VR volume ratio is neutral. Ichimoku Cloud, MACD, and Bollinger Bands all issue buy signals. Overall technical indicators show a 'neutral' signal, with a strength rating of 8.
Based on technical data as of April 16, 2026, BYD is trading at $113.1, up 5.31%. The 5-day volatility is 9.5%, currently consolidating at a high level after a rebound. Technically, the current key support levels are $105.4 and $101.8, with resistance levels at $116.2 and $119.6. The moving average system remains in a bullish arrangement: MA10 ($106.66), MA30 ($102.74), and MA60 ($99.92) are all below the current price, indicating a strong mid-term trend.  The RSI indicator is at 64, within the neutral zone, showing no signs of overbought or oversold pressure. Multiple oscillation indicators signal 'neutral,' with the RSI being neutral, the Williams %R indicator showing overbought conditions but issuing a neutral signal, and the stochastic oscillator issuing a buy signal. The CCI indicator also signals neutral. ADX, psychological line, and momentum oscillators remain neutral, and the rate of change indicator is similarly neutral. The bull-bear power indicator issues a buy signal, while the VR volume ratio is neutral. Ichimoku Cloud, MACD, and Bollinger Bands all issue buy signals. Overall technical indicators show a 'neutral' signal, with a strength rating of 8.   In summary, BYD is currently in a strong consolidation phase near highs: the mid-term uptrend remains intact, but there is no clear short-term breakout direction yet. The stock price needs to stabilize above $111 and break through $11...
In summary, BYD is currently in a strong consolidation phase near highs: the mid-term uptrend remains intact, but there is no clear short-term breakout direction yet. The stock price needs to stabilize above $111 and further break through $116.2 to confirm a bullish reversal; conversely, if it breaks below the $105.4 support, consolidation could turn into a weak phase.
Warrant Product Recommendations
For BYD’s current technical position, you may consider the following CBBCs (Callable Bull/Bear Contracts):
For bullish warrants and bull contracts: UBS Group call warrant (18237) $UB-BYD @EC2611A.C (18237.HK)$With a strike price of 128.433 yuan, it offers approximately 5.1 times actual leverage, with relatively ideal leverage and implied volatility; BOC call warrant (21676)$BI-BYD @EC2610A.C (21676.HK)$With a strike price of 128.88 yuan, it provides about 4.9 times leverage, making it the highest-leveraged call warrant in its category with relatively low premium. For those looking to capture rebounds or breakouts using bull contracts, J.P. Morgan bull contract (54284) has a stop-loss level at 96 yuan and offers around 6.2 times actual leverage with low premium; BOC bull contract (54686)$BI#BYD RC2612F.C (54686.HK)$Stop-loss level at 99.8 yuan, providing approximately 7.7 times actual leverage with relatively low premium.
For bearish put warrants and bear contracts: BOC put warrant (23995)$BI-BYD @EP2702A.P (23995.HK)$With a strike price of 90 yuan, it offers about 3.2 times leverage, making it the highest-leveraged put warrant in its category with both the lowest premium and implied volatility. For bear contracts, J.P. Morgan bear contract (62446)$JP#BYD RP2808D.P (62446.HK)$Stop-loss level at 119 yuan, offering approximately 13.9 times actual leverage, the highest among similar bear contracts with the lowest premium; UBS Group bear contract (69184)$UB#BYD RP2812I.P (69184.HK)$Stop-loss level at 116.5 yuan, providing approximately 19.6 times actual leverage, high leverage with low premium, suitable for defensive strategies anticipating price resistance leading to pullbacks.
The timing for entering these CBBC products should be determined based on whether the stock price breaks through 116.2 yuan or pulls back to 105.4 yuan; avoid random operations at the midpoint of the range.
Market Observation
As for performance and fundamentals, as @I am happy.、@Hu śƹ has stock options、@dazzle, dazzle, dazzleThe question is whether earnings have the potential to become a breakthrough catalyst, but the current price already reflects some expectations. If it fails to drive a significant breakout above 111 yuan, the stock price may remain in consolidation mode. The fundamental aspect still provides support, but short-term movements depend more on capital inflows and technical breakouts.
Regarding whether the trend is weak, for instance, @Faint and dim, faint and dim, with a touch of brightness., @RebuttalTeamLeader@反駁隊隊長, the structure currently does not indicate typical weakness. Despite repeated consolidations or even bearish candlesticks, the overall trend remains in high-level sideways movement rather than reversing into a downtrend. Only a drop below 105 yuan would confirm a failed consolidation and shift to weakness.
Some investors are concerned about whether the price has reached the top of the range, such as @GapFillingGame@補裂口遊戲. At this stage, the price is indeed close to a resistance zone, but there is no clear topping signal yet. A more reasonable interpretation is 'high-level consolidation pending change,' rather than 'already peaked.'
Regarding whether to short sell, as mentioned by @MysteriousPowerInsider@神秘力量動向知情者, it is currently not an ideal position for shorting. Since the stock price is still in the upper-middle range of consolidation, before breaking below 105 yuan, the risk-reward ratio of shorting is unattractive and could easily lead to a short squeeze from a rebound.
Concerning capital structure, as mentioned by @Rip off the farm、@'¶Faintly, faintlythe divergence between domestic and foreign capital and the lack of synchronization with the broader market reflect that the stock is in a consolidation phase. Capital has yet to form a unified direction, causing the trend to move sideways rather than unilaterally.
As for entry strategies, as discussed by @(ƖǷ(ƖǷ爓ųǷƖų、@cowcow_kwok, it would be more reasonable to wait for a pullback to the 105-106 yuan zone before making a move. If opting for a breakout strategy, one should wait for the stock price to break above and stabilize at 111 yuan, which would confirm a strengthening trend.
For investors who have already entered the market, such as @Yang Zining (entered at RMB 109.5), the current price is within a slightly fluctuating range. Strategically, it is advisable to observe whether the RMB 105 support holds. If it remains intact, holding is still viable; if broken, risk control measures should be considered.
Overall, BYD is currently in a strong consolidation phase at higher levels, but before breaking through key resistance, the risk-reward ratio is moderate. Deployment should primarily focus on 'breakout confirmation' or 'pullback accumulation,' rather than chasing highs.
Friendly Reminder: This article does not constitute any investment advice.
This article is for reference only and does not constitute any investment advice. The market data, opinions, and analysis contained herein may change at any time without prior notice. We are not responsible for any loss or damage caused by reliance on the information in this article. Technical analysis only shows whether certain technical conditions are met; a comprehensive assessment of asset performance should combine other data and should not solely rely on this article to make trading decisions. Please note that past performance is not indicative of future results. Follow Jenny's insights on Hong Kong stock warrants for more professional analysis.
Risk Disclaimer: The above content only represents the author's view. It does not represent any position or investment advice of Futu. Futu makes no representation or warranty.Read more
Thumbs Up
2
34K Views
Report
Comments
Write a Comment...
2