
Two major banks are both bullish—has gold passed its worst moment?
Gold and Stagflation: Opportunities Amid Crisis
By Chen Ningdi and Ma Xingkong
When the French once again moved their gold stored in the US back to their home country
A report released by Radio France International on April 4 caught everyone's attention. In the 2025 fiscal year earnings announcement published by the Bank of France, an 'extraordinary item' was disclosed, recording income as high as 11 billion euros. This income came from the sale of 129 tons of gold originally stored in the underground vaults of New York, USA, at the end of 2025 to early 2026, followed by repurchasing the same amount in Europe. This operation not only generated significant income but also cleverly relocated France's gold stored in the US back to its homeland. This 'relocation' incurred no transportation or insurance costs, avoided political conflicts, and produced substantial income, achieving three goals with one move!
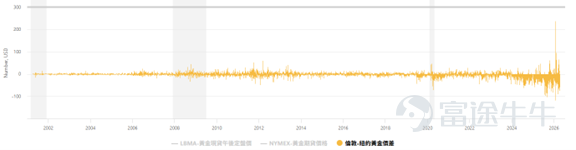
According to the explanation from the Bank of France, this action involved selling non-standard gold bars originally stored in the US on the New York market and then purchasing an equivalent amount of gold on the London gold market in Europe. Since the New York gold market is futures-dominated while the London gold market focuses on spot trading, the prices in both markets are very close but have slight differences. The price difference between New York gold and London gold is approximately 30-50 USD per ounce. Additionally, the recent exchange rate between the US dollar and the euro has been volatile. The Bank of France first sold the gold on the New York market, then took advantage of low buying and high selling to convert it into euros, and finally purchased London gold. Through high selling, low buying, and exchange rate operations, the Bank of France earned 11 billion euros, turning an original loss of 2.9 billion euros into an annual profit of 8.1 billion euros.

Figure 1: Over the past three years, London gold has shown a price difference of 30-50 USD per ounce compared to New York gold, Source: Macromicro
01
Echoes of history: Independent France as a pioneer in resisting dollar hegemony
Although the French central bank claimed that this operation was not politically motivated, the action inevitably brings to mind France's activities 60 years ago. At that time, the global monetary system was under the Bretton Woods regime, with the US dollar pegged to gold at a rate of $35 per ounce and other currencies pegged to the dollar. As the relative economic strength of the United States declined, along with diminishing gold reserves and excessive issuance of dollars, it led to a situation where the US did not have enough gold reserves to back the dollars in circulation.
In 1965, then French President Charles de Gaulle delivered the famous 'Gold Speech,' criticizing the 'exorbitant privilege' enjoyed by the US dollar in the international monetary system. De Gaulle immediately announced the purchase of 267 tons of gold for $300 million, airlifting it directly to Paris. According to records from the French central bank, between 1963 and 1966, France conducted a secret operation called 'Empty the Pockets,' transporting a total of 3,313 tons of gold through 24 shipments and 35 air transports. In 1971, the year the Bretton Woods system collapsed, France also brought back gold worth $191 million, weighing over 55 tons, from the United States.
At the end of World War II, the United States held more than 70% of the world’s total gold reserves, but this figure continuously decreased. By the time Nixon closed the gold window in 1971, the US gold reserves accounted for only 30% of the global total.

Figure 2: U.S. Gold Reserves as a Share of Global Total Over the Years, Source: "China and the World: Mid-Year Economic Analysis and Outlook"
France’s high-profile actions also prompted other countries to follow suit. The Netherlands, Belgium, Switzerland, and others repeatedly brought gold back from the US and successively exited the Bretton Woods system. Germany, another major capitalist power, also possessed substantial gold reserves but exercised greater restraint compared to France when repatriating gold. This was because Germany bordered Eastern Bloc countries and relied on US troops for national defense. The US had threatened to withdraw its troops unless Germany refrained from converting dollars into gold, compelling Germany to exercise restraint in exchange for continued US military protection. In contrast, France had an independent military force and successfully detonated atomic and hydrogen bombs in 1960 and 1968 respectively, becoming the fourth nuclear-armed nation. France had the power to say 'no' to the US. France even announced its withdrawal from NATO in 1966, rejoining only in 2009. Independent military strength gave France greater independence and more freedom in its monetary and economic policies.
Does this recent move by the French central bank signal the beginning of a new cycle of gold accumulation?
China has been purchasing gold for 17 consecutive months, with the January and February 2026 purchases amounting to 1.24 tons and 0.93 tons, respectively. However, in March, China significantly increased its gold purchases to 4.98 tons, reaching a 12-month high. Additionally, according to data from the World Gold Council, in January 2026, global central banks’ net gold purchases were only 5 tons, below the 2025 monthly average of 27 tons. However, in February, net gold purchases by global central banks rebounded sharply to 27 tons, aligning with the 2025 average.

Figure 3: The People's Bank of China has been purchasing gold for 17 consecutive months; Source: Bloomberg
Central banks resuming gold purchases reflect nations’ assessments of the future international economy: the US-Iran conflict has become a protracted struggle, and the long-term trend of rising oil prices is becoming increasingly evident. At the same time, the credibility of the dollar is declining. Against this backdrop, gold may become the new anchor for currency!
02
Similar rhyme: Signs of stagflation are becoming increasingly apparent.
On April 12, negotiations between the US and Iran broke down at the last minute, with the US announcing a maritime blockade of the Strait of Hormuz starting from April 13. The prospect of US-Iran conflict once again became uncertain, with global energy shortages worsening. In this scenario, the stagflation of the 1970s could make a comeback.
In 1973 and 1979, two oil crises erupted successively, cutting off Middle Eastern oil exports, throwing the world into an energy shortage. Developed countries led by the US experienced economic stagnation and rising prices, known as stagflation.

Figure 4: U.S. CPI and GDP, Source: Wind, Dongwu Securities Research Institute
This chart shows the economic growth rate and inflation rate of the US during the 1970s. The two peaks in the US inflation rate occurred during 1973-1975 and 1978-1984, which were exactly the periods when the two oil crises occurred. Global oil prices soared, driving up production costs, pushing the US inflation rate to 10-15%, while GDP saw negative growth. The US unemployment rate reached 8% in 1975 and exceeded 10% in 1983.
If we look back at history, we find that the current situation is very similar to the Vietnam War that began in 1955. In the early stages of the Vietnam War in 1961, the US initially refrained from active involvement, intervening through 'special warfare.' Following the Gulf of Tonkin incident in 1964, the US Congress officially declared war. During the same period, US fiscal deficits expanded, and France began leading the charge to redeem gold. This is highly similar to the current situation! Initially, Israel and Iran clashed, with the US merely providing equipment support and remote bombing. In March 2026, the US might become directly involved, potentially falling into a prolonged conflict, with France again moving gold away from the US. If developments follow the Vietnam War pattern, with the US Congress declaring war, the US could once again fall into the stagflation of the 1970s. History may repeat itself.
Opportunities often lie hidden within crises. While the US encountered stagflation, Japan and Germany actually benefited and experienced rapid development. Take Japan's automotive industry as an example. Japan foresaw the rise in future energy prices early on. Thus, at the 1967 'Japanese Automobile Industry Air Pollution Symposium,' they established long-term goals for reducing emissions and fuel consumption, focusing on developing low-emission, economical cars. Japan fully leveraged its meticulous craftsmanship spirit, significantly improving production efficiency. Japanese auto workers' productivity was 4-6 times that of their American counterparts: single-worker production numbers for American manufacturers like General Motors and Ford were less than 10 units, whereas Toyota and Nissan reached 40-60 units.

Figure 5: Number of vehicles produced per worker at Japanese and U.S. automakers; Source: "The Development of Japan's Automotive Industry"
High production efficiency was reflected in the prices. In the 1970s, a typical small Japanese economy car cost around $2,800 (e.g., Toyota Corolla), while an American car (such as Chevrolet Impala) cost about $3,400. On average, a Japanese car was $500-$1,000 cheaper than an American one. Additionally, Japanese cars outperformed American ones in fuel consumption, with Japanese vehicles achieving 25-30 miles per gallon, compared to just 10-12 miles for American cars. Amid rising gasoline prices, this further enhanced the competitiveness of Japanese cars.
Under the onslaught of inexpensive Japanese cars, the American auto market was quickly dominated by Japan. From 1970 to 1980, Japan’s automobile exports surged from under 500,000 units to 4.5 million units, becoming a major global car exporter and capturing over 22% of the US auto market share.

Figure 6: Post-Plaza Agreement Appreciation of National Currencies Against the U.S. Dollar, Source: Federal Reserve
To address the impact of Japanese products on domestic American industries and resolve the US trade deficit, the United States held a meeting with Japan, the UK, France, and Germany at the Plaza Hotel in New York in 1985, signing the Plaza Accord. The agreement required other countries' currencies to appreciate against the US dollar to alleviate the US trade imbalance. Following the agreement, the yen appreciated from 250.7 yen per dollar in February 1985 to 121 yen in November 1988, an appreciation of 116%. The Deutsche Mark rose from 3.3 marks per dollar in March 1985 to 1.63 marks in December 1987, appreciating by 102%. The French franc and British pound also appreciated by 76% and 75%, respectively.
After the rapid appreciation of the yen, Japan's GDP expanded quickly. In 1985, Japan’s GDP was $1.43 trillion, while the US GDP was $4.34 trillion, making Japan's GDP 32% of the US's. By 1995, Japan's GDP had grown to $5.5 trillion, while the US GDP stood at $7.64 trillion, meaning Japan's GDP had risen to 70% of the US's. Japan's economy entered what was called the "bubble era," characterized by rampant speculation and rapidly rising asset prices. It was claimed that the total land value of Tokyo's 23 wards alone could buy the entire United States.
While the US was mired in stagflation, Japan rapidly developed its domestic industries, leveraging cost advantages to dominate the US market. Now, signs of a new round of stagflation are emerging. In this cycle, which economy will seize the opportunity that Japan once did? The answer is simple: countries with strong industrial bases and complete industrial chains stand to benefit during stagflation. Who today can rival China's industrial capabilities? China’s advantage is even more pronounced than Japan’s in the 1970s. With a vast domestic supply chain and a comprehensive industrial system, China’s economic resilience is stronger than Japan's island economy!
03
Rocket and Feather: The Transmission Mechanism of Rising Oil Prices
During the oil crisis of the 1970s, the US responded to inflation by significantly raising interest rates, with the federal funds rate reaching as high as 20% in 1981. Simultaneously, the US promoted the globalization of the dollar, tying it to oil, thereby making the world share the burden of excessive dollar issuance. Will history repeat itself this time?
Let's first analyze the impact of rising oil prices at the micro level.
First and foremost, the rise in crude oil prices directly affects retail gasoline and diesel prices. Since March, US gasoline prices have surged. According to the Energy Information Administration, the average price per gallon reached $3.638 (equivalent to $0.96 per liter), the highest level since September 2023. On March 23 and April 7, China's National Development and Reform Commission announced two consecutive increases in refined oil prices. Since 2026, domestic oil prices have cumulatively risen by nearly 30%. Refined oil prices in China are now entering the 9-yuan era, with refueling a car costing over 100 yuan more.
Some consumers might think, 'I drive an electric vehicle; rising oil prices don't affect me,' or 'I don't take flights, so fuel price hikes won't impact me.' However, the effects of rising oil prices go far beyond these areas, permeating all aspects of daily life, including clothing, food, housing, and transportation. Think about it—besides everyday commuting, where else are vehicles used? The answer is freight transport. Therefore, the second wave of price increases comes from transportation. All freight on highways relies on petroleum, and rising oil prices will directly increase transportation costs across society. After this round of price hikes, filling up a truck’s diesel tank will cost over 500 yuan more. These costs will directly push up the prices of express delivery services, fruits, vegetables, and more, affecting every household.
The third wave of price increases will affect plastics. The raw material for plastic products is oil, with about 85% of plastics derived from naphtha, a byproduct of crude oil. Naturally, rising oil prices will drive up the costs of downstream products. Plastics are ubiquitous in daily life, from packaging materials, plastic bags, foam, to ABS plastics used in home appliances—all will be affected by rising oil prices. Additionally, many synthetic pharmaceuticals, such as aspirin and acetaminophen, are derived from benzene extracted from oil. The impact of rising oil prices on these downstream products will become evident in about 1-3 months.
The fourth wave of price increases will hit clothing, likely occurring 3-6 months later. For example, winter coats, hiking jackets, sneakers, and sportswear we commonly wear are made from polyester fibers, nylon, and other synthetic fibers, which are primarily derived from oil. The production cycle for clothing is about 3-6 months, meaning the winter clothes set to hit shelves this fall were ordered in March, just as oil prices were climbing. Thus, when purchasing clothes in November, their prices will reflect the current oil price levels. Clothing pricing is typically 5-10 times the cost of raw materials. Therefore, a 1-yuan increase in costs could result in a 5-10 yuan increase in retail prices. For instance, a hiking jacket priced at 1,000 yuan may have raw material costs of only 200 yuan. A 10% rise in oil prices would increase the cost to 220 yuan, but the retail price might rise by 100 to 200 yuan. Similar logic applies to sneakers and other goods.
The fifth wave is food. The impact of rising transportation costs on food has already been mentioned, but this is the second round of price hikes for food. Fertilizers, which are essential for agriculture, have raw materials including natural gas and coal, whose prices are linked to oil prices. Countries along the Persian Gulf supply about a quarter of the world's urea exports. Since March 2026, global urea prices have risen from $400 per ton to $700 per ton. This will directly affect the cost of agricultural products. Rising fertilizer prices lead to higher grain prices, feed prices, and meat prices. Agricultural production takes time, so the full effect of these price increases will only become apparent after one planting cycle, roughly in 3 to 6 months.
Therefore, the rise in oil prices does not just affect oil; its impact permeates every aspect of life, increasing the operational costs of society as a whole. It is already April now, and the prospects of negotiations between the US and Iran remain unclear. The US has even announced plans to blockade the Strait of Hormuz. Assuming that the US-Iran conflict can be resolved before May, can the impact of rising oil prices be avoided? The reality may not be so optimistic. First, oil extraction equipment cannot be restarted immediately after being shut down; it takes time to restore production capacity. Additionally, oil prices have already experienced an increase from March to May, and their effects will continue to trickle down the industrial chain, with the real impact potentially not fully manifesting until the end of the year. So even if the US-Iran conflict is quickly resolved now, future price increases have already been set in motion. Raw materials have been ordered, costs have risen, and the current oil prices are affecting future prices.
In economics, there is a theory known as 'rockets and feathers,' which suggests that when production costs rise, companies raise prices rapidly like rockets, but when production costs fall, prices drop slowly like feathers. The principle behind this is that in a seller's market, when costs increase, companies quickly raise prices to avoid losses. However, when costs decrease, companies tend to treat the premium as extra profit or as a buffer for future price reductions. This results in one-sided stickiness in prices: very sensitive to increases but slow to decrease.
Due to the reasons mentioned above, the energy shortage caused by this US-Iran conflict is bound to trigger long-term price increases. We are putting so much effort into analyzing the transmission mechanism of oil prices because this is a widespread phenomenon that Western countries will face. However, China is an exception.
04
China’s Steadfastness: Why Is China Still Experiencing Deflation?
In March 2026, US inflation rebounded, rising 3.3% year-over-year, up significantly from the previous 2.4%. This reflects the impact of rising energy prices on US prices.

Figure 7: US CPI Index, Source: Investing.com
On the other hand, China’s inflation is not as pronounced. According to data released by the National Bureau of Statistics on April 10, China's CPI fell 0.7% month-over-month in March, while rising 1.0% year-over-year. The PPI increased 1.0% month-over-month and 0.5% year-over-year. Against the backdrop of rising global oil prices, China’s prices remain low. Why is this the case?

Figure 8: China’s 2026 CPI, Source: National Bureau of Statistics of China
First, China has a complete industrial chain and a large domestic market. The main issue currently faced is over-supply and insufficient demand. Therefore, the increase in raw material prices is first absorbed within the industrial chain and does not directly pass on to consumers as it does in the US. Moreover, state-owned enterprises dominate the petrochemical sector, and their ability to withstand price fluctuations is significantly stronger than that of international counterparts driven solely by shareholder interests. They generally do not arbitrarily raise prices.
Secondly, the impact of a blockade of the Strait of Hormuz on China's oil supply is not as significant as outsiders believe. First, China has abundant strategic oil reserves. South Korea’s crude oil reserves can only support about 50 days, while Japan’s reserves can last around 225 days. Although China has not disclosed its oil reserve figures, Societe Generale stated that China has established approximately 1.5 billion barrels of strategic oil reserves, sufficient to cover about 200 days of oil imports. At the same time, China is an important oil-producing country, ranking fifth globally with production reaching 4.7 million barrels per day, giving it more control over energy security. Additionally, China’s oil imports come from diversified sources. The top four suppliers are Russia (18%), Saudi Arabia (14%), Iraq (11%), and Malaysia (11%). Although about 40% of China’s imported crude oil passes through the Strait of Hormuz, a significant portion comes from Iran. It is estimated that approximately 90% of Iran’s crude oil exports go to China. While Iran may block the Strait of Hormuz, it would not cut off its own oil exports. From January to March 2026, China’s cumulative crude oil imports reached 146.838 million tons, up 8.9% year-on-year, showing no signs of disruption in oil imports. Citrini Research, an independent U.S.-based research institution, found during field investigations in the Strait of Hormuz that actual navigation volumes far exceed the measurements recorded by the AIS (Automatic Identification System) tanker system.
Therefore, China’s exposure to this energy crisis is much smaller than that of Japan and South Korea. About 90% of Japan’s crude oil imports pass through the Strait of Hormuz, and in March 2026, its crude oil imports were approximately 52.03 million barrels, down about 30% month-over-month. South Korea’s crude oil import prices surged 88.5% month-over-month in March, marking the largest historical increase. If the blockade of the strait persists, a major crisis in South Korea is expected by May, while Japan may endure until the second half of the year. Both countries currently rely on the U.S. for new oil supplies. The U.S. will also face pressure from its allies Japan and South Korea to resolve the blockade issue quickly. In contrast, China demonstrates greater strategic composure during this crisis.
Every crisis presents an opportunity, and the U.S.’s struggles with the Iran issue provide a chance for the renminbi to enhance its influence! Deutsche Bank strategist Mallika Sachdeva analyzed in a report on March 24 that the Iran conflict is testing the role of the U.S. dollar as the global currency for oil trade. The report cited media reports stating that one of Iran’s conditions for allowing ships to pass through the Strait of Hormuz is payment in renminbi. As Iran’s long-term partner and largest oil customer, China plays a key role in this process. Although the petrodollar system will not collapse overnight, nor will its cracks heal immediately—petroyuan has already opened a gap.
Iran also announced that it will require all tankers passing through the Strait of Hormuz to pay tolls. The fee is reportedly $1 per barrel, meaning a tanker carrying 2 million barrels would pay $2 million in tolls. Iran demands that these tolls be paid in cryptocurrency. Due to sanctions, currency devaluation, and external threats, Iran has increasingly turned to cryptocurrencies for payments domestically. According to Chainalysis, the use of Bitcoin and stablecoins within Iran has reached approximately $7.8 billion. If Iran further requires toll payments in cryptocurrency, the crypto ecosystem could expand significantly. Amid expectations of stagflation, the energy crisis, and the decline of dollar hegemony, Bitcoin, as digital gold, may once again highlight its role as a store of value.
On April 10, 2026, the Hong Kong Monetary Authority granted HSBC and Anchor Point Fintech licenses to issue stablecoins, bringing the issuance of the Hong Kong dollar stablecoin closer to reality. Could the Hong Kong dollar stablecoin play a role in this crisis? Could China promote the Hong Kong dollar stablecoin as a currency for international energy trade? Could Iran accept payments in Hong Kong dollar stablecoins? These questions hold infinite possibilities.
Darin Holdings (1709.HK), the first RWA stock in Hong Kong, has been deeply engaged in the digital currency sector for years. Since the second half of 2025, Darin has acquired over 9,000 high-performance mining machines and deployed mining farms in the United States, Oman, and Paraguay, with a total computing power of approximately 4 EH/s, producing nearly 200 Bitcoins so far. Currently, over 9,000 mining machines continue to operate, generating about 2 Bitcoins daily, with an expected total output of 800 Bitcoins by the end of the year.
Additionally, Darin has invested in Anyi Group through a Limited Partnership Fund (LPF), directly tying itself to Anchor Point Fintech, the issuer of the Hong Kong dollar stablecoin. Darin Holdings’ investment in Anyi Group is not purely financial but involves holding equity in Anyi Group via an LPF, making it an official shareholder. Darin has placed Anyi Group shares into the LPF, tokenizing fund interests compliantly, thereby deeply integrating with this Web3 giant through equity participation and sharing in the benefits of the stablecoin license.
On October 16, 2025, Darin announced a comprehensive strategic partnership worth up to $200 million with Antalpha, a leading global digital asset financial services platform, to allocate tokenized gold assets. Darin has completed the initial $5 million investment in Tether Gold (XAU₮) and plans to acquire or distribute up to $100 million in RWA gold assets, specifically Tether Gold, over the next 12 months.
The Hong Kong Special Administrative Region Government’s plan to repatriate 2,000 tons of gold reserves is proceeding as planned. With the issuance of Hong Kong stablecoin licenses and the advancement of RWA compliance, a Web3-compliant closed loop of 'stablecoin payments + tokenized assets + licensed channels' has been established. Stablecoins solidify blockchain settlement foundations, while RWAs activate the on-chain circulation of physical assets. It is foreseeable that Hong Kong’s influence in international financial markets will grow significantly in the future. Darin is honored to be a core participant and early adopter in Hong Kong’s stablecoin ecosystem, actively contributing to the construction of digital financial infrastructure and supporting Hong Kong’s development as an international financial center.
05
Conclusion
1. France is accelerating the repatriation of its gold reserves from the U.S., and China has begun a new cycle of gold purchases. The importance of gold has once again been proven.
2. The prolonged US-Iran conflict has increased the risk of stagflation. Rising oil prices will lead to a widespread increase in prices across society.
3. China holds a strategic advantage amid stagflation. With low energy risks, it is less affected by the blockade of the Strait of Hormuz; meanwhile, China's vast industrial system holds critical value under stagflation expectations.
4. The importance of the Renminbi in oil trade is increasing, providing an opportunity to break the US dollar monopoly and boost the international status of the Renminbi. The Hong Kong stablecoin supports the internationalization of the Renminbi.
5. Digital gold - Bitcoin has demonstrated strong resilience in international conflicts, becoming part of Iran’s efforts to bypass financial blockades, once again verifying Bitcoin’s robust security, anonymity, and scarcity. Iran’s move could mark the starting point for the next Bitcoin price rally.
6. Whether it is the Hong Kong stablecoin or gold, Delin Holdings has made early strategic moves, securing key positions, and holds a place in the development of Hong Kong as an international financial center.
Author Introduction:
Ningdi Chen, a graduate of the University of Chicago with an Honors Bachelor's degree in Economics and Statistics, has over 26 years of experience in the global financial industry. He founded Delin Securities and Delin Family Office and was previously a licensed responsible person for Type 1, 4, and 6 licenses granted by the Hong Kong Securities and Futures Commission. He currently serves as Chairman of the Board, Executive Director, and Chief Executive Officer of Delin Holdings Group, Vice President of the Hong Kong Limited Partnership Fund Association, and authored 'The Era of Wealth Transformation: Discovering Counter-Cyclical Survival Wisdom.'
Ma Xingkong graduated with a bachelor's degree from the Chinese University of Hong Kong and a master's degree from Tsinghua University. He served as the chief planner of 'Caijing Langyan' and is currently the chief economist at Delin Holdings, as well as the executive dean of the Delin New Economy Research Institute. He is a licensed holder of Hong Kong SFC Type 4 license and authored several best-selling books, including 'Trade Capability Shapes National Capability,' 'Where Are Your Investment Opportunities,' and 'Hope Amidst Depression.'
Disclaimer
This article is for reference only. Investors should make investment decisions based solely on the information provided in company announcements.
The information and materials contained on this platform, including text, graphics, links, or other items, are sourced from third-party information terminals and are intended for general reference only. Under no circumstances does the information published on this platform constitute investment advice.
No one is allowed to reproduce content without authorization from this official account.
The content involved in WeChat is for reference only. Copyright belongs to DL Holdings and related content providers. For the disclaimer, please refer to the official website of DL Holdings: https://www.dl-holdings.com/
Risk Disclaimer: The above content only represents the author's view. It does not represent any position or investment advice of Futu. Futu makes no representation or warranty.Read more

Comments
to post a comment
2