
Inflation heats up, central banks turn hawkish! Is the wind changing for gold prices?
Zijin Mining's rebound is showing strong recovery, with the next key resistance zone between HKD 38.7 and HKD 39.8.
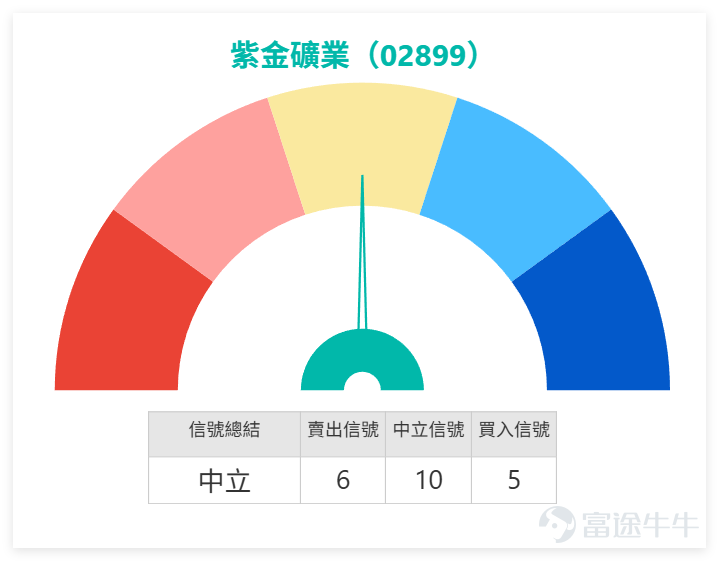
Looking at the gold and metal mining sector, market performance on the previous day (April 14) showed divergence. $ZIJIN MINING (02899.HK)$
and $CMOC (03993.HK)$Up 3.32%, $JIANGXI COPPER (00358.HK)$Up 3.04%Both recorded significant gains, while $SD GOLD (01787.HK)$and $ZHAOJIN MINING (01818.HK)$ saw a slight decline.
In terms of technical signals, Shandong Gold and Zhaojin Mining received 'Buy' signals, making them the key stocks to watch for potential rebounds within the sector. In contrast, Zijin Mining, Luoyang Molybdenum, and Jiangxi Copper all have 'Neutral' technical signals. This reflects that although Zijin shows a 'strong rebound recovery' on an individual stock basis, from a systematic technical perspective, its short-term trend confirmation is not stronger than some peers. Most stocks in the sector are still trading below the MA60, indicating that the current rise is generally seen as a technical rebound after overselling, and whether the medium- to long-term trend will reverse remains to be observed.

Zijin Mining closed at 37.70 yuan on the previous day (the 14th), up 3.01% for the day. From a trend perspective, the share price had previously fallen from a high of 46.98 yuan and continued to test lower levels until finding more noticeable support at 31.66 yuan. It then began to gradually stabilize and has recently risen back above the 5-day, 10-day, and 20-day moving averages, reflecting that the short-term rhythm has shifted from weak to stable, with buying dominance showing marked improvement compared to before. At this stage, the positioning is no longer simply a weak downtrend but rather a rebound recovery following a mid-term correction, with signs of further strengthening in the short term.

Looking at the moving average system, Zijin Mining's current price is already above the 5-day line at 36.88 yuan, the 10-day line at 35.87 yuan, and the 20-day line at 35.70 yuan, while also approaching the 30-day line at 37.65 yuan and remaining above the 120-day line at 36.53 yuan. This indicates that this rebound is not just a one-day spike but shows certain structural improvements. In other words, the share price has now regained footing above multiple short- to medium-term moving averages, with the overall pattern appearing significantly healthier than before. However, there is still important resistance at the 60-day line at 39.81 yuan, so until it breaks through 39.8 yuan, it is more appropriate to classify the current situation as a strong rebound recovery rather than a fully confirmed return to a mid-term uptrend.
Regarding the Bollinger Bands, the middle band is around 35.70 yuan, the upper band around 38.72 yuan, and the lower band around 32.68 yuan. The current price of 37.70 yuan is already clearly above the middle band and quite close to the upper band, reflecting that the recent rebound momentum has indeed strengthened, entering a relatively strong zone in the short term. This trend typically suggests that the share price may continue to test higher levels due to inertia, but as it approaches the upper band and resistance zone, if it fails to see further volume expansion in the short term, it could experience oscillation or consolidation near 38.3 to 38.7 yuan. If it can effectively break through 38.72 yuan and maintain operations above the middle band at 35.70 yuan, the overall rebound could upgrade further; conversely, if it falls back near the middle band, the current rally is likely just a corrective rebound.
In terms of momentum, the short-term RSI is around 66.5, and the mid-term RSI is approximately 54.0 to 49.8, indicating that short-term momentum has clearly strengthened and is approaching the upper limit of the strong zone but has not reached extreme overbought levels. This means the share price still has room for upward movement, though buying at the current level is less attractive compared to when it was at a lower position. Regarding trading volume, the previous day (the 14th) saw about 61.4 million shares traded, supporting the price increase, which presents a positive pattern of rising prices with increasing volume. This reflects that the current rebound is not entirely unsupported by volume but involves a certain amount of capital participation. If trading remains active or increases further as the price approaches 38.5 to 39.8 yuan, the credibility of a breakout would improve.
Market chatter also reveals the current divergence in sentiment. @ClassicVersionAndy Lau mentioned that if the price stabilizes near the lows of 35.68 yuan or 36.5 yuan, the trend could turn into a V-shaped rebound. This view aligns closely with the current technical picture, as the range between 35.7 yuan and 36.9 yuan is indeed the most crucial support area in the short term. As long as this area holds, the overall rebound structure remains intact.@喵了个咪咪6From a longer-term perspective, although leading companies in the industry may rise slowly, they tend to be more resilient during downturns. This view has some foundation because stocks like Zijin Mining typically experience fewer extreme sharp rebounds or crashes. Instead, their movements generally progress along with the cycles of metals and resources.
On the other hand, the market also features many conservative or even bearish voices. @Wen Wen Er Ya De Ke Lai Men Te feels like it might just be a one-day play, or even worries about a significant crash at the open. Such opinions mainly stem from the recent high volatility in resource stocks, causing investors to question the sustainability of single-day gains. @Ri Ri Sheng Xin mentions continuing to 'dig pits,'@以後唔再買妖股 which carries a heavy sense of disappointment. These views reflect that some investors still lack confidence in rebounds following pullbacks. However, purely from a chart perspective, the current stock price is no longer in its worst phase, as it has regained key short- to medium-term moving averages, distinguishing it from truly weak stocks.
From a short-term tactical viewpoint, the first support level is around 37.00 to 36.90 yuan, near the current price and the 5-day moving average. Further support lies between 35.70 and 35.90 yuan, where the 10-day, 20-day moving averages, and Bollinger Band midline converge. On the resistance side, the immediate resistance is between 38.30 and 38.70 yuan, corresponding to today's high and the upper Bollinger Band. A major resistance above that is at 39.80 yuan, near the 60-day moving average. This indicates that although Zijin Mining currently shows a relatively strong structure, it is gradually approaching a resistance zone. Therefore, an ideal approach would not be chasing highs on rallies but observing whether the price can stabilize above 36.90 to 37 yuan before challenging 38.70 yuan. If it effectively breaks through with supportive trading volume, the rebound could officially strengthen.
In summary, Zijin Mining is currently showing a relatively robust rebound, with short-term sentiment clearly improved. Technically, it has regained multiple short- to medium-term moving averages and is no longer in a weak position overall. However, since the current price is nearing the resistance zone between 38.30 and 39.80 yuan, chasing at this point offers less attractive risk-reward compared to earlier low-level entries. Thus, while the outlook remains moderately positive, it is advisable to wait for confirmation of support before deploying strategies, or follow up cautiously after a confirmed breakout above 38.70 yuan.
Based on the above analysis, the strategies for deployment can be divided into the following main approaches:


For more market analysis, stay tuned to Jenny's daily updates on 'Hong Kong Stock Warrants'!
Reminder: This article does not constitute any investment advice.
This article is for reference only and does not constitute any investment advice. The market data, opinions, and analysis contained herein may change at any time without prior notice. We are not responsible for any loss or damage caused by reliance on the information in this article. Technical analysis only shows whether certain technical conditions are met; a comprehensive assessment of asset performance should be conducted using additional data. Decisions to trade should not be based solely on this article. Please note that past performance is not indicative of future results.
#HKStocks #ZijinMining #Real-TimeAnalysis #WarrantPick #WarrantGuide #DerivativesHedging #HKWarrantsJenny #Blue-ChipStocks #TechnicalAnalysis
Risk Disclaimer: The above content only represents the author's view. It does not represent any position or investment advice of Futu. Futu makes no representation or warranty.Read more
Comments
to post a comment