How much upside potential does Tencent have after its technical recovery phase?
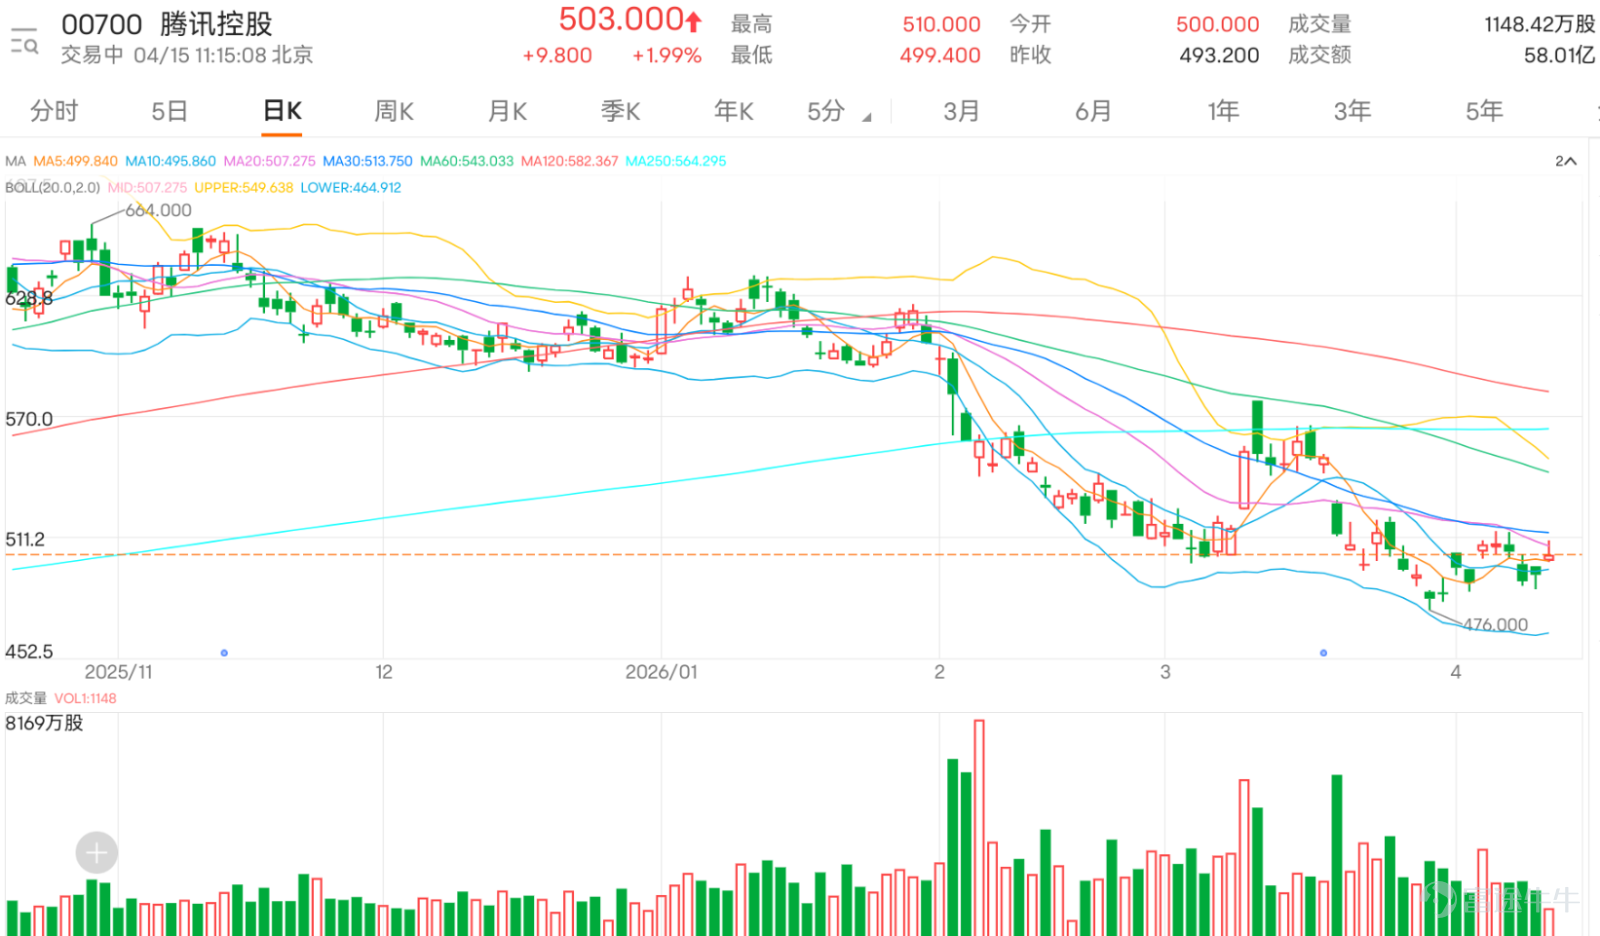
$TENCENT (00700.HK)$ Currently trading at HKD 503, up 1.99%. The share price has retreated significantly from HKD 625 and found support only after falling to HKD 474. Recently, it has been consolidating in the lower range. Although the stock has stabilized somewhat from its lows, from an overall technical perspective, the mid-term weakness has not yet been reversed. Therefore, the current situation is better viewed as a post-decline stabilization and technical recovery rather than a resumption of an upward trend.
From the moving average system perspective, Tencent's current price remains below the 20-day line at HKD 509.50, the 30-day line at HKD 514.25, the 60-day line at HKD 545.11, and the 120-day line at HKD 583.40, indicating that the short-, medium-, and long-term structures are still weak. At present, the share price is back above the 5-day line but has not managed to break through stronger resistance levels above. Therefore, the most important thing in the short term is not whether the stock rebounds but whether it can first stabilize above HKD 500.80. If it fails to break through this level, the overall trend will remain a tug-of-war in the lower range under weak consolidation.
In terms of the Bollinger Bands, the middle band is at HKD 509.50, the upper band at HKD 555.27, and the lower band at HKD 463.73. The current price is clearly below the middle band but still some distance away from the lower band, indicating that while the stock has stopped plunging, it has not yet escaped the weak zone. This pattern typically suggests that there may be conditions for a short-term technical rebound, but if it cannot return near the middle band, it’s hard to say that the trend has truly reversed. If the price subsequently breaks through HKD 500 and gradually approaches the middle band at HKD 509.50, the rebound may expand; otherwise, the stock is more likely to continue fluctuating between HKD 486 and HKD 500.

In terms of momentum, the RSI is around 42.1, remaining in a neutral-to-weak zone, reflecting that while short-term momentum has stabilized compared to before, no clear strengthening signal has emerged. In terms of trading volume, there has been no sustained increase recently, suggesting that funds remain cautious about the current level. The market is more focused on short-term fluctuations and quick rebounds rather than aggressively buying into the stock. In other words, Tencent's biggest issue right now is not a lack of buying interest but insufficient buying power to support a stable breakout above the moving averages.
Market commentary actually reflects this contradiction very clearly.@L-CEO Some bluntly say that no positive news can lift Tencent, questioning how much bearish pressure remains. This view aligns closely with the current chart sentiment as Tencent's rebound indeed lacks strength and it hasn't been able to effectively reclaim key short-term resistance levels. @23561682 believes bears are still bold, while @24682338 directly says going short is profitable. These voices reflect a continued lack of market confidence in Tencent’s short-term performance.
However, some investors have started to notice potential buying opportunities at lower levels and the possibility of a rebound. @@雨木88 believes the bears are losing control, mentioning that the pressure from shorts has peaked. This corresponds to a key point in the current technical analysis: there is support near HKD 486, and as long as it holds, the rebound structure isn’t completely broken. @明平一鷹 mentioned support at 486.8, which is close to the technical short-term defense zone. @胖胖貓 feels that buying is starting, indicating that while the market isn’t completely without support at these low levels, the buying power is still insufficient to fully improve the trend.
For those leaning bullish, such as @231484330 who mentioned buying, @@日日升鑫 mentioned building positions, @@12059231 also said they added to their positions. From a purely short-term risk-reward perspective, this strategy isn’t entirely unreasonable. The immediate target is around HKD 507.90, with a stop-loss near HKD 486. The expected reward is approximately 2.98%, and the risk about 1.46%, giving a risk-reward ratio of about 2.04 – suggesting there is still room for short-term trading. However, a critical premise is that the support near HKD 486 must hold, and ideally, we should see the price stabilize above HKD 500.80 to push the rebound higher.
Many in the market are also focusing on the psychological level of HKD 500. @@莉莉的世界 mentioned first stabilizing above HKD 500 before discussing further upside. This statement is quite accurate because for Tencent, the immediate focus isn’t about being overly optimistic but proving it can reclaim the HKD 500 level. @清秀的凯特 asked if it could reach HKD 510; technically, it’s not impossible, but the prerequisite is to firmly hold above HKD 500.80, then push towards HKD 507.90-514.30. Otherwise, expecting higher levels now would still be considered aggressive.
As for concerns based more on news flow, such as @著名刺客 and @一白合狼 mentioning XChat's impact on WeChat, these statements may affect market sentiment. But from the current technical charts, the market primarily continues to trade Tencent’s inherent weak structure rather than letting a single concept completely rewrite its trend. Comments from @32965752 and @做空美股被大A, representing higher-cost holders or bearish positions, also reflect Tencent’s biggest issue: many investors still don’t see enough clear evidence of a turnaround from the charts.
In summary, Tencent is likely still in a weak consolidation phase with an attempt at technical recovery. The short-term key support is at HKD 486; as long as it holds, the stock can be seen as trying to rebound after consolidating at lower levels. However, until it clearly stabilizes between HKD 500 and HKD 500.80, it should be treated as merely technical recovery, not a full-blown reversal. If it breaks above HKD 500.80, the rebound could extend to HKD 507.90-514.30. Conversely, if it breaks below HKD 486, be prepared for another test of support near HKD 474.

Reminder: This article does not constitute any investment advice.
This article is for reference only and does not constitute any investment advice. The market data, opinions, and analysis contained herein may change at any time without prior notice. We are not responsible for any loss or damage caused by reliance on the information in this article. Technical analysis only shows whether certain technical conditions are met; a comprehensive assessment of asset performance should be conducted using additional data. Decisions to trade should not be based solely on this article. Please note that past performance is not indicative of future results.
#Hong Kong Stocks #Real-time Analysis #Warrant Picks #Warrant Strategy #Derivatives Hedging #HK Warrants Jenny #Tencent #00700 #Tech Stocks #Technical Analysis $Hang Seng Index (800000.HK)$$Hang Seng TECH Index (800700.HK)$
Risk Disclaimer: The above content only represents the author's view. It does not represent any position or investment advice of Futu. Futu makes no representation or warranty.Read more

Comment (1)
to post a comment
4