
The US-Iran peace talks present conflicting narratives! What’s next for oil prices?
CNOOC drops near key support zone; a hold above 25.6 to 26 yuan is necessary for a technical rebound.
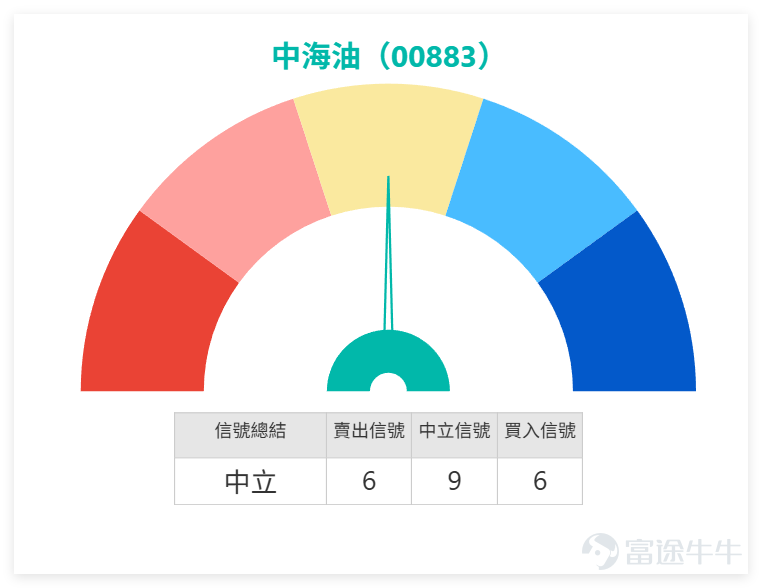
From the perspective of the overall energy sector, the market performance was mixed on the previous day (April 14). $PETROCHINA (00857.HK)$ A slight drop of 0.55% to 10.91 yuan, although the technical aspect still maintains a bullish arrangement, its RSI has reached 61, entering the overbought zone, and received a 'sell' signal from the technical system, indicating greater short-term adjustment pressure. In contrast, $SINOPEC CORP (00386.HK)$ The stock fell 1.07% to 4.62 yuan on the day. Despite the weakening share price, the technical system issued a "strong buy" signal, suggesting that it has entered an oversold technical state and there is potential for a rebound. $CHINA SHENHUA (01088.HK)$ and $CHINA COAL (01898.HK)$ Stock movements were mixed, with technical signals showing "buy" and "sell" respectively. This indicates significant differences in short-term momentum within the sector due to varying technical positions of individual stocks. Compared to peers, $CNOOC (00883.HK)$
the technical signal is "neutral," and its trend focuses more on testing key support after pulling back from highs rather than following extreme overbought or oversold signals within the sector, avoiding sharp fluctuations.

CNOOC's closing price on April 14 was 26.60 yuan, down 0.15% for the day. From an overall trend perspective, the stock had gradually risen from around 22.22 yuan and reached a high of 30.98 yuan, completing a fairly complete upward wave. However, after approaching the 31-yuan mark, the stock failed to break through further. Recently, it began to retreat from its highs and dropped to 26.60 yuan. This shows that the current main characteristic is no longer maintaining strength but transitioning into a weaker consolidation phase after falling from highs.
From the moving average system, CNOOC's current price is fluctuating near the 5-day line at 26.51 yuan, but remains significantly constrained by the 10-day line at 27.25 yuan, the 20-day line at 28.32 yuan, and the 30-day line at 27.95 yuan. This suggests that the short-term rhythm has shifted from earlier strong advances to adjustments and digestion. Although the 60-day line at 25.84 yuan is not far below the current price, and both the 120-day and 250-day lines remain upward-trending, indicating that the long-term trend has not completely turned bearish, the short-term outlook is clear: the stock is still testing support levels without any definitive signs of stabilization. In other words, CNOOC is closer to undergoing post-rally adjustment, waiting to find a bottom or establish support, rather than immediately resuming an upward trend.

Regarding the Bollinger Bands, the middle band is around 28.32 yuan, the upper band is approximately 31.05 yuan, and the lower band is about 25.59 yuan. The current price of 26.60 yuan has retreated to the lower half of the channel and is quite close to the lower band, reflecting that after a round of adjustments, the stock has entered a weaker short-term zone. This trend has two important implications: First, the stock is indeed approaching a level where a technical rebound might occur; second, until it reclaims the middle band at 28.32 yuan, overall strength remains unlikely. Therefore, the most critical observation point now is not whether it has fallen enough, but whether the area between 25.6 yuan and 26 yuan, near the lower Bollinger Band and the 60-day line, can form stable support.
In terms of momentum, the short-term RSI is around 34.1, showing clear weakness and nearing the weaker zone, though it hasn't entered the extremely oversold region yet. This indicates that recent correction pressures persist, but the stock is starting to approach a level where a technical rebound may occur. Regarding trading volume, yesterday (April 14) saw about 82.92 million shares traded, without any particularly noticeable surge in volume during rebounds, suggesting the market is currently focused on consolidation. Looking back recently, larger trading volumes occurred during the pullback from highs, indicating some funds exited at higher levels. The recent drop in volume suggests selling pressure, while not fully gone, has cooled compared to the initial stages of profit-taking. If the stock stabilizes near 25.8 yuan to 26 yuan with gradually decreasing volume, it would be a positive signal for forming a base; however, if support breaks with increasing volume, deeper corrections should be anticipated.
Market chatter actually reflects what confuses investors most about CNOOC right now.@Nanco@nickname_with_special_characters, @Li_Sansi2555 all asked the same question: Why doesn’t it rise when oil prices rise, but falls when oil prices drop? This reflects that market expectations for CNOOC are no longer solely tied to oil price movements but are more concerned with whether the stock is still in a profit-taking cycle after a rally. Current charts indicate the latter scenario, meaning the stock is in a digestion phase after a rally. Thus, even if oil prices provide short-term stimulus, it may not immediately reverse technical weakness.
On the other hand, some investors have started paying attention to support zones and earnings factors.@失落的牛君 Mentioning a drop as an opportunity to buy and waiting for earnings reports indicates that the market is starting to see the current level as an accumulation zone. However, the premise of such deployment remains that the support zone between HKD 25.60 and HKD 26.00 must not be broken. @UnreservedFatty believes there could be a retest of lower levels before another rise. This scenario is technically not entirely impossible because the share price is indeed close to the lower Bollinger Band and the 60-day moving average. If support holds successfully, a technical rebound would be a reasonable expectation. @OxTendon even directly targets HKD 30, but this goal still seems ambitious at this stage because CNOOC needs to first reclaim the range between HKD 26.90 and HKD 27.30, then the range between HKD 27.95 and HKD 28.32, before it can gradually push towards above HKD 29.
As for news and external factors,@233583649Mentioning oil prices surging over 9% in a single day, @StrikingAndrew said that this price does not seem to reflect a war premium, while @HappyMoneyMaking thinks the market appears to have become desensitized to WTI movements. These perspectives reflect investors' current questions about CNOOC—not merely about fluctuations in oil prices, but why the oil price factor has temporarily failed to effectively translate into stock price gains. Technically speaking, the reason is straightforward: CNOOC is currently still in a consolidation phase after a pullback from highs. Market focus on it has shifted from 'whether it can reach new highs' to 'whether this round of adjustments is nearing its end.'
From a short-term deployment perspective, the first support level is between HKD 26.00 and HKD 25.60, which represents the lower Bollinger Band and recent lows. Further support lies near HKD 25.84, corresponding to the 60-day moving average. If that breaks, the next key levels to watch are around HKD 24.80 and HKD 23.40. Resistance-wise, the first resistance zone is between HKD 26.90 and HKD 27.30, followed by HKD 27.95 to HKD 28.32. A breakout beyond these levels would open the possibility of revisiting levels above HKD 29. This suggests that CNOOC's current characteristic is being near the support zone, but without confirmation of a reversal in downward momentum. Therefore, the short-term reward-to-risk ratio falls under 'conditional observation rather than clear buying opportunities.' The ideal approach is to first observe whether effective support forms between HKD 25.60 and HKD 26.00, then decide on deploying for a technical rebound. If the price directly falls below HKD 25.60, a defensive stance should be prioritized, avoiding premature conclusions that the adjustment is complete.
In summary, CNOOC is currently in a pullback-consolidation phase following an uptrend. The long-term trend has not completely deteriorated, but the short-term structure has weakened significantly and is at a critical juncture of testing the support zone. Although the current price is near the lower Bollinger Band and 60-day moving average, offering some conditions for a technical rebound, no clear signs of a bottom have emerged yet. Therefore, it's unwise to be overly aggressive at this stage. What truly deserves attention is whether the support zone between HKD 25.60 and HKD 26.00 can hold firm. If it holds, it can be considered the starting point of a technical rebound; if it fails, the correction may continue.
Based on the above analysis, the strategies for deployment can be divided into the following main approaches:


For more market analysis, stay tuned to Jenny's daily updates on 'Hong Kong Stock Warrants'!
Reminder: This article does not constitute any investment advice.
This article is for reference only and does not constitute any investment advice. The market data, opinions, and analysis contained herein may change at any time without prior notice. We are not responsible for any loss or damage caused by reliance on the information in this article. Technical analysis only shows whether certain technical conditions are met; a comprehensive assessment of asset performance should be conducted using additional data. Decisions to trade should not be based solely on this article. Please note that past performance is not indicative of future results.
#HKStocks #CNOOC #Real-TimeAnalysis #WarrantPick #WarrantGuide #DerivativesHedging #HKWarrantsJenny #Blue-ChipStocks #TechnicalAnalysis
Risk Disclaimer: The above content only represents the author's view. It does not represent any position or investment advice of Futu. Futu makes no representation or warranty.Read more

Comment (1)
to post a comment
2