Alibaba Surges Nearly 5%: Analysis of Rebound Potential and Key Levels
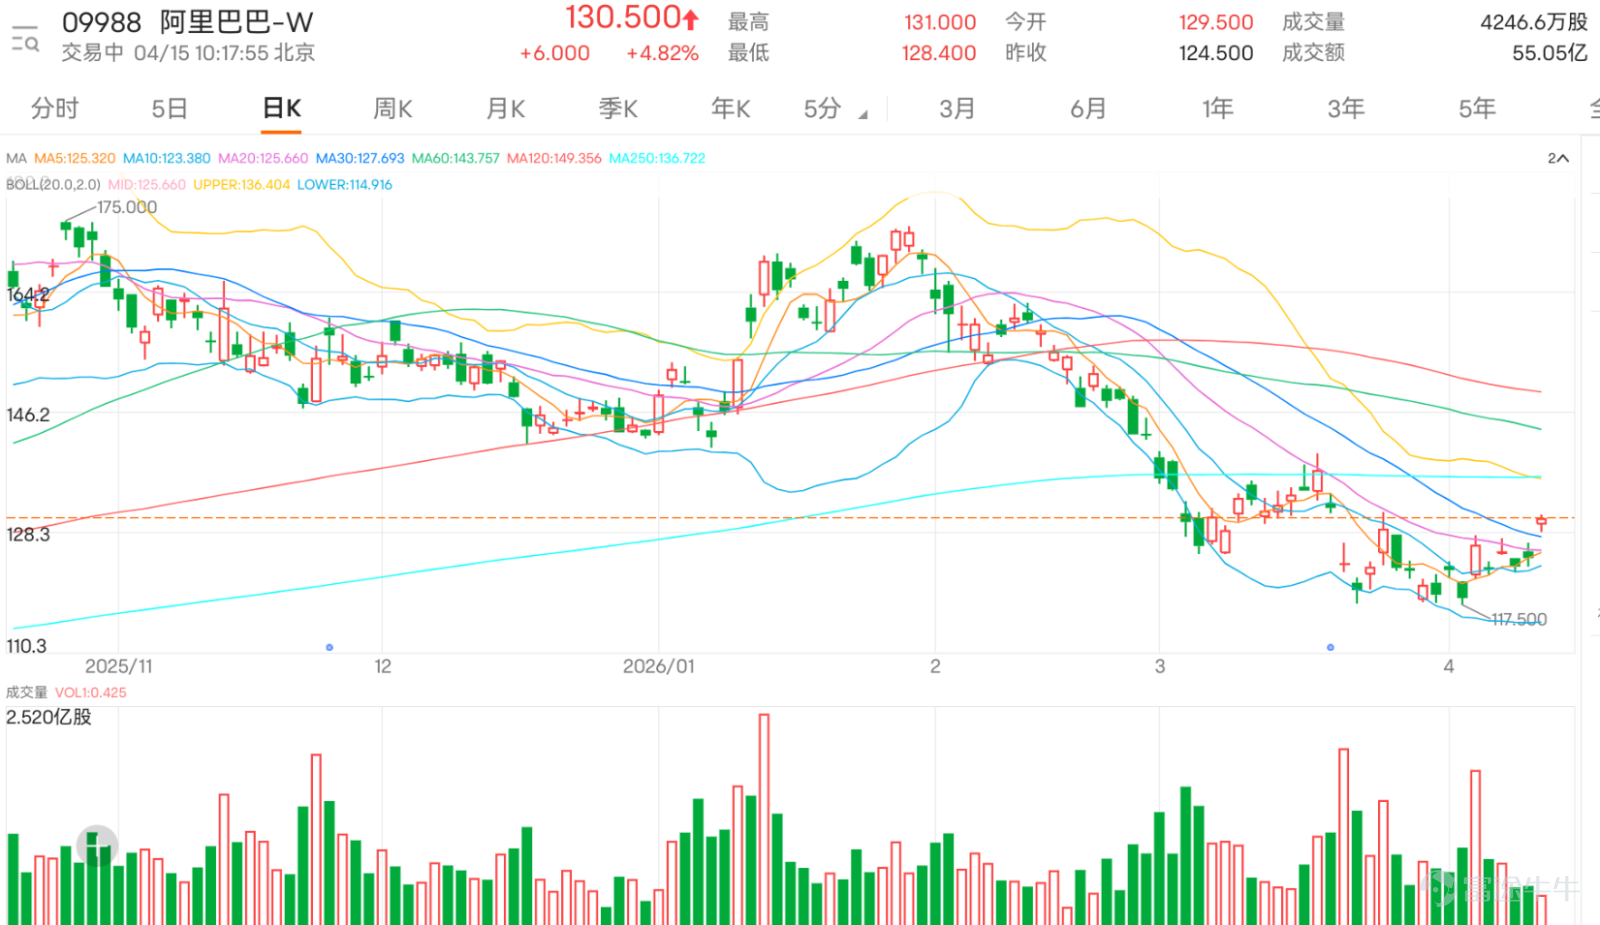
$BABA-W (09988.HK)$ Currently trading at HKD 130.5, up 4.82%. Looking at the overall trend, the share price had repeatedly pulled back from a high of HKD 174.20, then continued to test lower levels, with a recent low of HKD 117.50 before gradually stabilizing. Afterward, it began consolidating in a lower range, and recently has started to slowly recover. This indicates that the stock price is indeed more stable compared to before, but at this stage, it is still more appropriate to characterize the movement as a rebound after bottoming out rather than a true reversal of the medium-term weakness.
In terms of the moving average system, Alibaba's current price has re-established itself above the 20-day line at HKD 125.76 and the 30-day line at HKD 127.7, indicating a short-term improvement in sentiment. However, it remains constrained by the 60-day, 120-day, and 250-day lines, reflecting that this is still just a technical recovery following a weak consolidation, rather than a full-fledged strengthening. In simple terms, while there are signs of short-term recovery, it cannot yet be considered the start of a new upward wave until prices stabilize between HKD 128.1 and HKD 130.
Regarding the Bollinger Bands, the middle band is approximately at HKD 125.76, the upper band around HKD 136.72, and the lower band near HKD 114.80. If the price can effectively stabilize between HKD 128 and HKD 130 going forward, it may challenge the range of HKD 131 to HKD 136.5. If it fails to hold above the middle band, the overall price is more likely to remain fluctuating within the range of HKD 120 to HKD 128.
In terms of momentum, the short-term RSI is approximately 51.3, having gradually recovered from weaker levels to a neutral position, indicating that selling pressure has eased somewhat, though buying power isn't yet strong enough to create a definitive bullish signal. Regarding trading volume, the rise in price has not been accompanied by particularly strong volume, suggesting that while market sentiment has improved, there hasn’t been a strong consensus among investors to aggressively chase higher prices. In other words, Alibaba’s current movement looks more like a stabilization-driven recovery rather than a breakout driven by significant institutional buying.

Market commentary can actually reflect the current divergence in sentiment. @@uUSSThe mention that if there is positive news, the stock price may rise to 130, this view is not entirely without technical basis because as long as the mid-rail of 125.8 and the resistance at 128.1 can be reclaimed, the stock price indeed has a chance to approach 130. @@陳可新Looking directly at reaching 150 in May, this target remains relatively aggressive at this stage because Alibaba first needs to overcome the short-term resistance zone between 128.1 and 130, and then gradually repair the upper moving averages; it’s not advisable to set sights too far ahead just yet.
On the other hand, there are also quite a few cautious voices. @@飛奔Some believe it looks promising but advise against buying too early, which is actually a very reasonable attitude because Alibaba's current price is close to the short-term resistance zone, and blindly chasing in only offers moderate betting value. @GreaterBayFinancialRelics also reminds that one should wait for stabilization before entering, aligning well with the current chart analysis. @momochu feels that tomorrow might see a pullback leading to a decline—this scenario cannot be fully ruled out at this stage, especially if the stock price fails to stabilize above 128.1, with a reasonable fluctuation range being a drop back to around 123 or even 122.
As for discussions on fundamentals and competition, @BearishPropertyBullishStocks mentions that AliExpress’ pricing has leveled with $MEITUAN-W (03690.HK)$Flatten, and$PDD Holdings (PDD.US)$and the latter holds more advantage, reflecting that concerns about Alibaba extend beyond charts into the e-commerce competitive landscape. @OnThePathToFinancialFreedom offers a more optimistic perspective, suggesting organizational restructuring, AI investments, and improvements in food delivery could lead to valuation recovery. These two viewpoints precisely reflect Alibaba's current situation: the stock price has stabilized from its lows, but the market hasn't yet reached a consensus on its mid-term outlook, which is why the technical picture shows recovery rather than a definitive breakout.
From a strategic deployment perspective, Alibaba's immediate support lies around 123-125.76, near the 10-day line; further support is at the psychological level of 120; if this breaks, attention should be paid to the previous low at 117.50. Resistance-wise, the first key level is at 128.10, where the Bollinger mid-rail and 30-day line overlap; further resistance is between 131 and 136.5. The ideal short-term strategy would be observing whether the stock price can stabilize above 128.1; holding above this support and breaking through the mid-rail would allow the rebound to extend, otherwise, the price is likely to fluctuate within the 120-128 range.

Reminder: This article does not constitute any investment advice.
This article is for reference only and does not constitute any investment advice. The market data, opinions, and analysis contained herein may change at any time without prior notice. We are not responsible for any loss or damage caused by reliance on the information in this article. Technical analysis only shows whether certain technical conditions are met; a comprehensive assessment of asset performance should be conducted using additional data. Decisions to trade should not be based solely on this article. Please note that past performance is not indicative of future results.
#HKStocks #RealTimeAnalysis #WarrantPick #WarrantGuide #DerivativesHedging #HKWarrantsJenny #Alibaba #09988 #TechStocks #TechnicalAnalysis$Hang Seng Index (800000.HK)$$Hang Seng TECH Index (800700.HK)$
Risk Disclaimer: The above content only represents the author's view. It does not represent any position or investment advice of Futu. Futu makes no representation or warranty.Read more

Comments (2)
to post a comment
3