
English
Back
Open Account
港股窩輪Jenny
commented on a stock · Apr 14 15:29

BYD's strong consolidation may test previous highs: Holding above $108 could continue to be bullish, while a break below that level might trigger a pullback to $105.

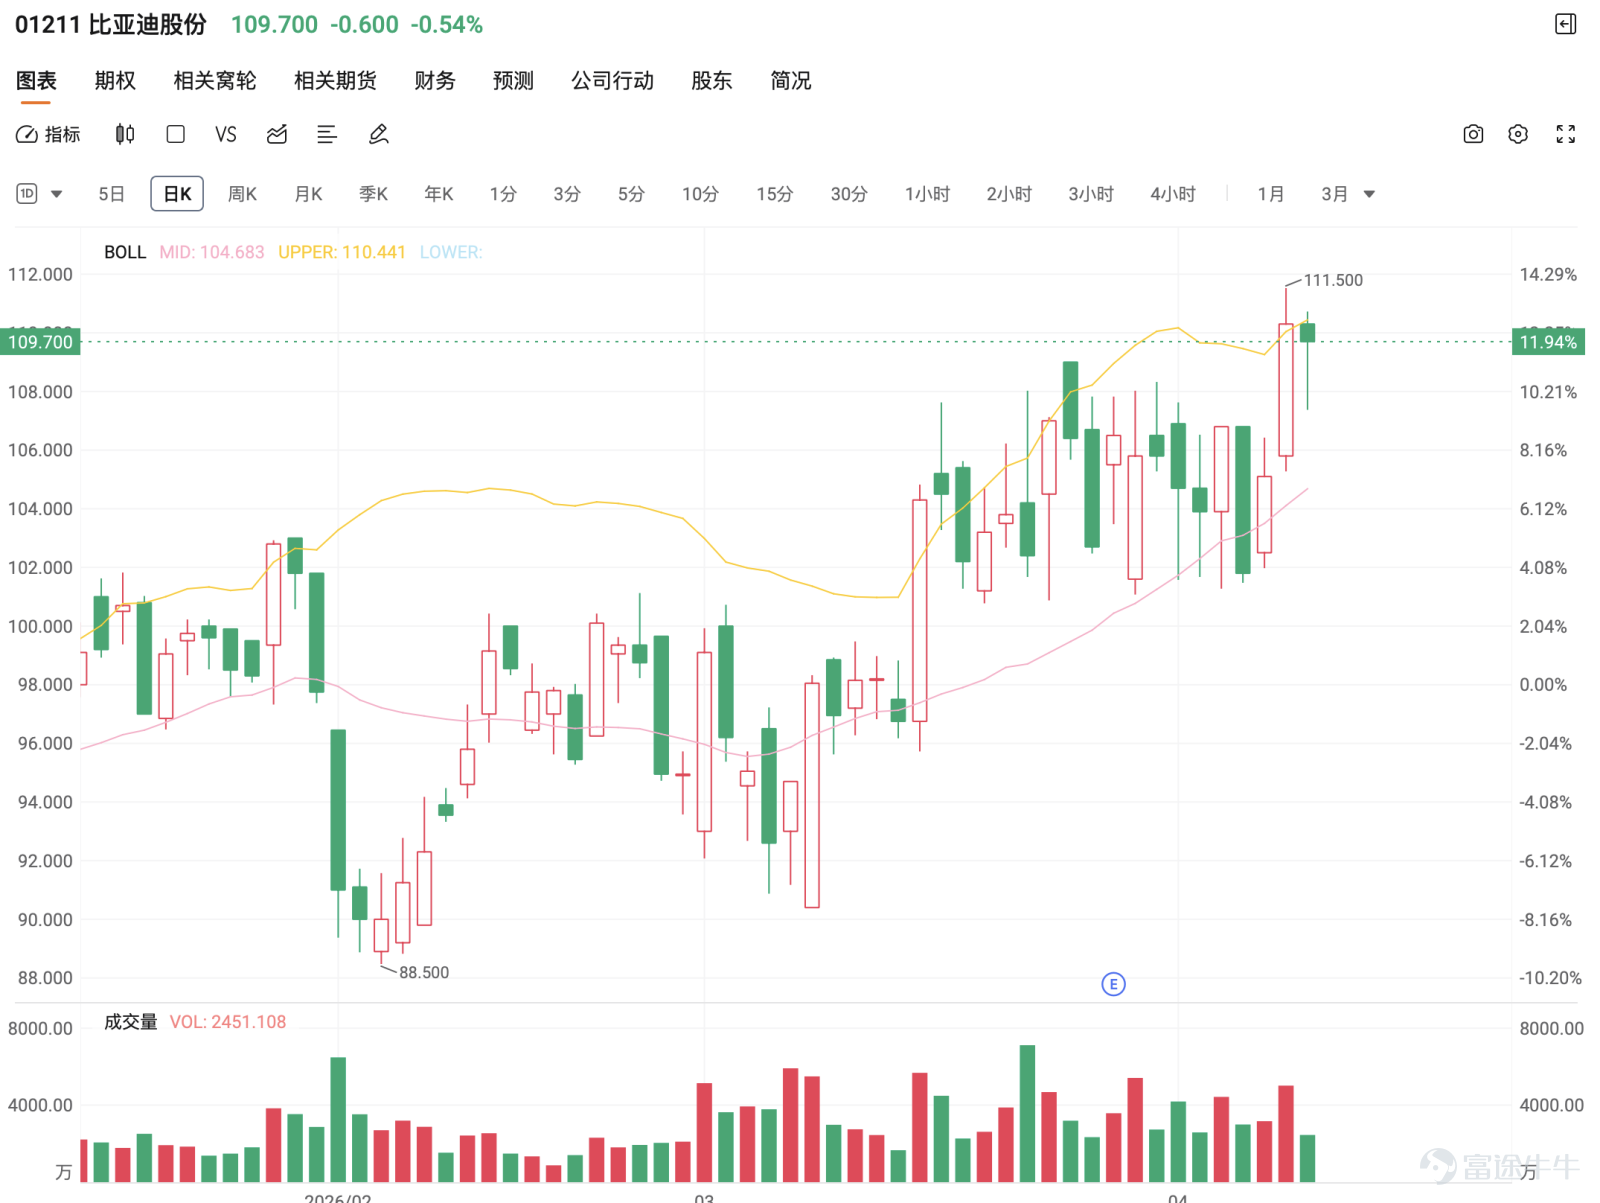
BYD (01211) faced profit-taking pressure in the early session on April 14, trading around $110, down approximately 1.6% from the prior day’s close at $110.3. The previous day (April 13), BYD surged 5.61% against the market trend to close at $111.00, with a trading volume of 3.317 billion yuan. Its subsidiary Tengshi launched a new model, driving expectations for overseas growth.
From a technical perspective, BYD's price remains firmly above the 5-day, 10-day, 20-day, 30-day, 60-day, and 120-day moving averages, and is very close to the 250-day long-term resistance level (around $110.69). On April 14, the intraday high briefly reached $110.7, indicating that this upward movement has evolved from a simple strong consolidation phase into a breakout testing phase. It is no longer just about "staying above $100," but entering a higher-level trend confirmation zone. However, the 250-day moving average has not been decisively reclaimed yet, and the price retreated after an early spike, showing that while short-term buying momentum exists, profit-taking pressure at higher levels is also starting to emerge.
BYD (01211) faced profit-taking pressure in the early session on April 14, trading around $110, down approximately 1.6% from the prior day’s close at $110.3. The previous day (April 13), BYD surged 5.61% against the market trend to close at $111.00, with a trading volume of 3.317 billion yuan. Its subsidiary Tengshi launched a new model, driving expectations for overseas growth.   From a technical perspective, BYD's price remains firmly above the 5-day, 10-day, 20-day, 30-day, 60-day, and 120-day moving averages, and is very close to the 250-day long-term resistance level (around $110.69). On April 14, the intraday high briefly reached $110.7, indicating that this upward movement has evolved from a simple strong consolidation phase into a breakout testing phase. It is no longer just about "staying above $100," but entering a higher-level trend confirmation zone. However, the 250-day moving average has not been decisively reclaimed yet, and the price retreated after an early spike, showing that while short-term buying momentum exists, profit-taking pressure at higher levels is also starting to emerge.   To @AirForceDoom@空軍末日Regarding @AirForceDoomsday’s mention of a golden cross, breaking through the bull-bear dividing line, and continuing upward, this direction currently has technical support. However, although BYD has clearly strengthened, its RSI has risen to relatively high levels, suggesting some short-term overheating, though not extreme. This is no longer the most comfortable low-price entry point. Entering the market now would be chasing the breakout rather than waiting at the bottom... If there’s a pullback, the key levels to watch will first be between $108 and $110, followed by $105.80 to $105.30. If these levels hold, it would actually make the uptrend healthier.
To @AirForceDoom@空軍末日Regarding @AirForceDoomsday’s mention of a golden cross, breaking through the bull-bear dividing line, and continuing upward, this direction currently has technical support. However, although BYD has clearly strengthened, its RSI has risen to relatively high levels, suggesting some short-term overheating, though not extreme. This is no longer the most comfortable low-price entry point. Entering the market now would be chasing the breakout rather than waiting at the bottom... If there’s a pullback, the key levels to watch will first be between $108 and $110, followed by $105.80 to $105.30. If these levels hold, it would actually make the uptrend healthier.
Regarding @CashMachine @吸錢機I have consistently emphasized that if the price holds firm at 110, you should consider adding positions. Today’s trading pattern actually answers this question well. From the chart perspective, the range between 108 and 110 was originally a significant resistance zone. On April 13, not only did the stock price break through it, but it also closed near its high, indicating that this area is gradually transforming from resistance into support. If the stock can continue to hold above 108 to 110 in the subsequent trading sessions, the credibility of this breakout will increase further, and the market will naturally start shifting its target to above 111.5 or even higher levels.
For @LittleKitty who says@小貓咪“Wait for a pullback before entering,” this mindset is very common and is not without reason. Entering now would be chasing the breakout rather than waiting for a dip at the bottom. If a pullback does occur, the key levels to watch are first between 108 and 110, followed by the range between 105.80 and 105.30. If these levels hold, it will make the upward trend healthier.
For@BlossomTrail who said “Finally broke even” and “Feels like the upcoming earnings report will look better,” these sentiments are quite typical among holders. This recent rally in BYD didn’t happen overnight; it came after a gradual structural recovery followed by an upward move. Hence, investors who just broke even, those taking profits, and those chasing new entries are all present now. Technically speaking, the most important thing right now isn’t whether to sell immediately, but whether the stock can firmly establish 110 as a new platform after this breakout. If it can, then even short-term fluctuations can still be considered part of a strong consolidation; conversely, if it quickly falls back below 108, then one must be cautious about profit-taking after the breakout.
Regarding @SuperDuperBigBigFortune @超級無敵大大大大發財’s analysis, whether previously doubting if there was distribution happening or later revising to say that volume hasn’t fully released yet and things stabilized, it closely reflects the current contradiction in the market. The hardest part about BYD’s position right now isn’t the direction but the rhythm. Although on April 14 the high touched 110.7, the closing failed to stay above 110. It remains to be seen whether the trading volume is sufficient to sustain continuous upward momentum. However, based solely on the K-line patterns over the past two days, the bias is still towards observing a continuation after the breakout rather than “pumping and dumping.”
For@WarrenBuffett'sLittleBrother said "Run fast, there will be a big market correction tomorrow," and @CharlieMangMang has long believed that with so many crabs (resistance levels) above and the 250-day moving average being difficult to break through, these bearish voices cannot be completely ignored. The current stock price has indeed reached near long-term resistance, with the 250-day line at approximately HKD 110.69 near the current price. Although the high on April 14 at HKD 110.7 was briefly broken through, the closing price retreated to HKD 108.6, widening the gap from long-term resistance. This suggests that while BYD remains strong, there is still short-term risk of profit-taking. A bullish bias is reasonable, but it is important not to overlook resistance around HKD 111.5 to HKD 112 that needs to be digested.
Fundamentally, BYD’s March auto sales exceeded 300,000 units, with overseas sales reaching about 119,600 units, a year-on-year increase of 65.2%, reflecting strong overseas momentum. The delivery volume of new energy vehicles in March also saw a month-on-month growth rate of more than 50%, providing fundamental support for the stock price. Looking ahead, the upcoming 2026 Beijing International Auto Show may further catalyze industry demand, with export-focused companies prioritized for those with mature overseas systems. Fundamental strength combined with technological breakthroughs means BYD’s mid-term prospects remain positive.
Overall, BYD has transitioned from consolidation at highs into a breakout testing pattern. Immediate downside support lies between HKD 108 to HKD 110, followed by HKD 105.80 to HKD 105.30. On the upside, initial resistance is seen at HKD 111.50, followed by HKD 113 to HKD 114. At this stage, a reasonable judgment is: as long as support between HKD 108 to HKD 110 holds, this round of breakout may continue; if prices stabilize above HKD 111.5, the trend could advance further towards higher levels.
BYD Warrant Product Recommendations
For call warrants, investors optimistic about BYD’s performance can consider UBS Group-issued warrant 18237 $UB-BYD @EC2611A.C (18237.HK)$ , with an exercise price of HKD 128.433 and leverage of approximately 5.2x, offering relatively ideal leverage and implied volatility, suitable for short-term trading following the trend;
Bank of China-issued warrant 21676 $BI-BYD @EC2610A.C (21676.HK)$ , with a strike price of 128.88 yuan and leverage of approximately 5 times, is the highest-leveraged call warrant with relatively low premium among similar products, making it suitable for more aggressive deployment once the stock price stabilizes above 108 yuan. Additionally, the 22117 issued by Citic, with a strike price of 116.88 yuan and actual leverage of about 7.6 times, is well-suited for capturing extended upward momentum during short-term breakouts. Another product, 27644 issued by Citic, with a strike price of 128.9 yuan and actual leverage of around 5.4 times, is more appropriate for medium-term strategies.
For put warrants, if you are bearish on BYD, you may consider the 17863 issued by Societe Generale $SG-BYD @EP2606A.P (17863.HK)$ , with a strike price of 100.78 yuan. It has the lowest premium and implied volatility among similar products, making it suitable for mild profit-taking hedging once the share price breaks below the support level of 108 yuan. The 17485 issued by Bank of China $BI-BYD @EP2606A.P (17485.HK)$ , with a strike price of 100.88 yuan and leverage of about 6.9 times, is the highest-leveraged put warrant with relatively lower implied volatility among similar products, making it suitable for more aggressive short positions after the downtrend is confirmed. Additionally, the 25824 issued by Citic, with a strike price of 81.88 yuan and actual leverage of about 6.4 times, is ideal for scenarios where retracement is expected to widen.
For bull and bear certificates, bullish strategies may focus on the 54686 issued by Bank of China $BI#BYD RC2612F.C (54686.HK)$ , with a stop-loss level of 99.8 yuan and relatively low premium. The 54284 issued by J.P. Morgan $JP#BYD RC2609F.C (54284.HK)$ , with a stop-loss level of 96 yuan, offers the highest actual leverage (about 7.2 times) and lower premium. For bearish strategies, the 69184 issued by UBS Group $UB#BYD RP2812I.P (69184.HK)$ , with a stop-loss level of 116.5 yuan and actual leverage of about 13.3 times, has low premium.
The 62446 issued by J.P. Morgan $JP#BYD RP2808D.P (62446.HK)$ , with a stop-loss level of 119 yuan and actual leverage of about 10.6 times, has the lowest premium. However, it should be noted that the risk associated with the stop-loss mechanism of bull and bear certificates is relatively high, especially when trading before a breakout confirmation, requiring extra caution.
Reminder: This article does not constitute any investment advice.
This article is for reference only and does not constitute any investment advice. The market data, opinions, and analysis contained herein may change at any time without prior notice. We are not responsible for any loss or damage caused by reliance on the information in this article. Technical analysis only shows whether certain technical conditions are met; a comprehensive assessment of asset performance should combine other data and should not solely rely on this article to make trading decisions. Please note that past performance is not indicative of future results. Follow Jenny's insights on Hong Kong stock warrants for more professional analysis.
Risk Disclaimer: The above content only represents the author's view. It does not represent any position or investment advice of Futu. Futu makes no representation or warranty.Read more
Thumbs Up
2
40K Views
Report
Comments
Write a Comment...
2