

Pop Mart plans to launch new products! Can the IP giant capitalize on this opportunity?

March 30th [HKEX Podcast] Part 2 - Chifeng Gold, Goldwind Technology, Pop Mart
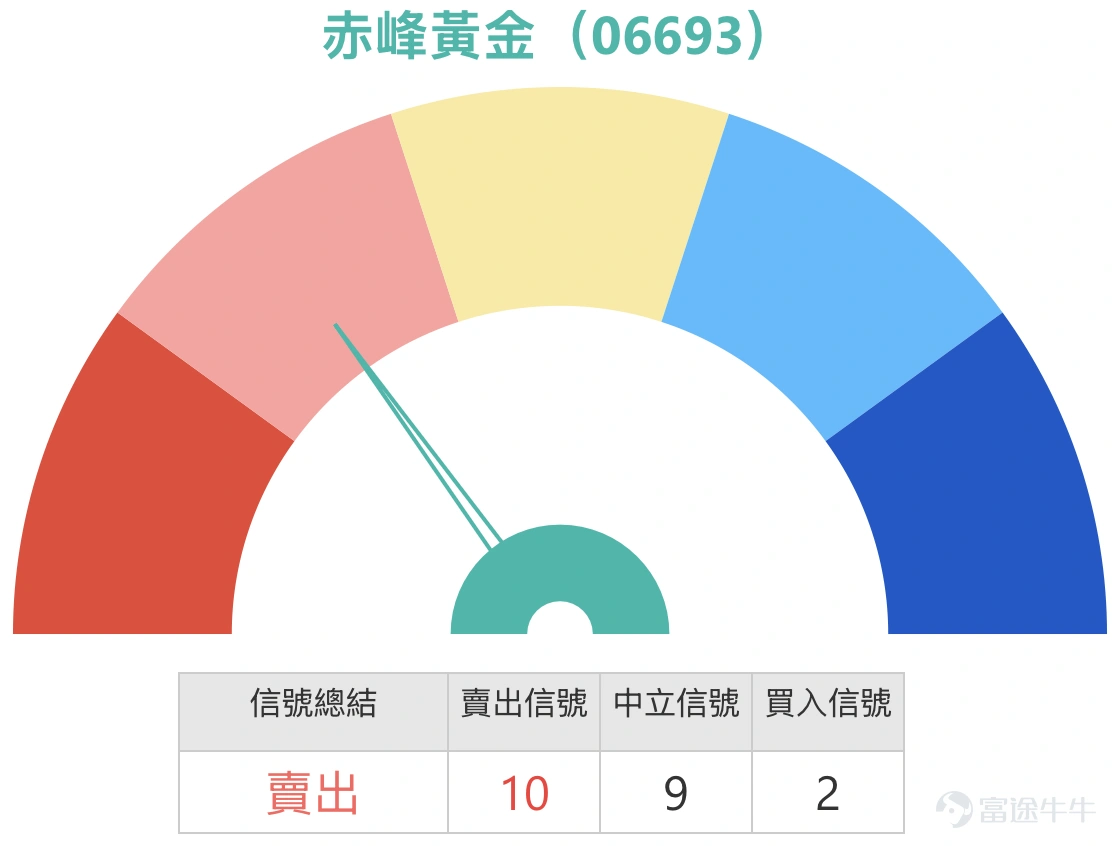
4. Chifeng Gold (06693.HK): Investors believe that a stable hold above HKD 36 will trigger a V-shaped rebound, reaching HKD 44 this week. Holding call warrants with a strike price of HKD 42.99.
Chifeng Gold is currently trading at HKD 40.92. Its recent trading range can be seen between HKD 28.38 and HKD 49.90, with an overall volatility of approximately 75.8%, classifying it as a highly volatile stock. From a short-term trading perspective, HKD 36 is indeed a critical threshold in the recent trend, as the price had previously retreated and consolidated within the HKD 33 to HKD 36 range before recovering back to around HKD 39 to HKD 41, reflecting improved short-term market sentiment. At this stage, the nearest support level is around HKD 39.55, close to the 20-day moving average; the next key support zone lies between HKD 38.25 and HKD 39.32, near the 10-day and 30-day moving averages. If these fail, HKD 36 will again become a crucial mid-term support level. On the resistance side, the immediate peak to watch is around HKD 41.20. A breakout here would open the path towards the HKD 43.66 to HKD 45.57 range, near the upper Bollinger Band and previous sideways resistance zones. Beyond that, the next target is the recent high of HKD 49.90.
Technically, the moving averages are currently intertwined, indicating that although the stock price has stabilized from its lows, it remains in a consolidation phase and is attempting to regain momentum. It hasn't yet formed a definitive upward trend. The Relative Strength Index (RSI) is around 59, which is neutral but slightly bullish, showing some recovery in buying momentum, though not yet in an extremely strong state. Regarding the Bollinger Bands, the stock price is nearing the upper band, suggesting short-term improvement. However, this also means the current price is close to short-term resistance. Without a further surge in volume to break through, upside potential may not fully open up.
To confirm an upward move, the trigger conditions are clear: the stock price needs to first rise above HK$41.20 and stabilize above HK$40, then challenge the HK$43.66 to HK$44 range. Only by breaking through this zone will the market believe the uptrend can continue. If the price only approaches HK$41 before retreating or closes below HK$39.55, it suggests the stock remains in a range-bound pattern. Downside risks are also evident; if the price falls below HK$39.55 and key moving average support at HK$38.25 to HK$39.32, it would indicate insufficient upward momentum. If the price subsequently fails to hold above HK$36, the rebound narrative will weaken, and the stock could revert to a weaker, volatile trend.
In terms of warrant capital distribution, market sentiment is highly concentrated. There are only 13 products available, all call warrants, with no put warrants, reflecting a clear bullish bias in the warrant market. Trading activity is most concentrated in the strike price range of HK$50 to HK$55, while street-level holdings are heaviest in the HK$55 to HK$60 range, showing one-sided concentration. This indicates that capital isn't just betting on the stock holding current levels but is anticipating significant further upside. However, this concentration also reflects aggressive market expectations, as the current price of HK$40.92 is still far from strike prices above HK$50. A mild rebound may not be enough to benefit these bullish positions fully.
Addressing investor concerns, the notion that holding above HK$36 signals a V-shaped rebound is partially reasonable since HK$36 is indeed a crucial support level for the recent stabilization. Holding above this level suggests the stock isn’t falling back into previous weakness. However, simply holding above HK$36 does not guarantee reaching HK$44 this week; such a view is overly optimistic, as the stock must first break through HK$41.20 and resistance near HK$43. Staying above HK$36 won't automatically lead to a straight-line rally. Regarding holding a call warrant with a strike price of HK$42.99, the strategy isn't entirely unreasonable, as HK$42.99 isn't too far from the current price. If the underlying rises to HK$44, the warrant would become more in-the-money theoretically. However, given the price is already near the upper Bollinger Band, this position carries higher risk. This setup is better suited for those who already have a position and are observing potential breakouts rather than blindly chasing higher prices. Overall, the stock has a basis for a short-term rebound, but confirmation via a breakout is needed. Investors' bullish outlook isn't entirely wrong, though their expectations for speed and magnitude are somewhat aggressive. Short-term reward-to-risk is moderately favorable but contingent on holding above HK$39 to HK$40 and successfully breaking through HK$41.20; otherwise, the reward-to-risk ratio will decline significantly.
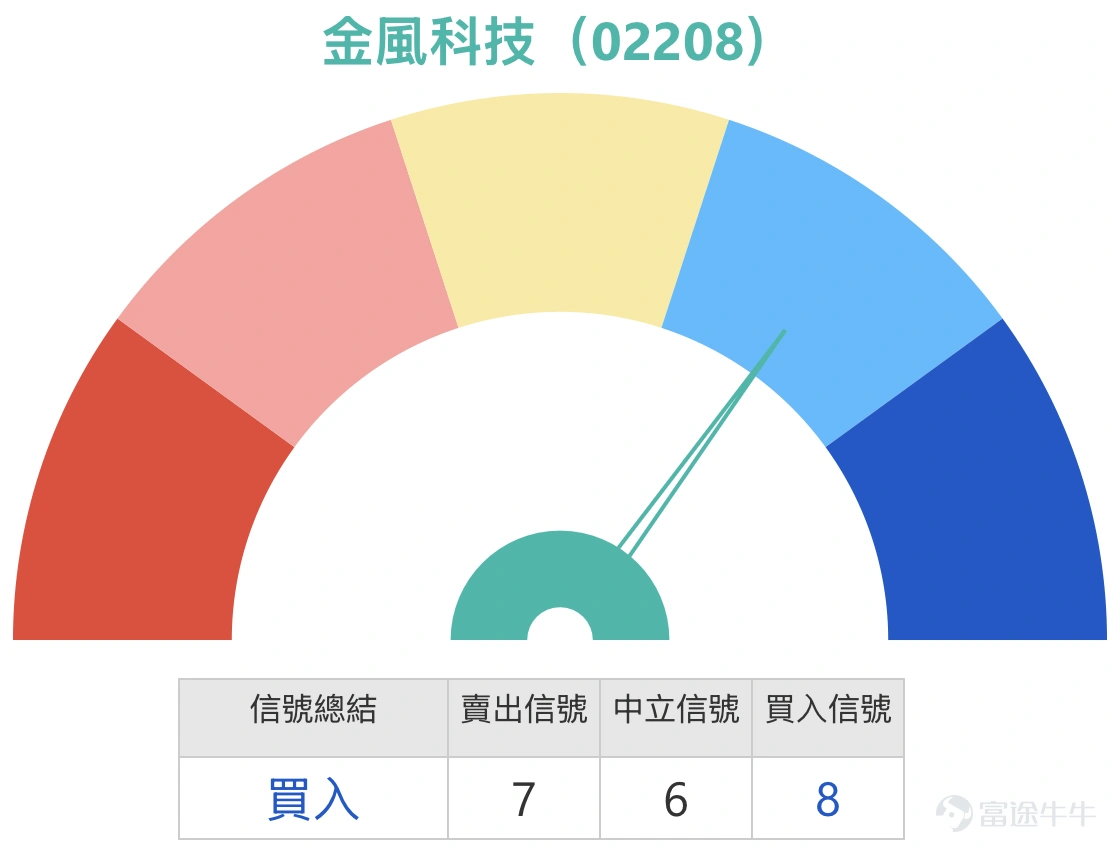
5. Goldwind Technology (02208.HK): An investor asks if the first target of HK$18 is achievable? In the warrant market, investors should focus on call warrants with a strike price of HK$19.88.
Goldwind Technology's current price is HK$14.92. Its recent trading range is between HK$12.91 and HK$18.49, with overall volatility of approximately 43.2%. From a short-term trading perspective, the stock is currently in the lower-middle part of this range, neither particularly weak nor clearly strengthening. Support levels are near HK$14.74 to HK$14.83, close to the 5-day and 30-day moving averages, as well as the nearby short-term contention area. The next support level is around HK$14.09 to HK$14.50, where the 20-day, 60-day moving averages, and recent sideways bottoms converge. If these supports fail, there’s a risk of retesting HK$13.21 to HK$13.00, with the critical low at HK$12.91. Resistance levels start at HK$15.33, the intraday high. If the price breaks through this, the next target would be HK$16.12 to HK$16.84, near the upper Bollinger Band and the previous rebound high. Above that lies the major resistance zone of HK$18 to HK$18.49.
Technically, the moving averages remain tangled, with the 5-day, 10-day, 20-day, 30-day, and 60-day lines closely aligned, indicating that the stock has been consolidating horizontally without a clear one-sided direction. The RSI is around 48 to 50, neutral, showing balanced buying and selling forces with no dominant short-term signals. Regarding the Bollinger Bands, the middle band is approximately HK$15.03, the upper band around HK$16.84, and the lower band around HK$13.21. The current price is slightly below the middle band, indicating the stock remains in the middle of the consolidation range, neither approaching the upper band nor the lower band, and is awaiting a breakout.
For further upside, the trigger condition is clear: the stock price must first rise above HK$15.33, stabilize above HK$15, and then break through resistance at HK$16.12 to HK$16.84. Only then will the market begin to raise expectations for reaching HK$18. If the price briefly spikes but fails to hold above HK$15, it suggests the stock remains in a range-bound pattern. On the downside, if the price falls below the HK$14.74 to HK$14.50 support zone, it shows insufficient short-term buying power. If it further drops below HK$14.09, there’s a risk of retesting HK$13.21 or even HK$12.91, which would weaken the short-term trend again.
In terms of warrant capital distribution, market sentiment is quite uniform. There are only 11 products, all call warrants, with no put warrants, reflecting a clear bullish bias. Trading is most concentrated in the HK$21 to HK$22 strike price range, while street-level holdings are heaviest in the HK$19 to HK$20 range, both showing one-sided concentration. This indicates that while the market is optimistic about the underlying stock’s direction, positioning is quite aggressive. Both HK$19 to HK$20 and HK$21 to HK$22 strike prices are significantly higher than the current price of HK$14.92, meaning much of the capital is betting on an extended rally rather than a minor rebound. From this perspective, while the warrant market shows consensus, this doesn't guarantee quick short-term gains; instead, it reflects more optimistic expectations compared to the stock’s current trajectory.
Returning to the investor's question about whether the first target of HK$18 is achievable, the answer is that it’s possible but not a high-probability short-term target at this stage. Rising from HK$14.92 to HK$18 represents nearly a 20.6% increase, which is ambitious for a stock still in a moving average tangle, with a neutral RSI and price action near the middle Bollinger Band. This target isn’t directly reachable—it requires breaking through HK$15.33, stabilizing above HK$16, and overcoming resistance near HK$16.84 before looking toward HK$18. Thus, targeting HK$18 as the first objective is somewhat aggressive, though not entirely unreasonable, provided there’s clear short-term breakout confirmation. Regarding call warrants with a strike price of HK$19.88, they align with the bullish outlook, but as the strike price is significantly above the current price, even if the stock reaches HK$18, the warrant remains out-of-the-money, making it a more aggressive play. Overall, Goldwind Technology’s short-term reward-to-risk is moderate, improving only if the price breaks through HK$15.33 and stabilizes. Chasing the price prematurely without confirmation carries higher risk than potential rewards.
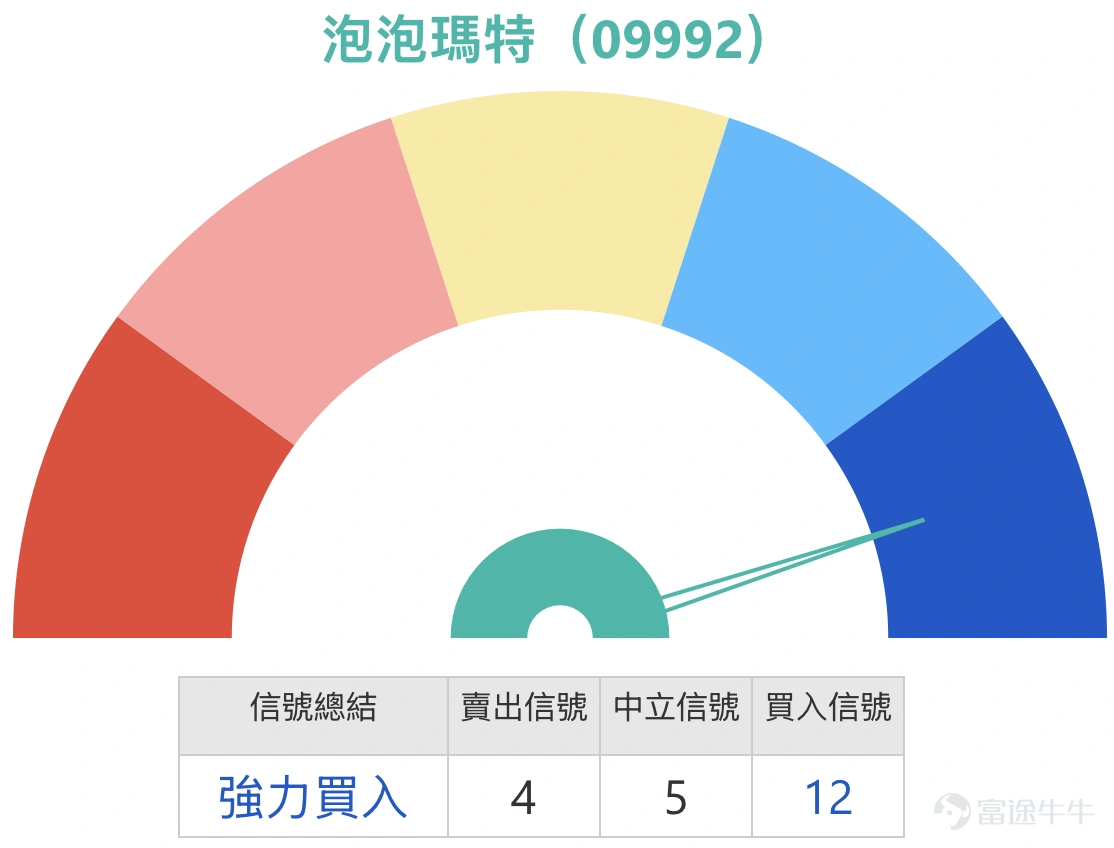
6. Pop Mart (09992.HK): How much support is there below? Investors mentioned that after the call option at 140 yuan was wiped out, it rebounded; they are now holding put options with a strike price of 150 yuan.
Pop Mart is currently trading at 148.7 yuan, nearing the lower boundary of its recent range, with short-term sentiment clearly weak. Based on the recent significant trading range, initial support can be seen at 140.1 yuan to 274.2 yuan, with overall volatility around 95.7%, making it a highly volatile stock. For short-term trading, the nearest support level to watch is 140.1 yuan, which is a recent low and also a level the market is observing closely for potential retests. If this level fails, it would indicate that the downtrend has not yet stabilized. On the resistance side, the first area to watch is 152.8 yuan to 153.6 yuan, near the lower Bollinger Band retracement and the day’s high. Above that, the next resistance lies near 166.9 yuan, close to the 5-day moving average, while major resistance is in the 189.6 yuan to 198.3 yuan zone, where both the 10-day and 20-day moving averages reside, indicating considerable short to medium-term selling pressure.
From a technical perspective, the moving averages are clearly sloping downward, with the 5-day MA below the 10-day MA, and the 10-day MA below both the 20-day MA and longer-term MAs, showing that the short to medium-term structure remains bearish. The Relative Strength Index (RSI) has dropped to around 18, reflecting clear weakness and entering oversold territory, suggesting excessive short-term downward pressure. However, being oversold does not necessarily mean an immediate bottom. In terms of the Bollinger Bands, the share price is approaching the lower band, signaling ongoing weakness. Unless the price quickly rebounds to a higher position within the band, the downtrend cannot be considered truly mitigated.
For the stock to stage a meaningful rebound, clear triggers must be identified: first, it needs to hold above 140.1 yuan and then swiftly rise above 152.8 yuan to 153.6 yuan, which could indicate that short-term capital is starting to step in. Only then will there be conditions for a rebound towards 166 yuan to recoup losses. A minor bounce near 140 yuan without breaking back above 153 yuan would only be a technical rebound following a decline and insufficient to confirm a trend reversal. Conversely, downside risks remain evident. If 140.1 yuan is breached, it would signify another break of recent lows, confirming the continuation of weakness, with further downside pressure likely in the short term.
In the warrant market, capital distribution is complex. There are 208 products in total, including 138 call warrants and 70 put warrants, indicating a structural bias toward calls. However, the most traded call warrants have strike prices between 200 to 210 yuan, while put warrants concentrate between 230 to 240 yuan, showing that bullish and bearish flows coexist. The highest concentration of open interest is in call warrants with strike prices between 250 to 260 yuan, indicating that many positions from previous highs remain intact. This suggests that the market isn't entirely bearish, as open interest still leans heavily toward calls. However, looking at current trading patterns, funds have noticeably begun using puts to participate in or hedge against declines, reflecting more pessimistic short-term sentiment compared to the structure of outstanding positions.
Returning to the investor's question, the nearest support level to watch is 140.1 yuan, the clearest and most direct support zone at this stage. The idea of 'first wiping out the 140-yuan bull and then rebounding' is not entirely illogical because 140 yuan is close to recent lows and could easily become a psychological threshold for short-term capital observation. The market might indeed trigger a wipeout of bull certificates before staging a technical rebound. However, this view essentially captures extremely short-term movements rather than providing a robust directional judgment since moving averages are sloping down, RSI is very weak, and the stock price is near the lower Bollinger Band, all pointing to a dominant downtrend. Thus, one cannot assume a quick rebound simply based on proximity to 140 yuan.
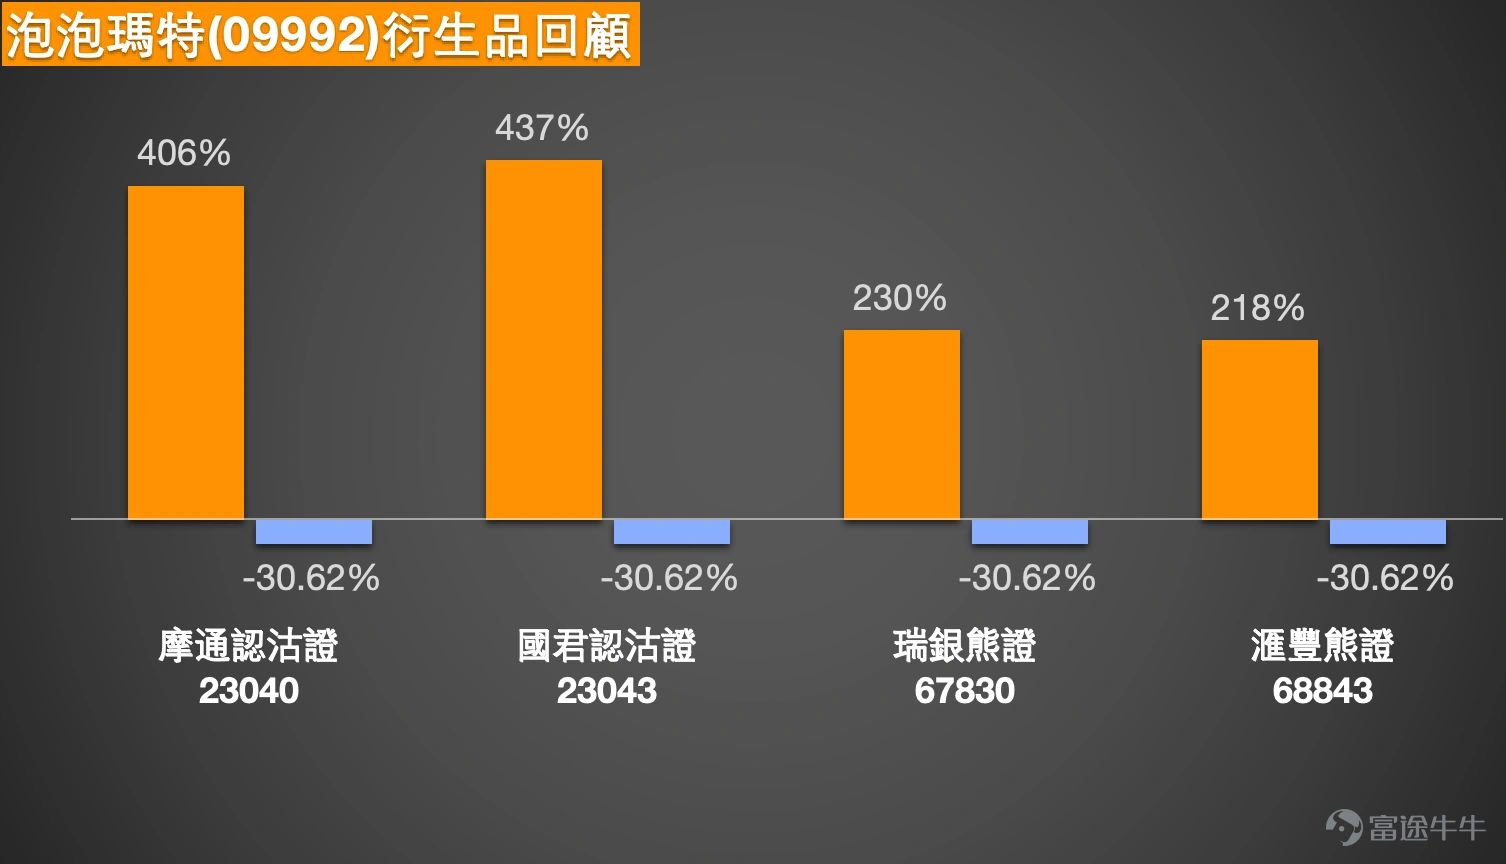
As for holding put warrants with an exercise price of HKD 150, this strategy is quite close to the current price and aligns with the present weak trend. However, since the stock price is already near the support level of HKD 140, and the RSI has entered a notably weak zone, the risk-reward ratio for further bearish bets isn’t particularly attractive. This is because if a technical rebound occurs near HKD 140, the short-term volatility of the put warrants will also be significant. In summary, investors’ belief that the area around HKD 140 might be tested first makes some sense, but treating it as an inevitable 'sell-off followed by a rebound' is too early to conclude. At this stage, the short-term risk-reward ratio leans toward low to moderate, and betting on further declines is no longer especially appealing. To bet on a rebound, one must wait for clear signs of stabilization near HKD 140 and a return above HKD 153; otherwise, both sides could easily turn into high-risk gambles. $JPPOMRT@EP2605A.P (23040.HK)$$GJPOMRT@EP2605A.P (23043.HK)$$UB#POMRTRP2812K.P (67830.HK)$$HS#POMRTRP2812C.P (68843.HK)$
Reminder: This article does not constitute any investment advice.
This article is for reference only and does not constitute any investment advice. The market data, opinions, and analysis contained herein may change at any time without prior notice. We are not responsible for any loss or damage caused by reliance on the information in this article. Technical analysis only shows whether certain technical conditions are met; a comprehensive assessment of asset performance should combine other data and should not solely rely on this article to make trading decisions. Please note that past performance is not indicative of future results. Follow Jenny's insights on Hong Kong stock warrants for more professional analysis.
Risk Disclaimer: The above content only represents the author's view. It does not represent any position or investment advice of Futu. Futu makes no representation or warranty.Read more

Comments
to post a comment
2
11