
English
Back
Open Account
港股窩輪Jenny
wrote a column ·

After AIA's sharp decline, a CCI bottom divergence has appeared: will the support level at HKD 76.9 be the key to a rebound?

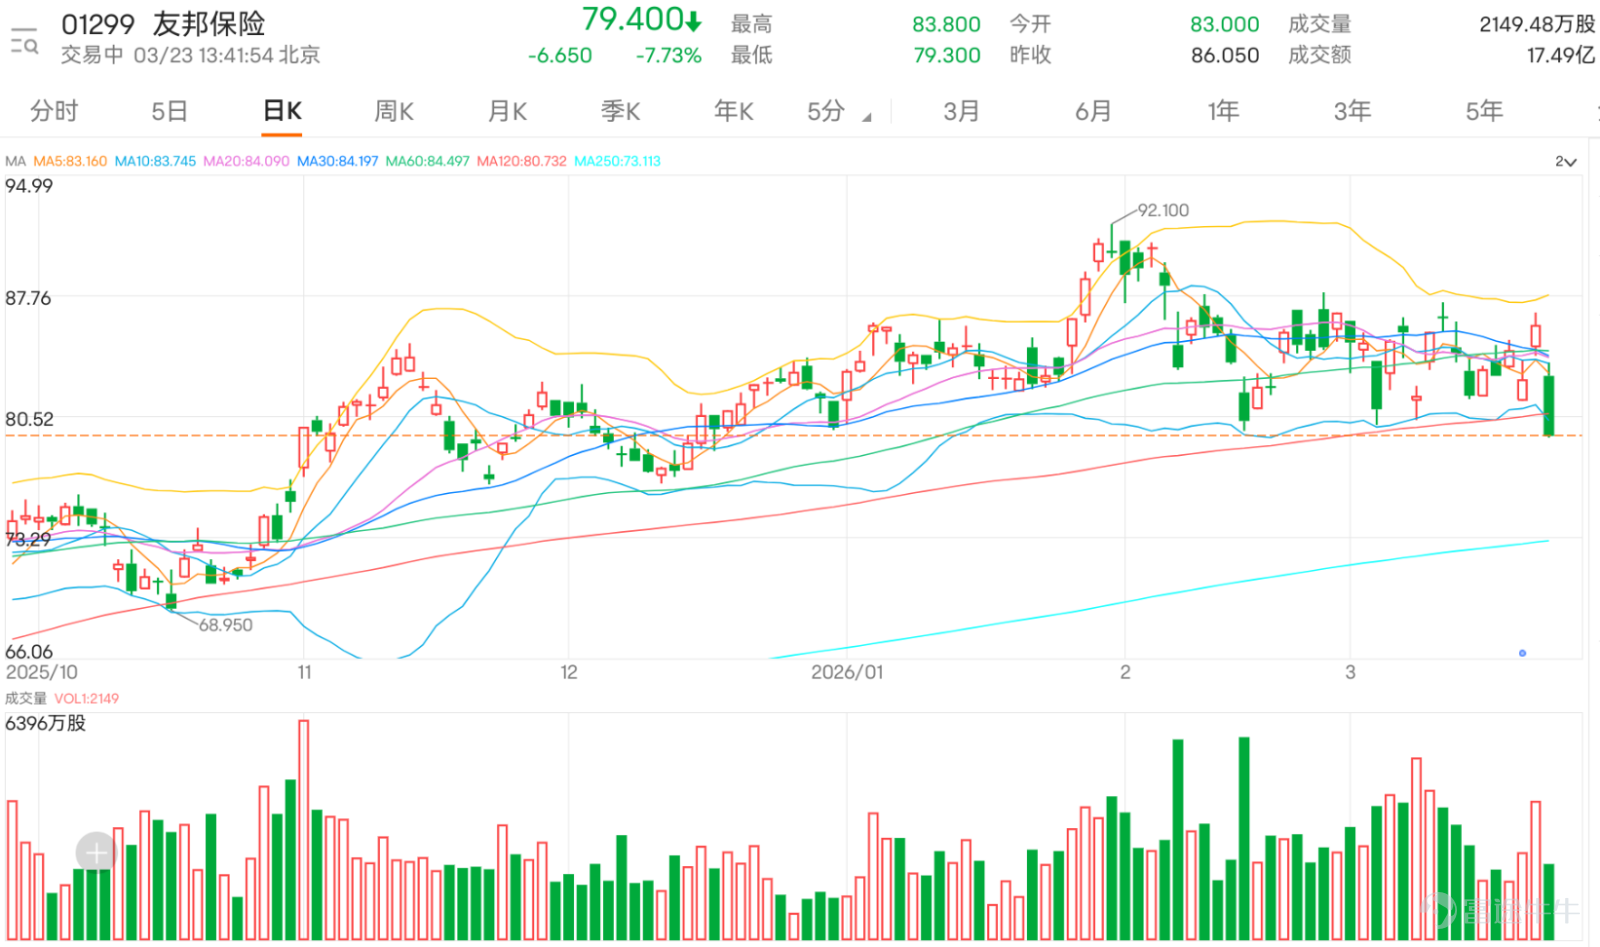
The recent volatility in Hong Kong stocks has intensified, with the financial sector coming under broad pressure. As a heavyweight stock on the Hang Seng Index, $AIA (01299.HK)$ AIA plunged over 7% in a single day, directly breaking through the key HKD 80 level, hitting an intraday low of HKD 79.3, marking a one-month low. The current share price has fallen below all short- and medium-term moving averages: the 10-day (HKD 83.81), 30-day (HKD 84.22), and 60-day (HKD 84.51), indicating significant short-term downward pressure and a clear weakening of the technical trend.
Although the overall technical indicator summary signal generated by the system is "Buy," with a strength of 9, most key momentum indicators are still skewed toward the downside. For example, both the MACD and ADX indicators have issued "Sell" signals, confirming the dominance of the current downtrend. However, there are also potential signs of a reversal hidden in the market. Notably, the CCI has shown a "bottom divergence" buy signal. This often suggests that although prices continue to fall, the downward momentum may be quietly waning, paving the way for a technical rebound. At the same time, both the Stochastic Oscillator and Williams %R are in "oversold territory" and have issued "neutral" signals, reflecting that short-term selling pressure may have been excessively released, putting the stock price into a sensitive zone.
In terms of key price levels, the current share price is closely following the first support level at HKD 76.9. Stronger support lies further down at HKD 73.6. Above, the stock faces multiple resistance levels, with the first rebound target being HKD 83.9 (near the 10-day moving average) and stronger resistance at HKD 88.7.
Overall, after AIA's sharp decline, several indicators have entered oversold territory, particularly the CCI bottom divergence signal, providing technical grounds for investors seeking short-term rebounds. However, as the stock price has effectively broken below all major moving averages and multiple trend indicators continue to point downward, any rebound will initially face significant resistance between HKD 83 and HKD 84.5 (the convergence zone of moving averages). This is not the time to chase gains or cut losses aggressively. A more prudent strategy would be to establish small positions targeting a short-term rebound if the stock can hold firm at the HKD 76.9 support level and show signs of stabilization with increased trading volume. The initial target would be the first resistance level at HKD 83.9. Conversely, if the stock breaks below HKD 76.9 on high volume, downside risk would increase, necessitating decisive stop-loss measures.
Morgan Stanley recently updated its earnings forecast and target price for AIA, slightly adjusting the target price from HKD 111 to HKD 109 while maintaining an 'Overweight' rating. This adjustment is primarily based on FY2025 performance and the impact of a USD 1.7 billion share buyback, with several core metrics modestly lowered by 1-2 percentage points: operating profit after tax forecasts for this year and next were reduced by 2.1% and 2.4%, respectively, but still reflect robust growth rates of 12% and 12.1%; embedded value was lowered by 4% and 4.3%, respectively, though per-share embedded value remains on track for 13% and 12.5% year-over-year growth; marginal balance of contract service margins saw less than a 1-percentage-point reduction, with future two-year growth staying within the 11%-12% range.
Morgan Stanley noted that despite weaker-than-expected performance in Thailand during Q1 FY2026, AIA’s new business value (VNB) for FY2026-FY2028 is expected to achieve mid-teens growth of 14.7%, 14.9%, and 14.3%, driven primarily by the China market. Additionally, the group’s private credit exposure accounts for only 2% of non-dividend-paying and profit-generating assets, reflecting strong asset quality. Coupled with the USD 1.7 billion share repurchase plan, this will provide effective support to the stock price.
The recent volatility in Hong Kong stocks has intensified, with the financial sector coming under broad pressure. As a heavyweight stock on the Hang Seng Index, $AIA (01299.HK)$ AIA plunged over 7% in a single day, directly breaking through the key HKD 80 level, hitting an intraday low of HKD 79.3, marking a one-month low. The current share price has fallen below all short- and medium-term moving averages: the 10-day (HKD 83.81), 30-day (HKD 84.22), and 60-day (HKD 84.51), indicating significant short-term downward pressure and a clear weakening of the technical trend. Although the overall technical indicator summary signal generated by the system is "Buy," with a strength of 9, most key momentum indicators are still skewed toward the downside. For example, both the MACD and ADX indicators have issued "Sell" signals, confirming the dominance of the current downtrend. However, there are also potential signs of a reversal hidden in the market. Notably, the CCI has shown a "bottom divergence" buy signal. This often suggests that although prices continue to fall, the downward momentum may be quietly waning, paving the way for a technical rebound. At the same time, both the Stochastic Oscillator and Williams %R are in "oversold territory" and have issued "neutral" signals, reflecting that short-term selling pressure may have been excessively released, putting the stock price into a sensitive zone. In terms of key price levels, the current share price is closely following the first support level at HKD 76.9. Stronger support lies further down at HKD 73.6. Above, the stock faces multiple resistance levels, with the first rebound target being HKD 83.9 (near the 10-day moving average) and stronger resistance at HKD 88.7....
As of March 17, 2026, over the following two trading days, AIA shares recorded a cumulative slight decline of 0.24%, while corresponding bearish derivatives generated positive returns: $SG#AIA RP2812E.P (64263.HK)$ Up 8% during the period, $BI-AIA @EP2607B.P (23997.HK)$ Up 6%.
The recent volatility in Hong Kong stocks has intensified, with the financial sector coming under broad pressure. As a heavyweight stock on the Hang Seng Index, $AIA (01299.HK)$ AIA plunged over 7% in a single day, directly breaking through the key HKD 80 level, hitting an intraday low of HKD 79.3, marking a one-month low. The current share price has fallen below all short- and medium-term moving averages: the 10-day (HKD 83.81), 30-day (HKD 84.22), and 60-day (HKD 84.51), indicating significant short-term downward pressure and a clear weakening of the technical trend. Although the overall technical indicator summary signal generated by the system is "Buy," with a strength of 9, most key momentum indicators are still skewed toward the downside. For example, both the MACD and ADX indicators have issued "Sell" signals, confirming the dominance of the current downtrend. However, there are also potential signs of a reversal hidden in the market. Notably, the CCI has shown a "bottom divergence" buy signal. This often suggests that although prices continue to fall, the downward momentum may be quietly waning, paving the way for a technical rebound. At the same time, both the Stochastic Oscillator and Williams %R are in "oversold territory" and have issued "neutral" signals, reflecting that short-term selling pressure may have been excessively released, putting the stock price into a sensitive zone. In terms of key price levels, the current share price is closely following the first support level at HKD 76.9. Stronger support lies further down at HKD 73.6. Above, the stock faces multiple resistance levels, with the first rebound target being HKD 83.9 (near the 10-day moving average) and stronger resistance at HKD 88.7....
Investors expecting a rebound near the support level may consider options with favorable leverage and implied volatility: $UB-AIA @EC2612A.C (22905.HK)$ The strike price is HKD 91.71, offering approximately 5.4x leverage, making it suitable for capturing potential rebounds. For those looking to deploy with lower cost, $BI-AIA @EC2612A.C (22387.HK)$ The implied volatility is relatively low, with a strike price of HKD 91.66 and leverage around 5.3x, minimizing the impact of time decay.
Investors who are bearish on the future market can consider using put warrants to hedge or chase declines. Among them, $MS-AIA @EP2606A.P (25248.HK)$ The exercise price is 69.99 yuan, providing about 7.8 times leverage, and its implied volatility terms are relatively favorable. For those seeking higher leverage, $BI-AIA @EP2607B.P (23997.HK)$ The exercise price is 70 yuan, offering 7.5 times leverage with the lowest implied volatility, which can more effectively amplify gains from declines.
As for bull-bear certificates, their price movements are more closely correlated with the underlying stock and are not affected by implied volatility. Aggressive optimists may choose $SG#AIA RC2606H.C (60284.HK)$ With a stop-loss price of 68 yuan, it offers the highest actual leverage of up to 6.2 times with the lowest premium, showing strong explosiveness. For slightly more stability, $UB#AIA RC2606F.C (59621.HK)$ With a stop-loss price of 69 yuan, the premium is relatively low, providing about 6.6 times leverage. Bearish investors may pay attention to bear certificates, $UB#AIA RP2812A.P (64884.HK)$ With a stop-loss price of 95 yuan, its premium is the lowest among similar products and has a relatively high actual leverage (about 5.8 times), making it an efficient bearish tool. For the highest leverage, one may consider $SG#AIA RP2812E.P (64263.HK)$ Also with a stop-loss price of 95 yuan, it offers the highest actual leverage with relatively low premium.
$Hang Seng Index (800000.HK)$ Today's continued weakness set a new yearly low, with insurance stocks being hit hardest in the correction: AIA, $CHINA LIFE (02628.HK)$$NCI (01336.HK)$ Drops exceeding 7%. $PING AN (02318.HK)$ )、 $CPIC (02601.HK)$$PICC GROUP (01339.HK)$The decline in leading insurance companies has also exceeded 5%. Are you more inclined to buy on dips or temporarily stay on the sidelines? Feel free to share your insights in the comment section. For more market analysis, keep following 'HK Stock Warrants Jenny' for daily updates!$Hang Seng China Enterprises Index (800100.HK)$$Insurance (LIST1003.HK)$
Reminder: This article does not constitute any investment advice.
This article is for reference only and does not constitute any investment advice. The market data, opinions, and analysis contained herein may change at any time without prior notice. We are not responsible for any loss or damage caused by reliance on the information in this article. Technical analysis only shows whether certain technical conditions are met; a comprehensive assessment of asset performance should be conducted using additional data. Decisions to trade should not be based solely on this article. Please note that past performance is not indicative of future results.
#HongKongStocks #RealTimeAnalysis #WarrantsSelection #WarrantsStrategy #DerivativesHedging #HongKongWarrantsJenny AIA Group #01299 #InsuranceStocks #TechnicalAnalysis
Risk Disclaimer: The above content only represents the author's view. It does not represent any position or investment advice of Futu. Futu makes no representation or warranty.Read more
250K Views
Report
Comments
Write a Comment...
7