The US-Iran peace talks present conflicting narratives! What’s next for oil prices?
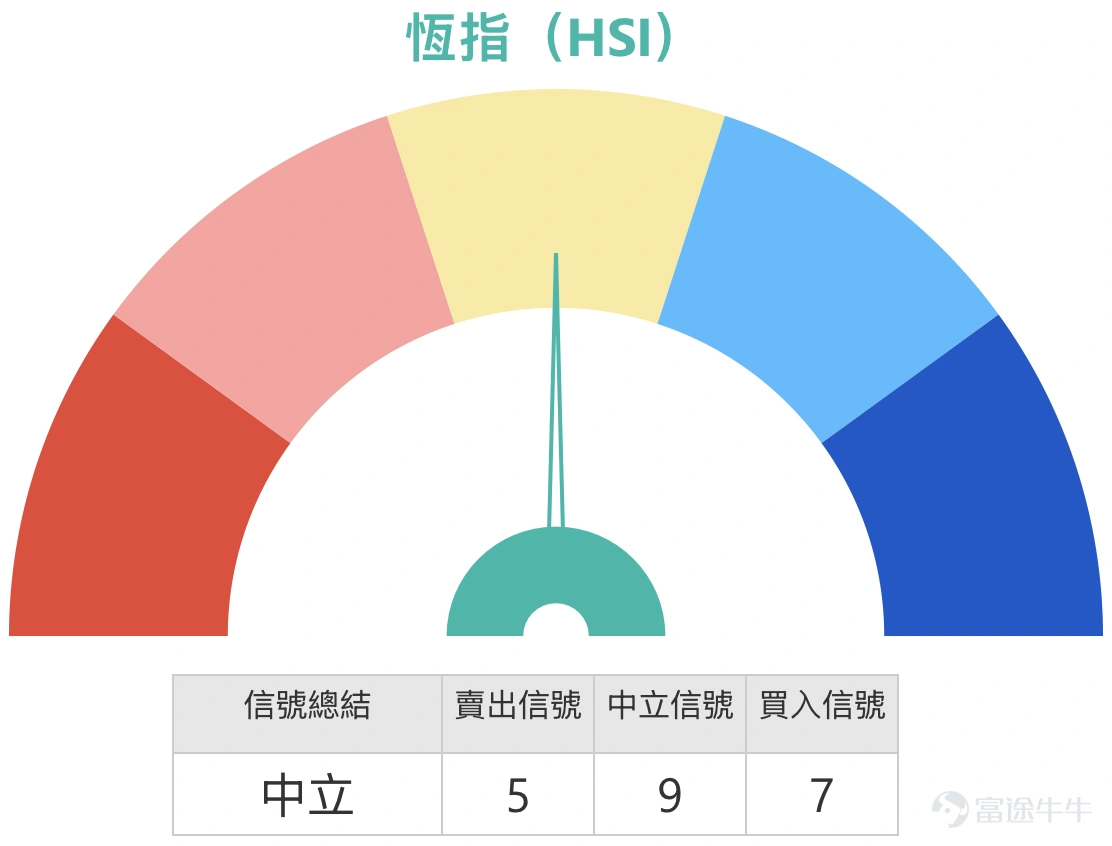
1. Hang Seng Index $Hang Seng Index (800000.HK)$: Intensified divergence between bulls and bears, key technical levels become focus of deployment
Simon: The Hang Seng Index continued its decline today (March 3rd), with a significant expansion in losses, closing at 25,768 points. From a technical perspective, the closing price has clearly broken below the lower Bollinger Band on the daily chart, while the Relative Strength Index (RSI) retreated to a recent low, reaching its lowest level since December of last year. Notably, trading volume increased further compared to yesterday, indicating that selling pressure persisted during the decline—a signal that is not ideal.
Despite the weak market conditions, investor sentiment remains notably divided. Some optimistic investors continue to focus on bull certificate strategies, believing that the Hang Seng Index could rebound to the 26,000-point level; bearish investors, on the other hand, hold bear certificates and plan to take profits if the index continues to drop tomorrow. This coexistence of bullish and bearish positions is quite common in volatile markets.
Based on the comprehensive analysis of technical signals, the overall market is currently in a neutral state without a clear direction. Although the closing price has broken below the lower Bollinger Band, the short-term trend has not yet formed a definitive conclusion when considering more than ten technical indicators. It is expected that the market will mainly continue in a volatile pattern.
In terms of key technical levels, the short-term support is near 25,400 points. If this level is breached, the next support will be tested at 24,700 points. On the resistance side, the primary short-term resistance is at 26,500 points. If it breaks through, the upside target could reach 27,600 points. Investors can refer to these key levels to choose suitable bull or bear warrant products.
It is important to note that the current market volatility is relatively high, with significant daily fluctuations. When selecting bull or bear warrants, investors should try to avoid products that are too close to the current price. While these products offer higher leverage, their risk of being called is also higher. It is recommended that investors strike a balance between risk and leverage by choosing products with a recall price further from the current price, such as those based on the above-mentioned support or resistance levels, to mitigate unnecessary investment risks while seeking returns. $BI#HSI RP2803Q.P (55030.HK)$$UB#HSI RP28023.P (61223.HK)$$JP-HSI @EP2606A.P (23955.HK)$


2. PetroChina (00857.HK) $PETROCHINA (00857.HK)$: Strong performance reaching new multi-year highs; 11 yuan resistance becomes focus
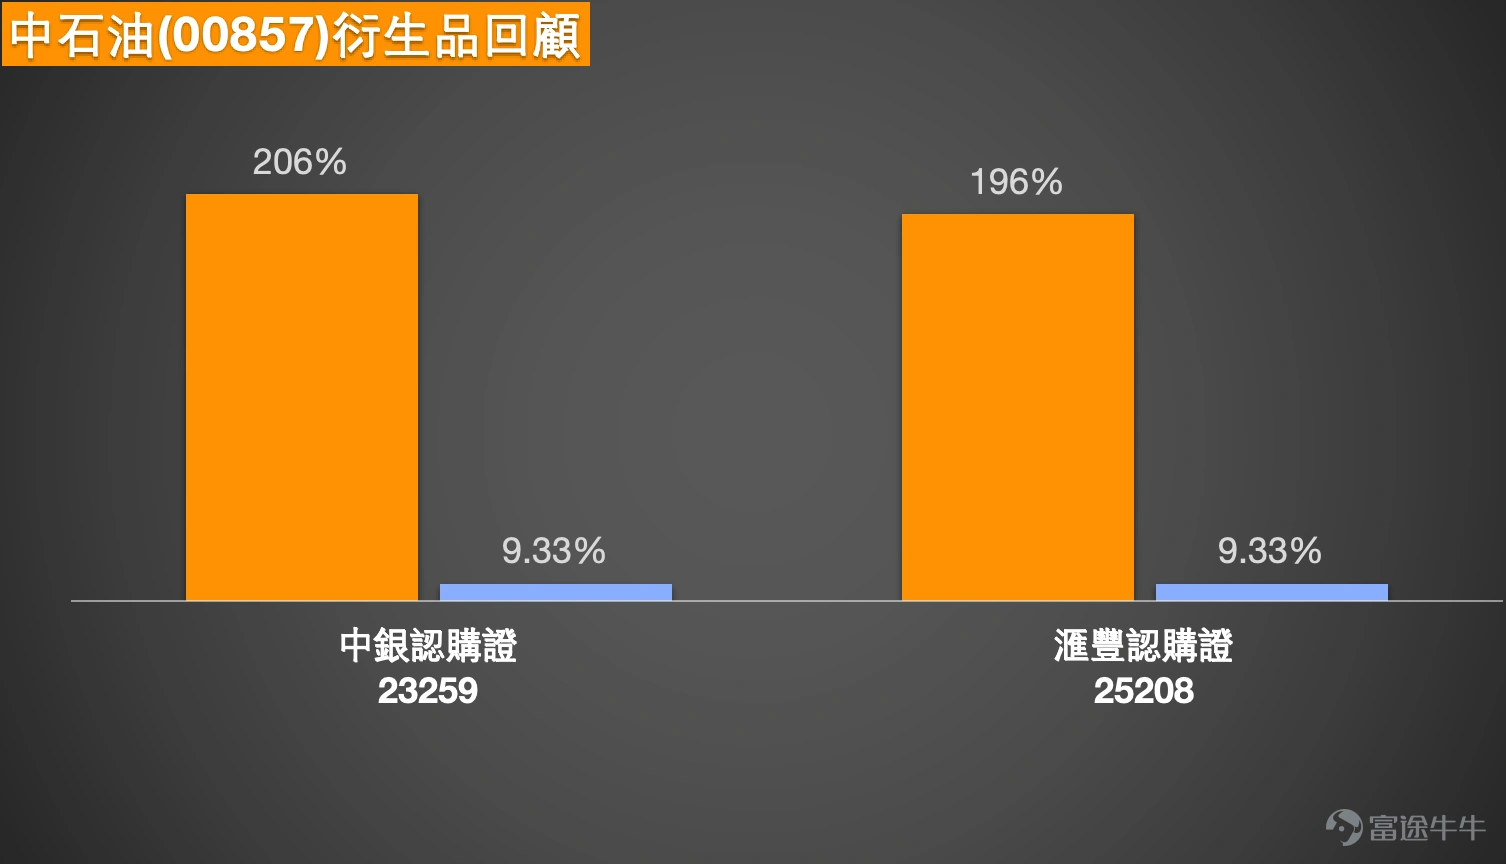
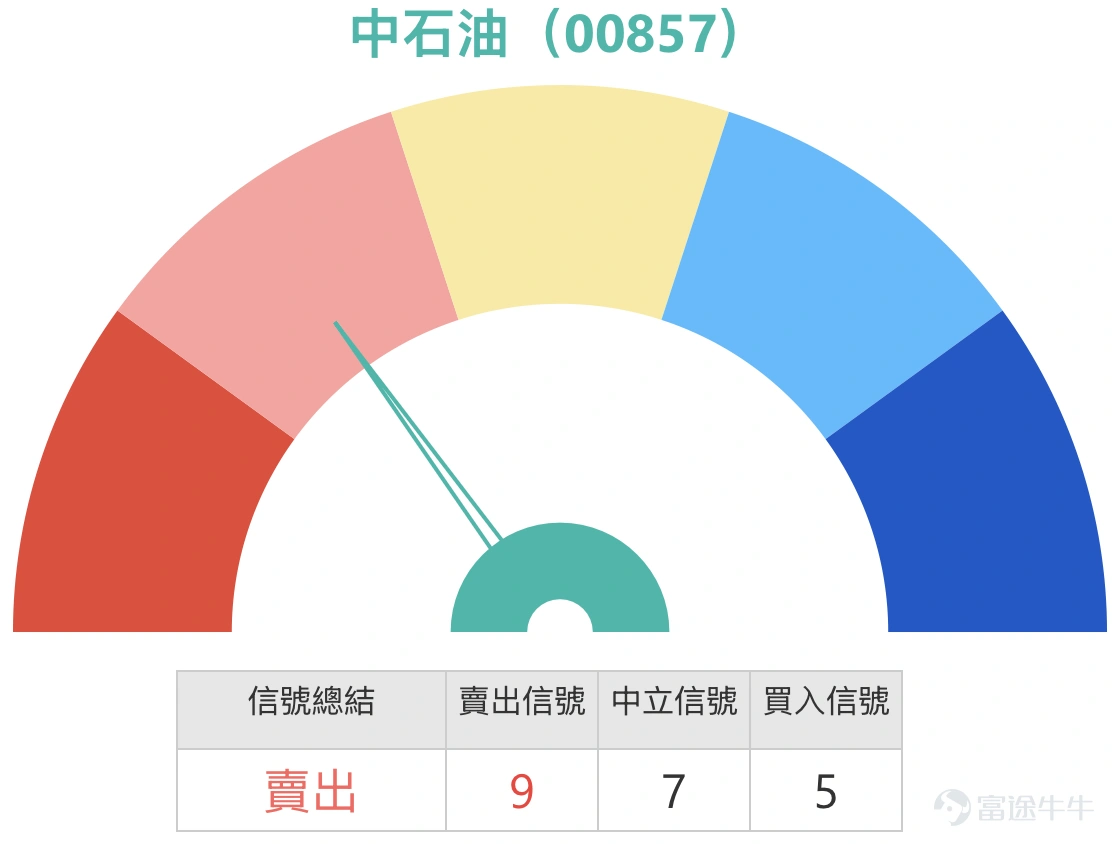
Simon: PetroChina (00857) demonstrated strong performance today (3rd), diverging from the broader market trend. While the Hang Seng Index fell below the lower Bollinger Band, PetroChina’s closing price broke above the upper Bollinger Band on the daily chart, hitting an intraday high of 10.61 yuan, marking a multi-year high. In terms of trading volume, both today and yesterday saw significantly higher volumes compared to the past three months, especially during the upward movement, indicating robust buying momentum.
Regarding the question about resistance levels, the current short-term resistance is at 11 yuan. If it successfully breaks through, it may further test 11.4 yuan. However, it is worth noting that the recent uptrend has been rapid, and a short-term technical correction might occur. Investors should consider this factor when making decisions. For those interested in call warrants, the 11-yuan resistance level is worth watching.


3. Hong Kong Exchanges and Clearing Limited (00388.HK) $HKEX (00388.HK)$: Testing the 400-yuan mark; warrants selection requires caution
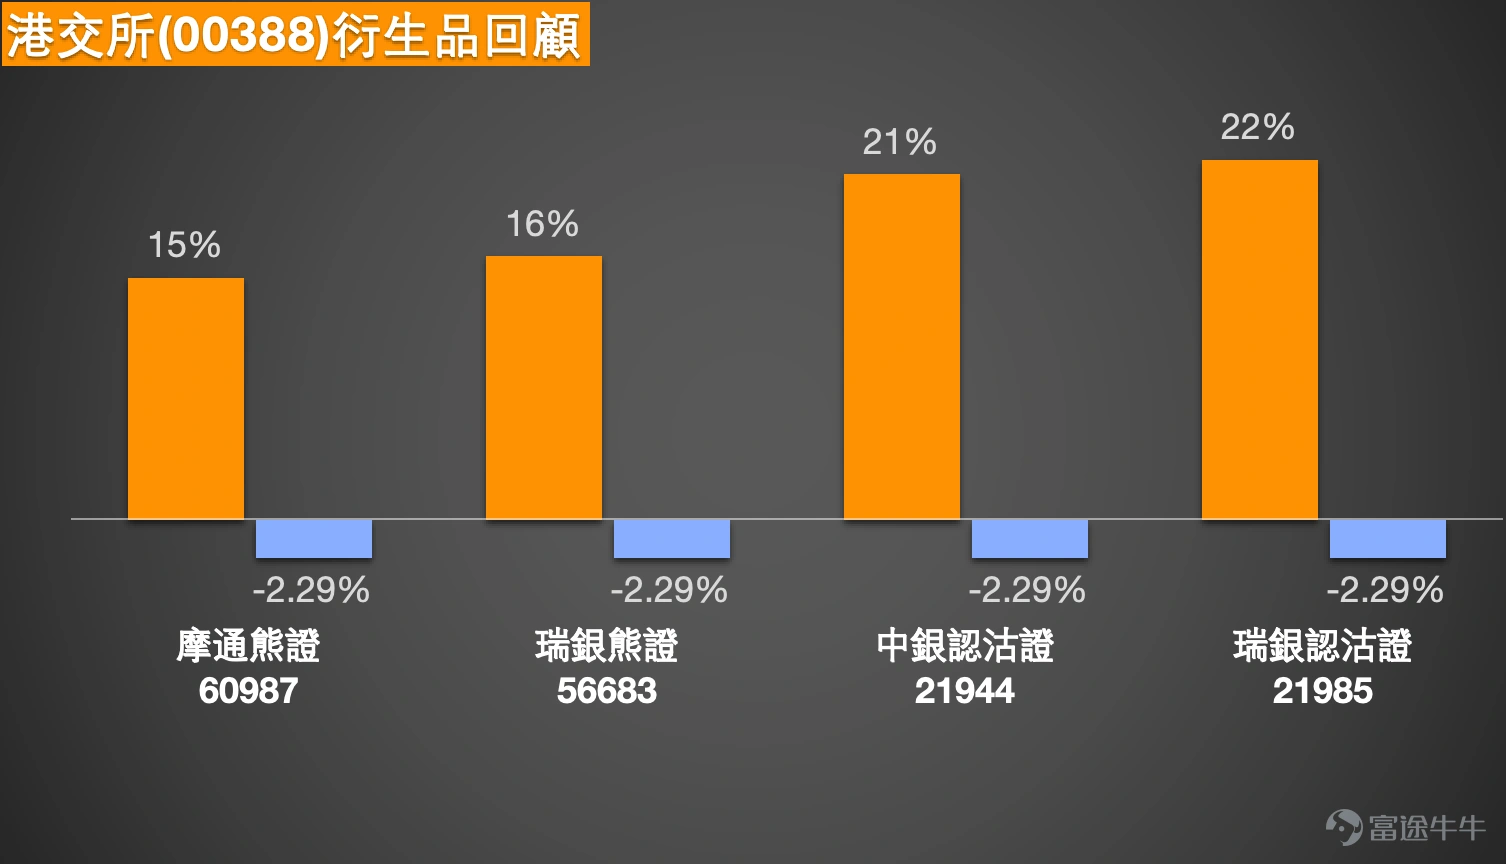
Simon: The share price of Hong Kong Exchanges and Clearing Limited (00388) weakened today (3rd), closing at 409 yuan, with significant intraday volatility. Some investors are concerned about whether the 400-yuan mark can hold. From a technical perspective, the short-term support is at 402 yuan, which coincides with the lower Bollinger Band on the daily chart. If it breaks below 402 yuan, the next support will be tested at 393 yuan.
Despite the soft market conditions, some investors are still considering deploying call warrants. It is important to avoid terms that are excessively out-of-the-money when selecting products. On one hand, out-of-the-money products may experience delayed price tracking; on the other hand, if short-term products that are more than 10% out-of-the-money are purchased, a reversal in market sentiment could lead to a passive situation. At the current price of HKD 409, there is a group of call warrants with strike prices between HKD 418-419 and relatively longer expiration dates (June), representing slightly out-of-the-money choices. Meanwhile, products with a strike price of HKD 460 will expire at the end of May, making them short-term and out-of-the-money products with higher risk. Investors are advised to prioritize near-the-money products with longer expiration dates. Although these have lower leverage, they offer stronger downside protection.


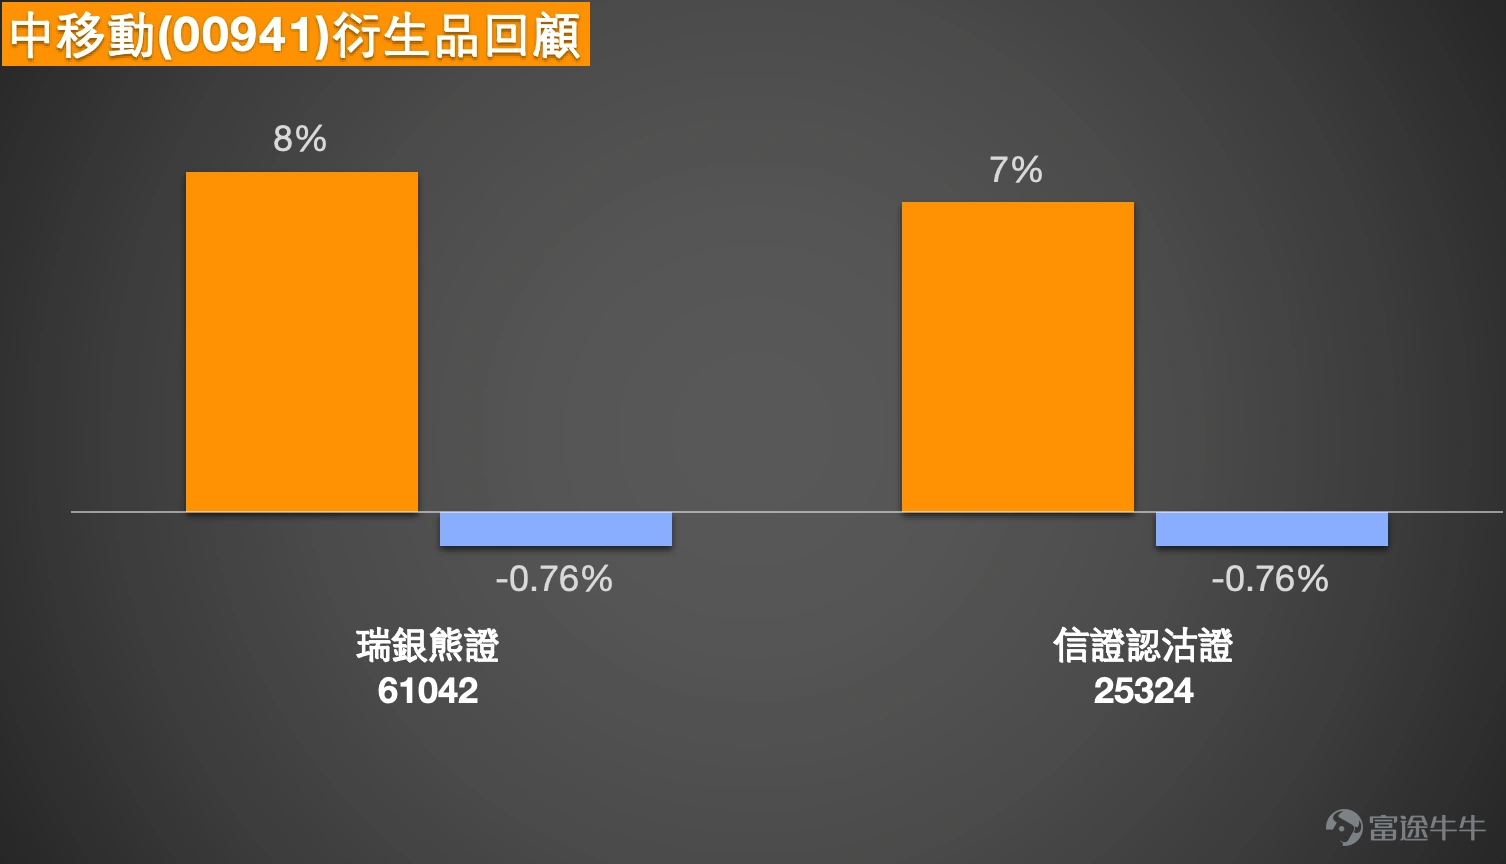
4. China Mobile (00941.HK) $CHINA MOBILE (00941.HK)$: Anticipation of special dividends, short-term trading range yet to break
Simon: China Mobile (00941) is about to distribute a special dividend, and today's (3rd) share price has demonstrated strong resilience against declines. From the trend analysis, the stock’s recent performance has been relatively flat, with its price constrained by the middle band of the Bollinger Bands. Each time it approaches the middle band, the stock tends to consolidate or pull back. The current closing price is HKD 78.7, which is close to the middle band of the Bollinger Bands.
In terms of the short-term trading range, if viewed from a narrow range perspective, it is approximately between HKD 77.1 and HKD 80.3; if viewed from a wider range perspective, it spans between HKD 75.5 and HKD 81.9. The level of HKD 77.1 is near the bottom of the Bollinger Bands, while HKD 80.3 is close to the top of the band. Investors can refer to this range for positioning and pay attention to how the stock performs near the middle band.


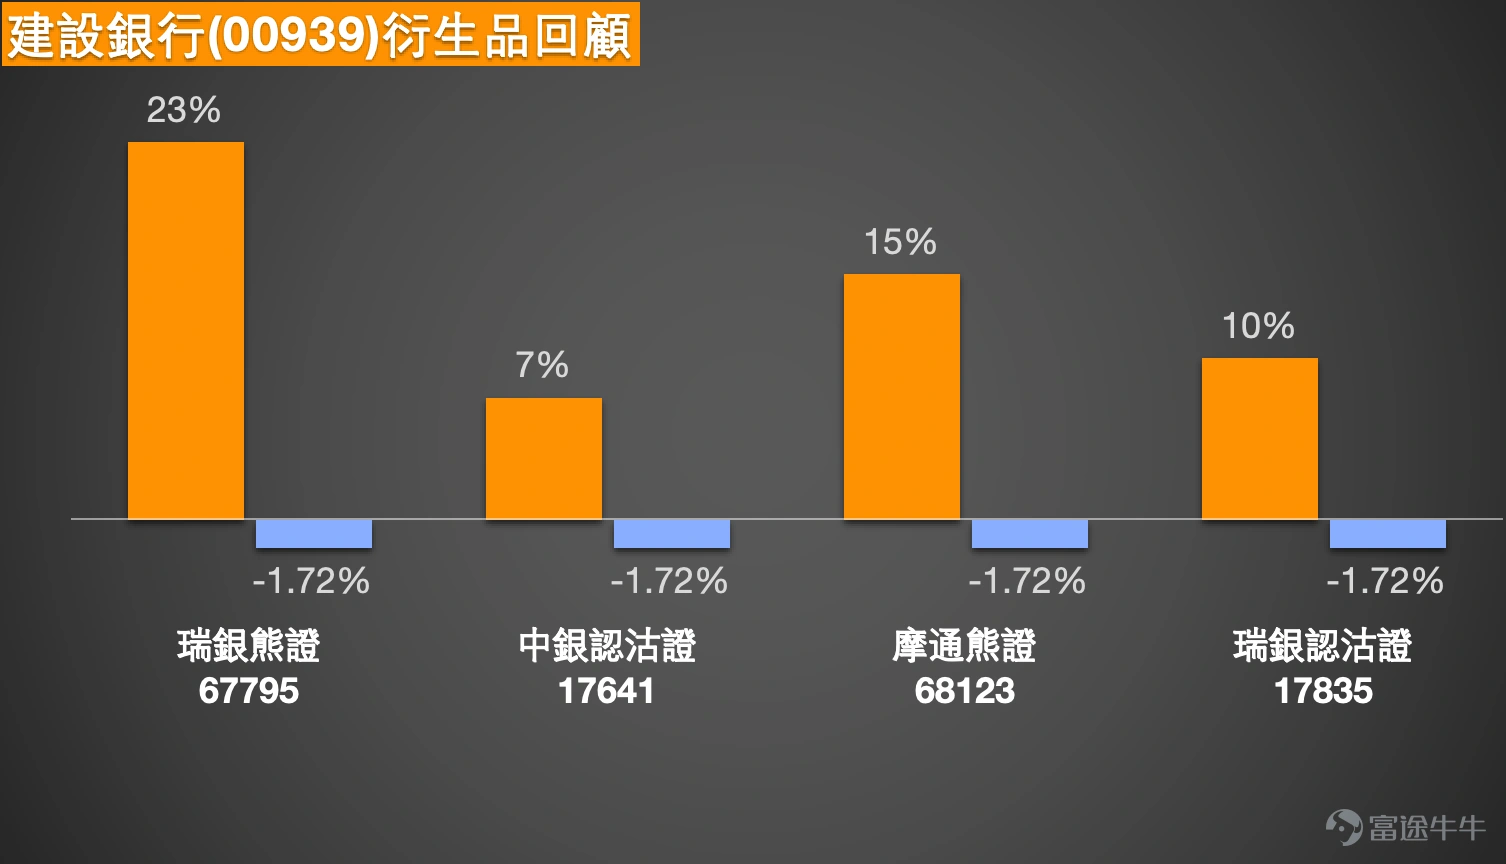
5. Construction Bank (00939.HK) $CCB (00939.HK)$: Banking stocks rebound against the market downtrend, offering opportunities for low-position deployment
Simon: Construction Bank (00939) rebounded today (3rd), contrasting with the broader market decline. During the session, the share price briefly broke above the middle band of the Bollinger Bands and closed at HKD 7.95, slightly below the middle band. Since December of last year, CCB’s price movement has shown a wave-like upward trend, with slow but steady overall gains.
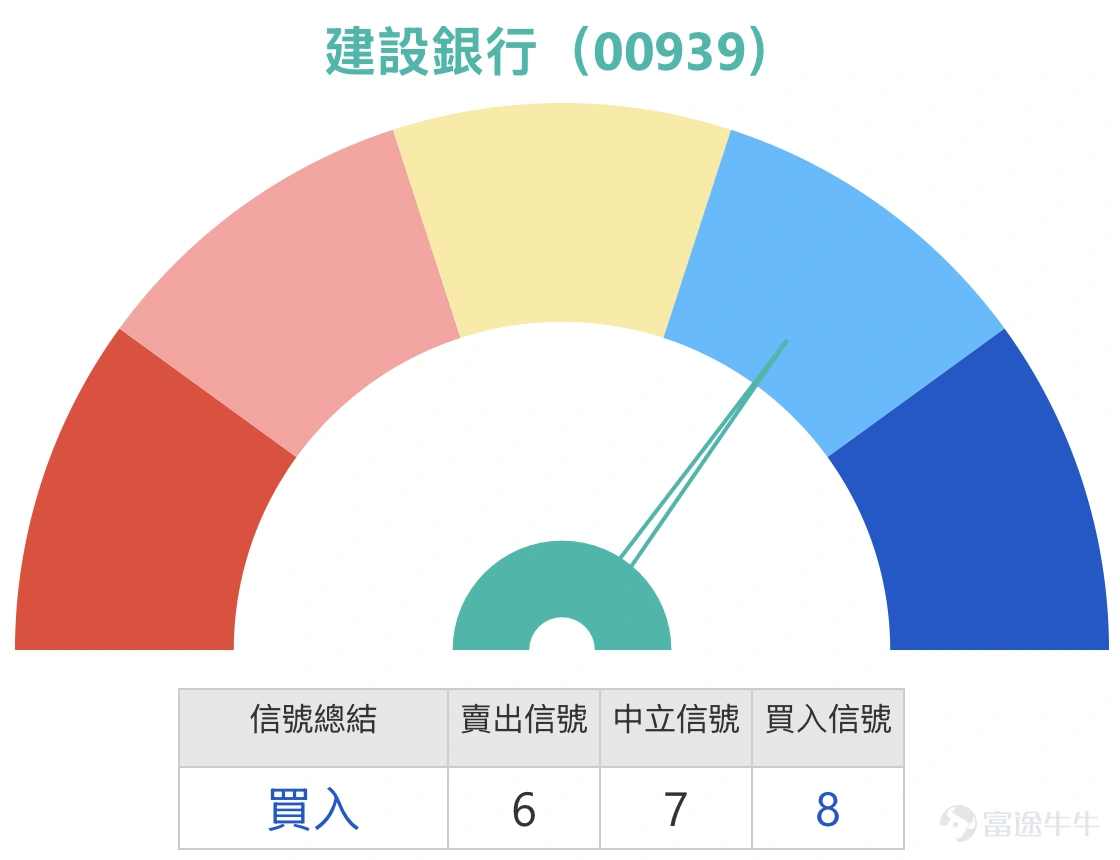
Comprehensive technical signal analysis indicates that CCB currently shows a slightly positive bias, with more buy signals but not reaching a strong buy level. In terms of support levels, short-term support lies at HKD 7.75, and if breached, it would test HKD 7.55. Investors looking to deploy at lower levels may watch for potential pullbacks near HKD 7.55 and make judgments based on prevailing market conditions. $UB#CCB RP2706A.P (67795.HK)$$BI-CCB @EP2610A.P (17641.HK)$$JP#CCB RP2705B.P (68123.HK)$$UB-CCB @EP2610A.P (17835.HK)$


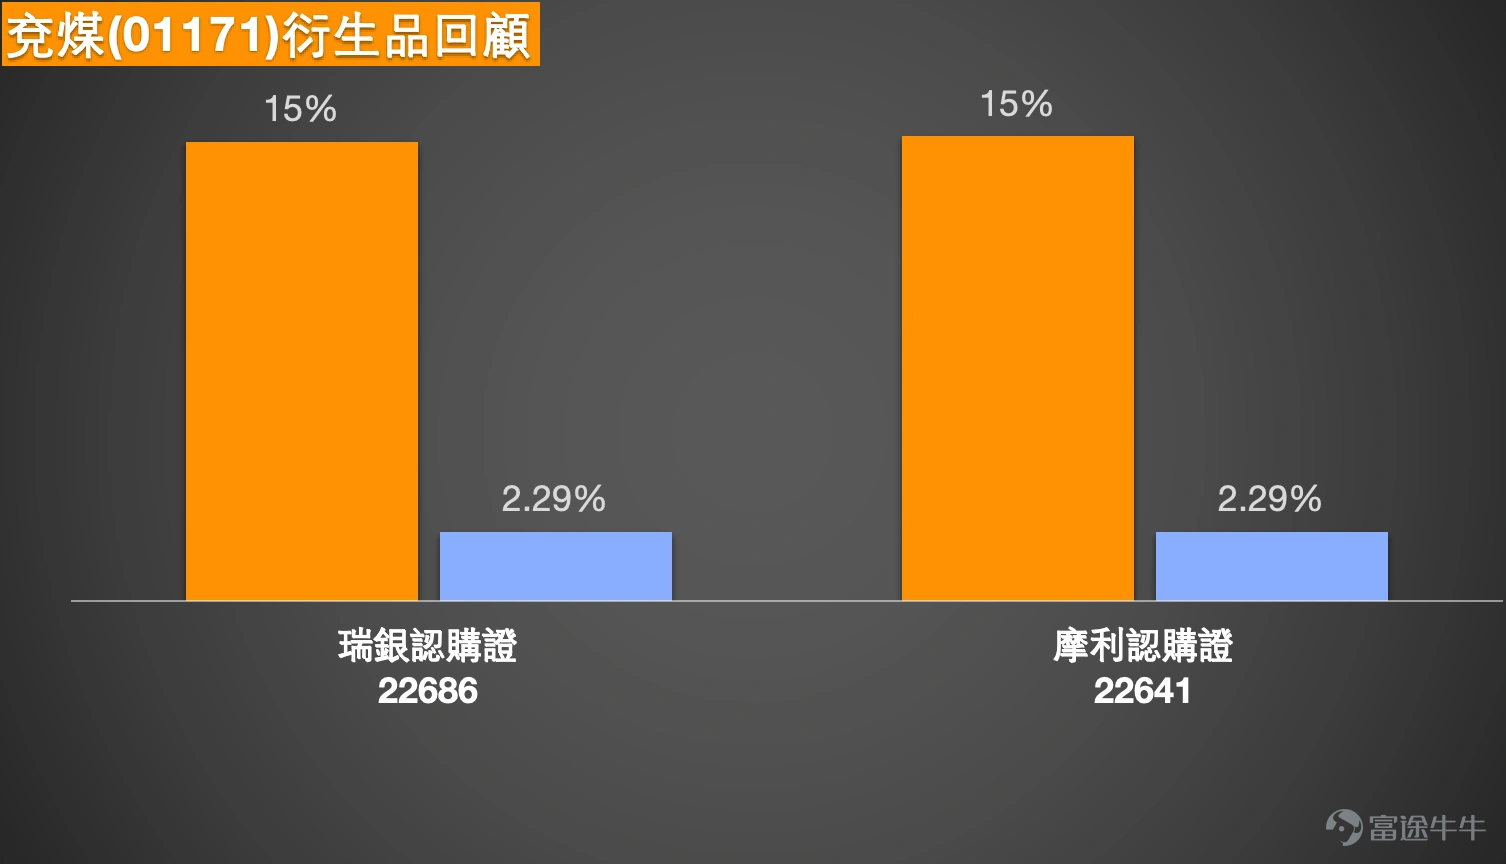
6. Yanzhou Energy (01171.HK) $YANKUANG ENERGY (01171.HK)$: Up nearly 50% year-to-date, resistance at 15 yuan awaits breakout
Simon: Yanzhou Energy (01171) has shown strong recent performance. After hitting a low of 9.51 yuan in January this year, it began an upward trend, with cumulative gains approaching 50%. Today (3rd), the intraday high reached 14.89 yuan, and although the closing price retreated slightly, the overall upward trend remains intact, with trading volume also increasing compared to previous periods.
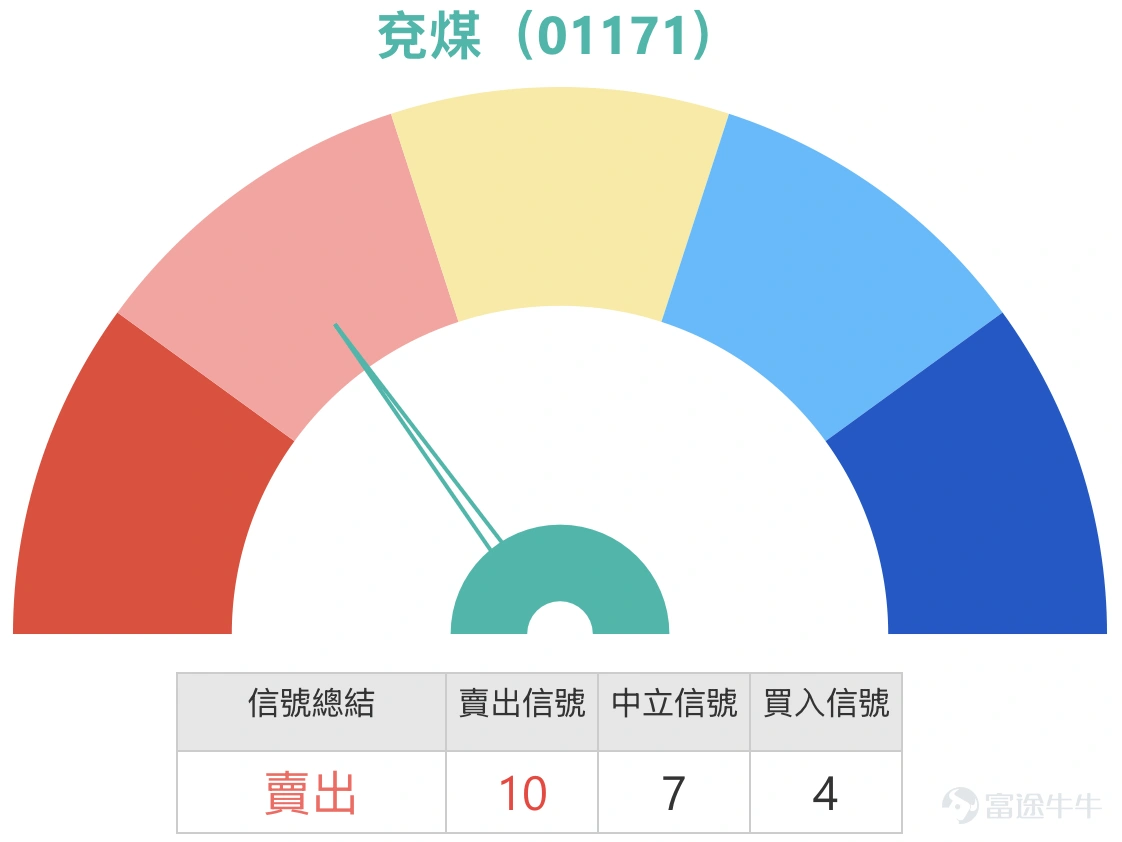
Investors are watching whether the stock price can break through the 15-yuan mark. From a resistance analysis perspective, the short-term resistance lies exactly at 15 yuan. If it successfully breaks through, it may test the next level at 15.9 yuan. In terms of technical signals, sell signals currently have a slight advantage, but they are not strong enough to indicate a strong sell. Investors can consider these signals when planning their strategy. $UBYKENR@EC2605B.C (22686.HK)$$MSYKENR@EC2605A.C (22641.HK)$


That concludes today’s sharing. Thank you all for listening. If you have any questions, feel free to leave a comment, and we will answer them for you. Goodbye.
Friendly Reminder: This article does not constitute any investment advice.
This article is for reference only and does not constitute any investment advice. Market data, opinions, and analyses contained herein may change at any time without prior notice. We are not responsible for any losses or damages caused by reliance on the information in this article. Technical analysis only indicates whether certain technical conditions are met and should be used alongside other data for a comprehensive assessment of asset performance; trading decisions should not be made solely based on this article. Note that past performance is not indicative of future results. Follow Jenny’s HK warrants for more professional insights. $Hang Seng Index (800000.HK)$$Hang Seng TECH Index (800700.HK)$$Hang Seng China Enterprises Index (800100.HK)$$BABA-W (09988.HK)$$TENCENT (00700.HK)$$CHINA MOBILE (00941.HK)$$CCB (00939.HK)$
Risk Disclaimer: The above content only represents the author's view. It does not represent any position or investment advice of Futu. Futu makes no representation or warranty.Read more
Comments
to post a comment
4
11