
English
Back
Open Account
港股窩輪Jenny
wrote a column ·

From the perspective of Kuaishou warrant position changes: Is the technical side entering a critical trading zone?

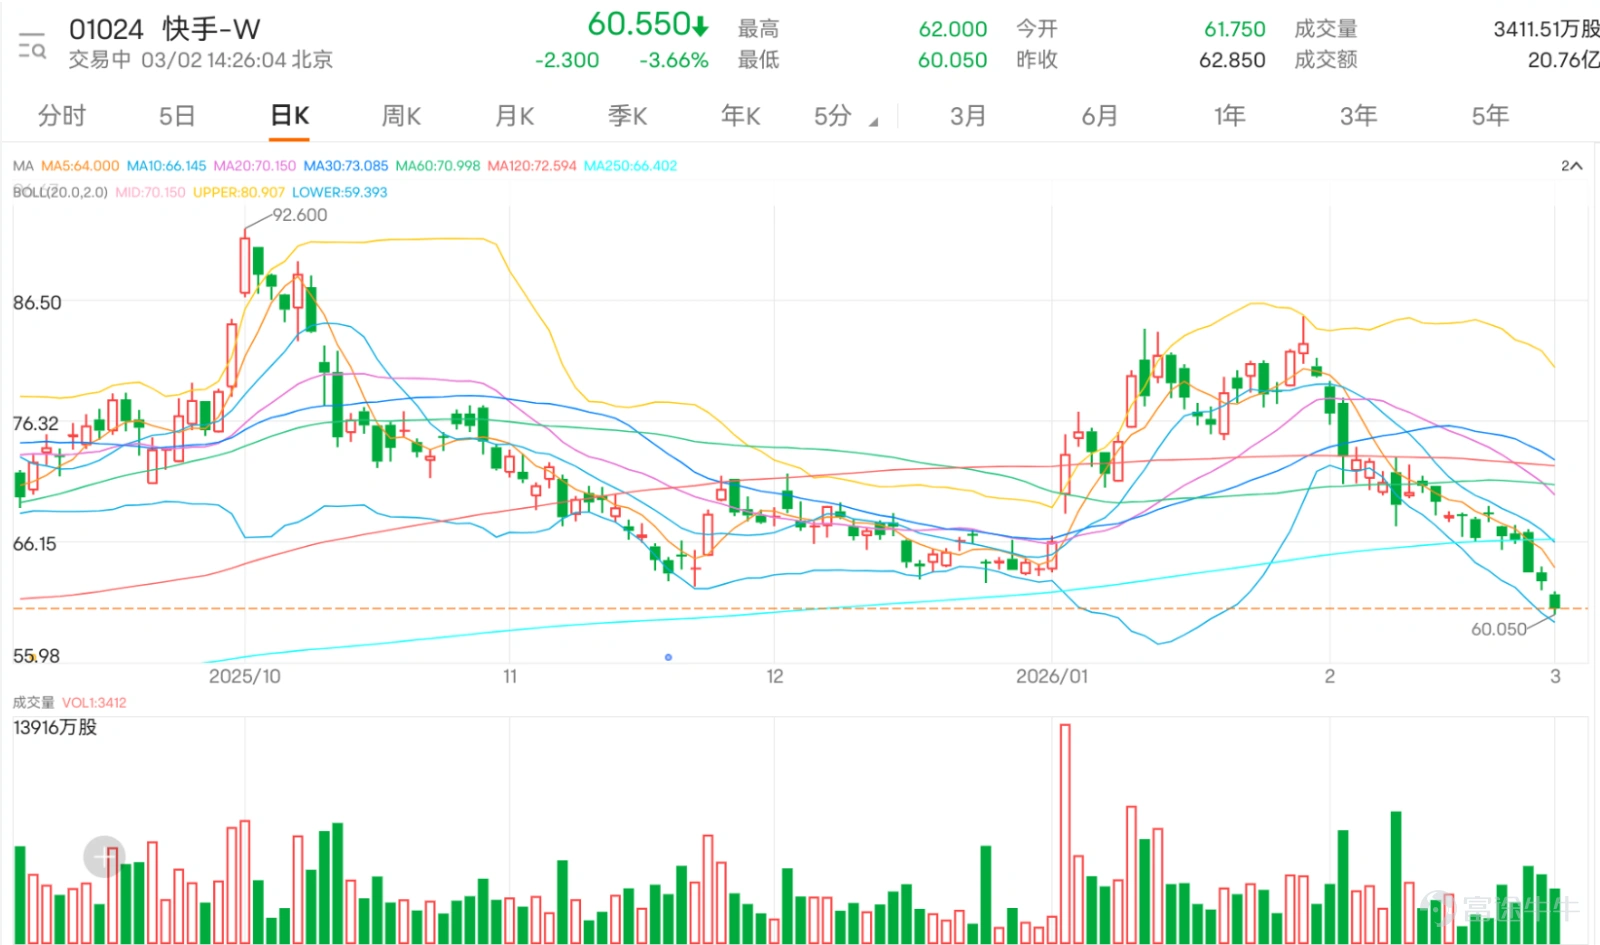
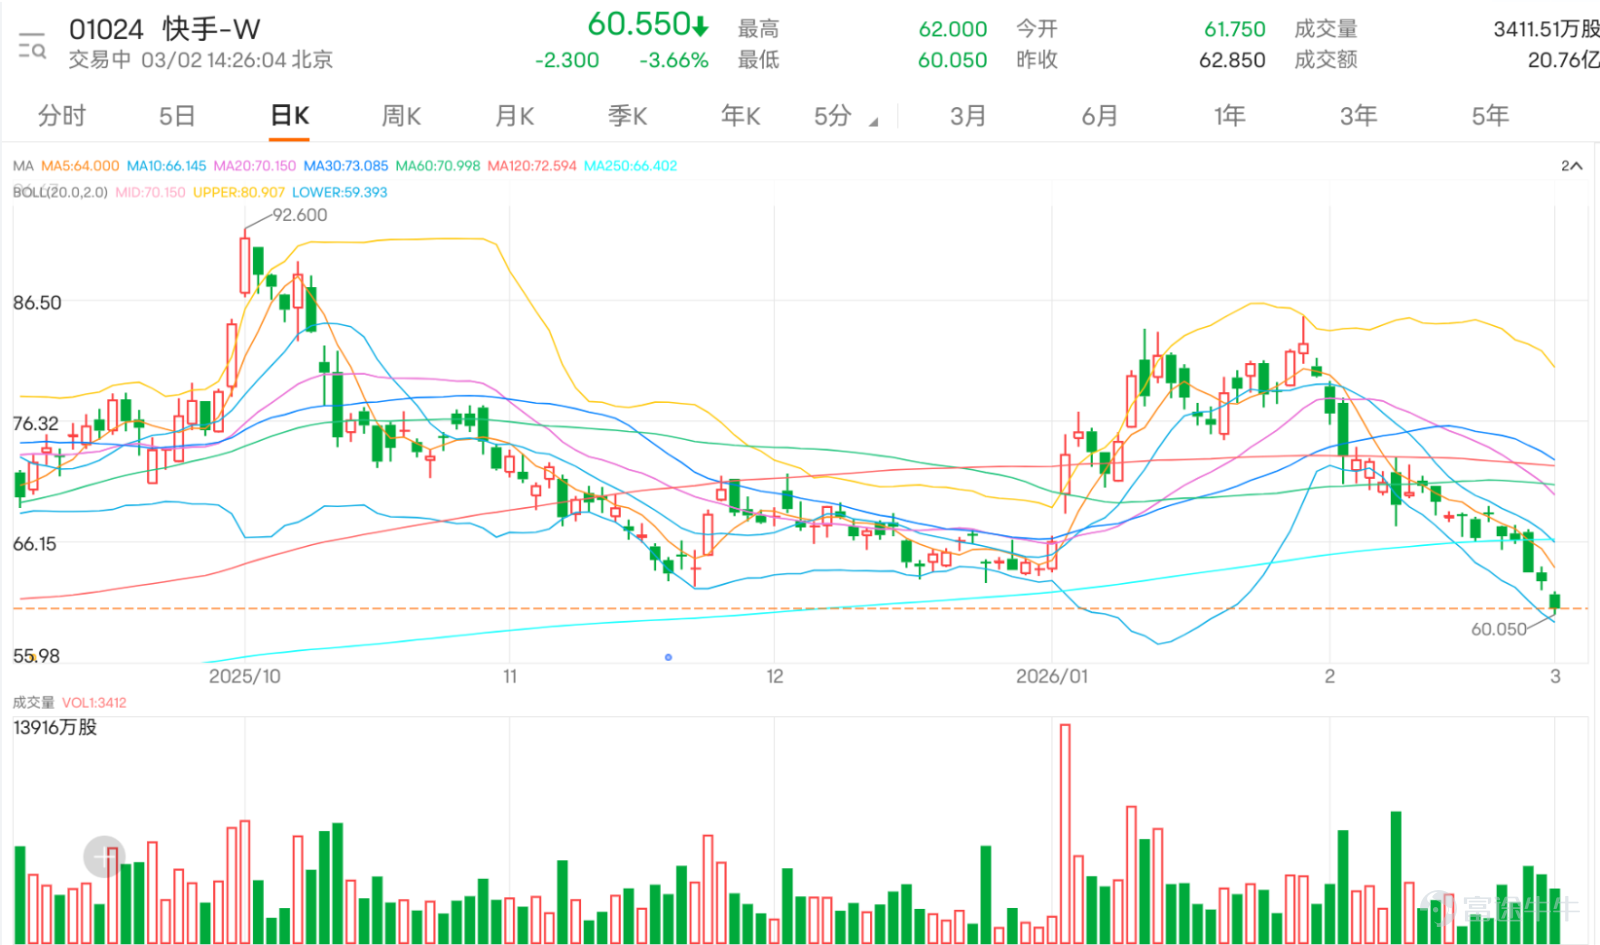
$KUAISHOU-W (01024.HK)$ The current price is 60.55 yuan, down 3.66%, with an intraday low of 60.05 yuan, hitting a new low since August 2025. The trend has been declining for five consecutive weeks. Over the past five trading days, the cumulative volatility reached as high as 12.3%, indicating significantly increased short-term fluctuations. Kuaishou has now broken through several key moving averages, and the moving average system is showing a bearish alignment.
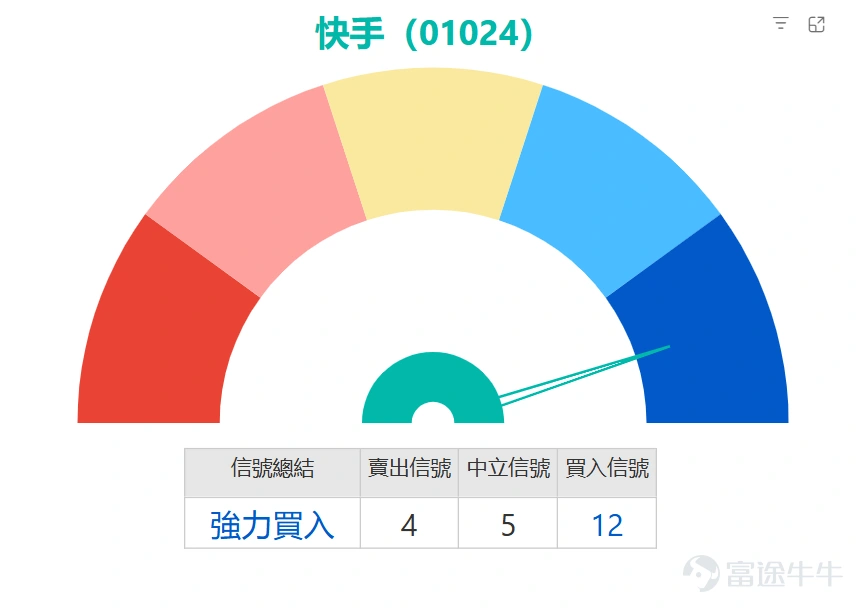
In terms of technical indicators, trend-based indicators (MACD, Ichimoku Cloud, Bollinger Bands) currently show weak characteristics, while oscillation-based indicators (Stochastic Oscillator, CCI, RSI) are all in oversold territory, with the RSI value at 29. The overall structure indicates a divergence between trend and momentum indicators.
The key price range in the current market shows support levels at 57.4 yuan and 52.9 yuan below, and resistance levels at 67.3 yuan and 76.9 yuan above, where the 76.9 yuan level is close to the MA60 moving average.
$KUAISHOU-W (01024.HK)$ The current price is 60.55 yuan, down 3.66%, with an intraday low of 60.05 yuan, hitting a new low since August 2025. The trend has been declining for five consecutive weeks. Over the past five trading days, the cumulative volatility reached as high as 12.3%, indicating significantly increased short-term fluctuations. Kuaishou has now broken through several key moving averages, and the moving average system is showing a bearish alignment. In terms of technical indicators, trend-based indicators (MACD, Ichimoku Cloud, Bollinger Bands) currently show weak characteristics, while oscillation-based indicators (Stochastic Oscillator, CCI, RSI) are all in oversold territory, with the RSI value at 29. The overall structure indicates a divergence between trend and momentum indicators. The key price range in the current market shows support levels at 57.4 yuan and 52.9 yuan below, and resistance levels at 67.3 yuan and 76.9 yuan above, where the 76.9 yuan level is close to the MA60 moving average. Characteristics of warrant street volume changes During the period from February 25 to February 27, 2025, both the call warrants and put warrants of Kuaishou showed a continuous growth trend. The cumulative increase in call warrants was 6.59%, with a new scale addition of 85.43 million units, while the cumulative increase in put warrants was 6.19%, with a new scale addition of 5.23 million units. The difference in cumulative increases between the two types was 0.4 percentage points, with overall trends being basically synchronized. Within this statistical period, the cumulative new scale of call warrants approached 90 million units. If the underlying stock price does not break out upward subsequently, accumulated positions may face concentrated liquidation pressure,...
Characteristics of warrant street volume changes
During the period from February 25 to February 27, 2025, both the call warrants and put warrants of Kuaishou showed a continuous growth trend. The cumulative increase in call warrants was 6.59%, with a new scale addition of 85.43 million units, while the cumulative increase in put warrants was 6.19%, with a new scale addition of 5.23 million units. The difference in cumulative increases between the two types was 0.4 percentage points, with overall trends being basically synchronized.
The cumulative new scale of call warrants during this statistical period approached 90 million units. If the underlying stock price does not break out upward subsequently, the accumulated positions may face concentrated liquidation pressure, potentially amplifying short-term volatility in the underlying stock. Meanwhile, the continuous increase in street volume may push up the implied volatility of related warrant products. If the implied volatility falls back later, the product price will face the dual impact of time value decay and volatility decline. It should be particularly noted that changes in street volume only reflect changes in market position structure and do not have a direct causal relationship with the future trend of the underlying stock, and should not be used as a core basis for investment decisions.
Market Condition Summary
Currently, Kuaishou's underlying stock exhibits structural characteristics of 'weak trend indicators, oversold oscillation indicators,' while the warrant market shows a simultaneous growth trend in call and put street volumes. The overall market structure has certain differentiation characteristics, and it is necessary to continuously monitor potential volatility risks brought by indicator divergence and street volume changes.
In summary, against the backdrop of the stock price falling below all moving averages, the medium-term adjustment structure remains unchanged, so blindly bottom-fishing or being overly optimistic is not advisable. However, dense oversold signals and multiple oscillation indicators suggesting a bottoming-out imply an increasing probability of a technical rebound brewing. In terms of operations, the support area at 57.4 yuan can be considered as a reference point for short-term speculative buying to capture the rebound opportunity, but a strict stop-loss must be set below the second support level at 52.9 yuan. Conversely, if the stock price breaks below 52.9 yuan with heavy trading volume, it would indicate that the downward space will reopen, necessitating decisive stop-loss and exit. The overall strategy should lean towards cautious short-term range trading, and the rebound height should not be overstated until the price successfully recovers and stabilizes above the key moving averages.
Product Review:
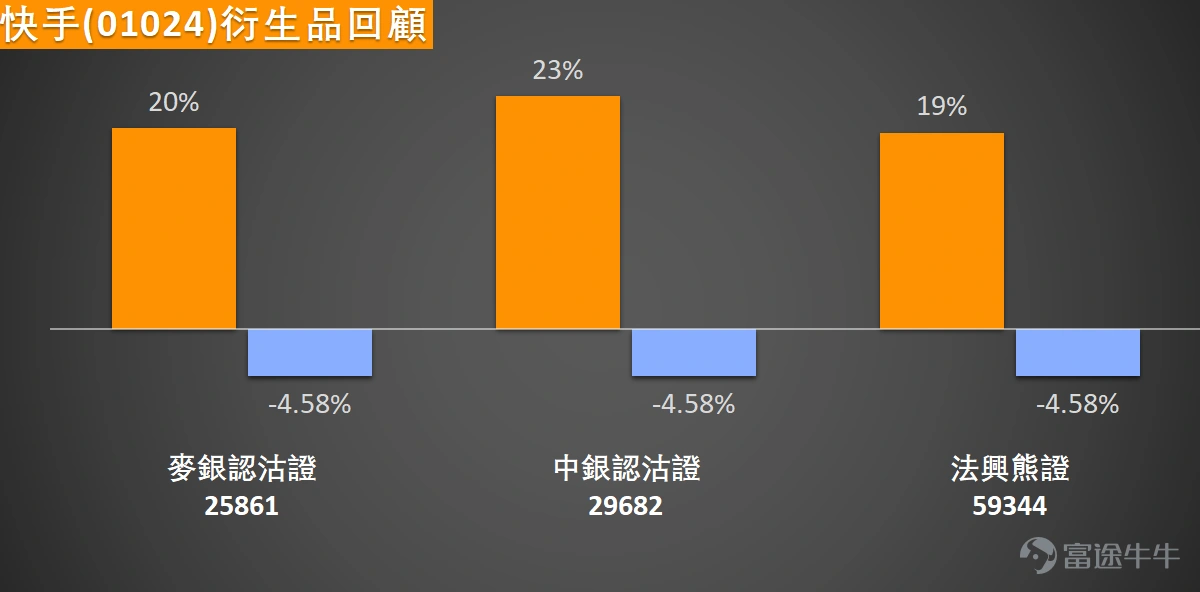
Two days after being mentioned on February 24, 2026, Kuaishou (01024)’s stock price dropped by 4.58%, while related bearish derivative products performed outstandingly, $SG#KUASORP2812Y.P (59344.HK)$ recording a 19% increase in two days, $MBKUASO@EP2605A.P (25861.HK)$ rising by 20%, and $BIKUASO@EP2604A.P (29682.HK)$ the increase reached 23%.
$KUAISHOU-W (01024.HK)$ The current price is 60.55 yuan, down 3.66%, with an intraday low of 60.05 yuan, hitting a new low since August 2025. The trend has been declining for five consecutive weeks. Over the past five trading days, the cumulative volatility reached as high as 12.3%, indicating significantly increased short-term fluctuations. Kuaishou has now broken through several key moving averages, and the moving average system is showing a bearish alignment. In terms of technical indicators, trend-based indicators (MACD, Ichimoku Cloud, Bollinger Bands) currently show weak characteristics, while oscillation-based indicators (Stochastic Oscillator, CCI, RSI) are all in oversold territory, with the RSI value at 29. The overall structure indicates a divergence between trend and momentum indicators. The key price range in the current market shows support levels at 57.4 yuan and 52.9 yuan below, and resistance levels at 67.3 yuan and 76.9 yuan above, where the 76.9 yuan level is close to the MA60 moving average. Characteristics of warrant street volume changes During the period from February 25 to February 27, 2025, both the call warrants and put warrants of Kuaishou showed a continuous growth trend. The cumulative increase in call warrants was 6.59%, with a new scale addition of 85.43 million units, while the cumulative increase in put warrants was 6.19%, with a new scale addition of 5.23 million units. The difference in cumulative increases between the two types was 0.4 percentage points, with overall trends being basically synchronized. Within this statistical period, the cumulative new scale of call warrants approached 90 million units. If the underlying stock price does not break out upward subsequently, accumulated positions may face concentrated liquidation pressure,...
Product Picks:
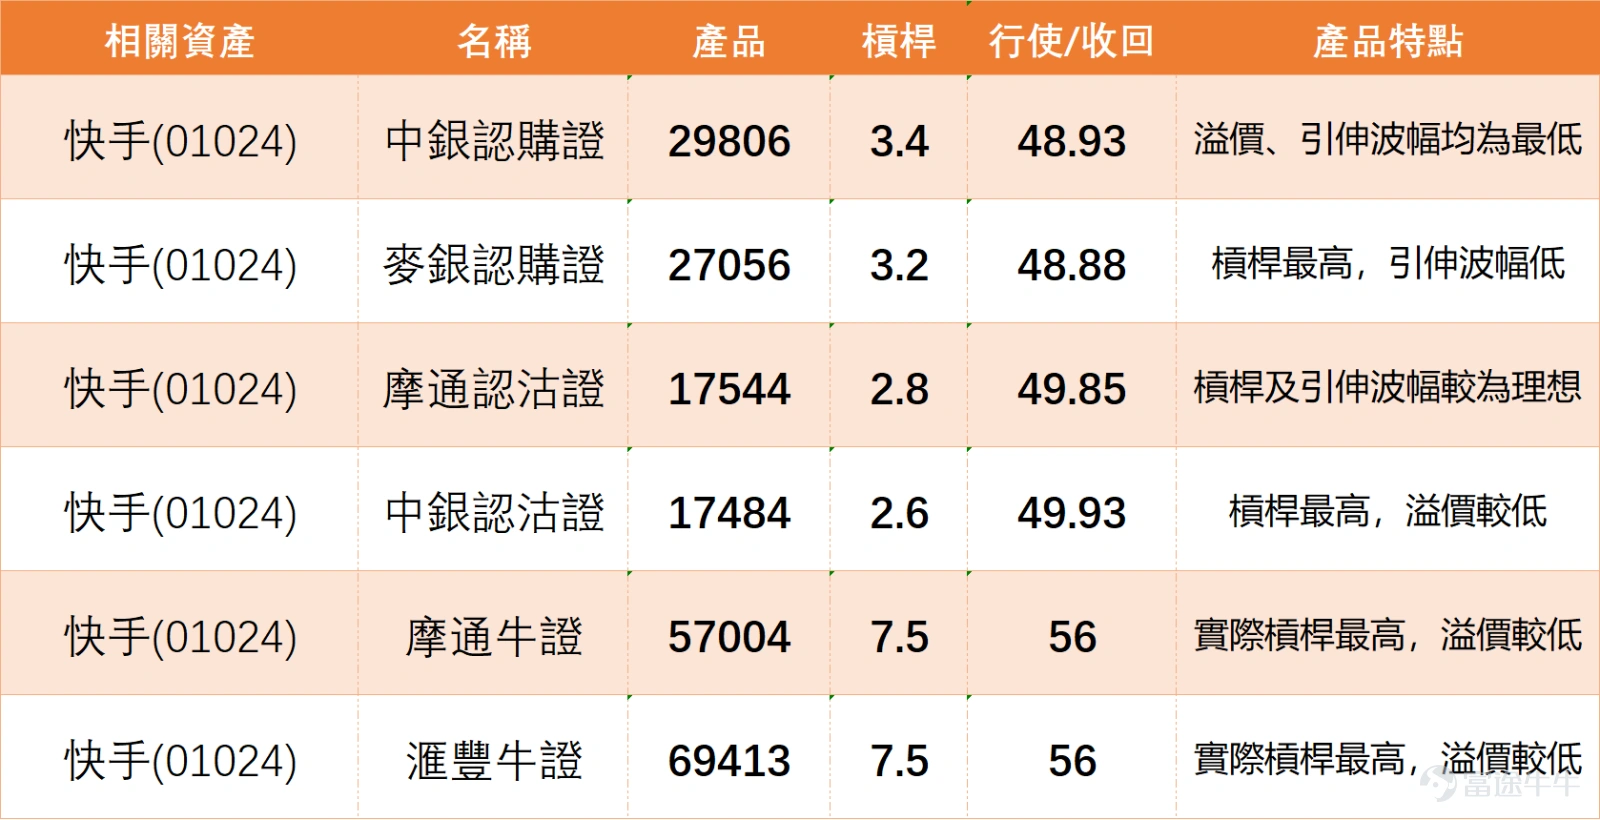
For call warrants, if investors are optimistic about Kuaishou's stock performance, they can consider $BIKUASO@EC2607A.C (29806.HK)$, with an exercise price of 48.93 yuan and leverage of about 3.4 times. This product has the lowest premium and implied volatility among its peers, making it suitable for investors looking to deploy a rebound at a lower cost. Another option is $MBKUASO@EC2607A.C (27056.HK)$, with an exercise price of 48.88 yuan and leverage of approximately 3.2 times. Although the leverage is slightly lower than the former, its implied volatility remains at a low level, and the leverage is the highest among call warrants, making it suitable for investors seeking higher amplification effects.
If a drop in the share price is expected, put warrants can be used for hedging or bearish deployment. $JPKUASO@EP2612A.P (17544.HK)$, with an exercise price of 49.85 yuan and leverage of about 2.8 times, offers both ideal levels of leverage and implied volatility, providing an effective tool for capturing downside risk. Another put warrant option is $BIKUASO@EP2612A.P (17484.HK)$, with an exercise price of 49.93 yuan and leverage of around 2.6 times. This warrant has the highest leverage among put warrants and a relatively low premium, making it suitable for investors looking to deploy a bearish position with higher leverage.
For investors seeking high leverage and who can tolerate the forced redemption risk, bull contracts are a more straightforward bullish instrument. $JP#KUASORC2605B.C (57004.HK)$ and $HS#KUASORC2607D.C (69413.HK)$, with the same forced redemption price of 56 yuan and actual leverage of about 7.5 times, both products offer the highest actual leverage and relatively low premiums, providing efficient bullish opportunities. However, note that losses will occur if the share price touches the forced redemption level.
$KUAISHOU-W (01024.HK)$ The current price is 60.55 yuan, down 3.66%, with an intraday low of 60.05 yuan, hitting a new low since August 2025. The trend has been declining for five consecutive weeks. Over the past five trading days, the cumulative volatility reached as high as 12.3%, indicating significantly increased short-term fluctuations. Kuaishou has now broken through several key moving averages, and the moving average system is showing a bearish alignment. In terms of technical indicators, trend-based indicators (MACD, Ichimoku Cloud, Bollinger Bands) currently show weak characteristics, while oscillation-based indicators (Stochastic Oscillator, CCI, RSI) are all in oversold territory, with the RSI value at 29. The overall structure indicates a divergence between trend and momentum indicators. The key price range in the current market shows support levels at 57.4 yuan and 52.9 yuan below, and resistance levels at 67.3 yuan and 76.9 yuan above, where the 76.9 yuan level is close to the MA60 moving average. Characteristics of warrant street volume changes During the period from February 25 to February 27, 2025, both the call warrants and put warrants of Kuaishou showed a continuous growth trend. The cumulative increase in call warrants was 6.59%, with a new scale addition of 85.43 million units, while the cumulative increase in put warrants was 6.19%, with a new scale addition of 5.23 million units. The difference in cumulative increases between the two types was 0.4 percentage points, with overall trends being basically synchronized. Within this statistical period, the cumulative new scale of call warrants approached 90 million units. If the underlying stock price does not break out upward subsequently, accumulated positions may face concentrated liquidation pressure,...
The street-level holdings of Kuaishou call warrants and put warrants are increasing simultaneously, with a larger scale of new additions in call warrants. What risks or opportunities could this present for ordinary investors? Feel free to share your views in the comment section.
Reminder: This article is for reference only and does not constitute any investment advice. Market data, opinions, and analyses contained herein may change at any time without prior notice. We are not responsible for any losses or damages caused by reliance on the information in this article. Technical analysis only indicates whether certain technical conditions are met; asset performance should be comprehensively evaluated with additional information and should not solely rely on this article for trading decisions. Please note that past performance is not indicative of future results. Be sure to follow "Hong Kong Stock Warrants Jenny" for more professional analysis articles on Hong Kong stock derivatives investment opportunities!
#HongKongStocks #RealTimeAnalysis #WarrantsSelection #WarrantsStrategy #DerivativesHedging #HongKongWarrants Jenny #TechStocks #Kuaishou #01024#$Hang Seng Index (800000.HK)$$Hang Seng TECH Index (800700.HK)$
Risk Disclaimer: The above content only represents the author's view. It does not represent any position or investment advice of Futu. Futu makes no representation or warranty.Read more
Thumbs Up
3
65K Views
Report
Comments
Write a Comment...
3