
English
Back
Open Account
How to view the post-holiday market trend in Hong Kong stocks?
港股窩輪Jenny
joined discussion ·

HKEX Technical Outlook Weakens – Where Is the Rebound Opportunity?

$HKEX (00388.HK)$ The stock exhibited an adjustment pattern today, with prices falling more than 2%, last trading at HKD 404.2. From a technical perspective, HKEX is currently at a key technical juncture, which professional investors should closely monitor.
The current share price of HKEX is slightly above the first support level of HKD 398 but significantly below all major moving averages. The MA10 is at HKD 416.16, MA30 at HKD 425.66, and MA60 at HKD 416.72, indicating that the stock has broken below all short-term moving average supports, reflecting a technically weak trend. However, it is worth noting that the share price remains stable above the second support level of HKD 380, providing some buffer for future performance.
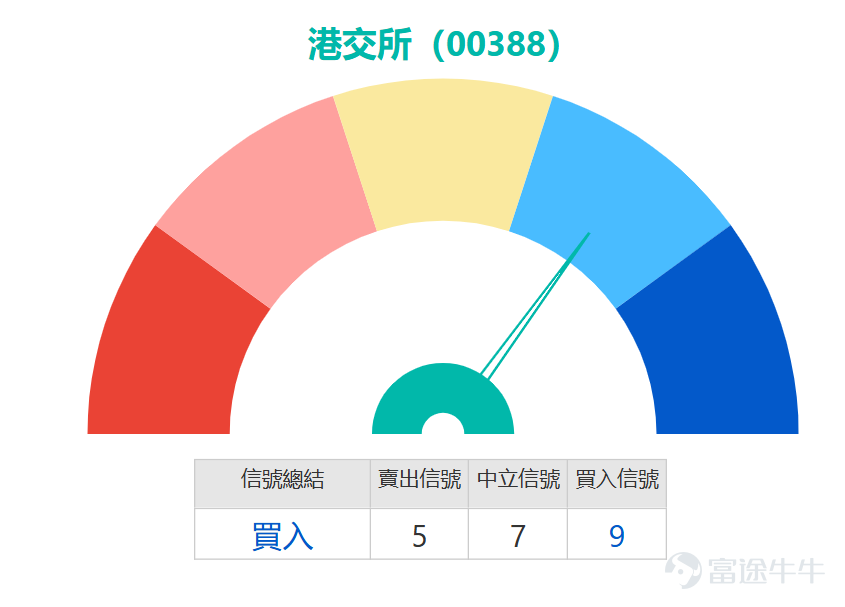
From the oscillation indicators analysis, the RSI reading is 39, close to the oversold region but not fully in oversold territory, suggesting downward pressure has eased somewhat. The Stochastic Oscillator issued a sell signal, showing weak short-term momentum, while the CCI indicator maintains a neutral stance, implying that a trend reversal may be brewing.
Regarding key technical levels, support levels at HKD 398 and HKD 380 will serve as crucial defenses; losing support at HKD 380 could trigger further adjustments. Resistance levels at HKD 419 and HKD 433 form potential rebound targets, especially since the resistance at HKD 419 aligns closely with the MA10 position—breaking through this level would be a significant signal of strengthening technical momentum.
$HKEX (00388.HK)$ The stock exhibited an adjustment pattern today, with prices falling more than 2%, last trading at HKD 404.2. From a technical perspective, HKEX is currently at a key technical juncture, which professional investors should closely monitor. The current share price of HKEX is slightly above the first support level of HKD 398 but significantly below all major moving averages. The MA10 is at HKD 416.16, MA30 at HKD 425.66, and MA60 at HKD 416.72, indicating that the stock has broken below all short-term moving average supports, reflecting a technically weak trend. However, it is worth noting that the share price remains stable above the second support level of HKD 380, providing some buffer for future performance. From the oscillation indicators analysis, the RSI reading is 39, close to the oversold region but not fully in oversold territory, suggesting downward pressure has eased somewhat. The Stochastic Oscillator issued a sell signal, showing weak short-term momentum, while the CCI indicator maintains a neutral stance, implying that a trend reversal may be brewing. Regarding key technical levels, support levels at HKD 398 and HKD 380 will serve as crucial defenses; losing support at HKD 380 could trigger further adjustments. Resistance levels at HKD 419 and HKD 433 form potential rebound targets, especially since the resistance at HKD 419 aligns closely with the MA10 position—breaking through this level would be a significant signal of strengthening technical momentum. Product Review Looking back at the February 11, 2026 article, HKEX shares recorded a 3.01% drop over the following two trading sessions...
Product Review
Reviewing the article from February 11, 2026, the Hong Kong Exchanges and Clearing Limited (HKEX) recorded a 3.01% decline over the following two trading days. Meanwhile, the three bearish derivative products mentioned at the time delivered significant returns, with $JP#HKEX RP2812G.P (57272.HK)$ showing the most outstanding performance, gaining 49% in two days, $BP-HKEX@EP2605A.P (21691.HK)$ rising by 37%, and $BI-HKEX@EP2605A.P (24260.HK)$ also achieving a 33% increase.
$HKEX (00388.HK)$ The stock exhibited an adjustment pattern today, with prices falling more than 2%, last trading at HKD 404.2. From a technical perspective, HKEX is currently at a key technical juncture, which professional investors should closely monitor. The current share price of HKEX is slightly above the first support level of HKD 398 but significantly below all major moving averages. The MA10 is at HKD 416.16, MA30 at HKD 425.66, and MA60 at HKD 416.72, indicating that the stock has broken below all short-term moving average supports, reflecting a technically weak trend. However, it is worth noting that the share price remains stable above the second support level of HKD 380, providing some buffer for future performance. From the oscillation indicators analysis, the RSI reading is 39, close to the oversold region but not fully in oversold territory, suggesting downward pressure has eased somewhat. The Stochastic Oscillator issued a sell signal, showing weak short-term momentum, while the CCI indicator maintains a neutral stance, implying that a trend reversal may be brewing. Regarding key technical levels, support levels at HKD 398 and HKD 380 will serve as crucial defenses; losing support at HKD 380 could trigger further adjustments. Resistance levels at HKD 419 and HKD 433 form potential rebound targets, especially since the resistance at HKD 419 aligns closely with the MA10 position—breaking through this level would be a significant signal of strengthening technical momentum. Product Review Looking back at the February 11, 2026 article, HKEX shares recorded a 3.01% drop over the following two trading sessions...
Product Highlights
Considering the current technical trend and key price levels of the Hong Kong Exchanges, the following selected CBBC and warrant products offer investors diversified choices.
In terms of call warrants, $BI-HKEX@EC2605A.C (23431.HK)$ stood out with 11.8 times leverage and an exercise price of 464.19 yuan. Its premium and implied volatility were the lowest in the market, making it suitable for investors optimistic about HKEX breaking through the 430-yuan resistance level and targeting above 460 yuan. At the same time, $UB-HKEX@EC2605B.C (23336.HK)$ also offers 11.3 times leverage with the same exercise price. Although its leverage is slightly lower than that of Bank of China's product, its premium is relatively lower, making it another good choice for riding the upward trend.
For investors who are bearish on the future market, $BI-HKEX@EP2605A.P (24260.HK)$and$UB-HKEX@EP2605A.P (24280.HK)$ both provide approximately 9.5 times leverage, with an exercise price set at 388.68 yuan, just below the HKEX’s first support level of 398 yuan. If the stock price effectively breaks below this level, both products are expected to generate considerable returns. Among them, BOC Put Warrant (24260) has a relatively lower premium, while UBS Group Put Warrant (24280) has better liquidity.
In the bull and bear certificate space, $HS#HKEX RC2711G.C (54507.HK)$ stands out as the market focus with 21.9 times effective leverage, a recovery price set at 390 yuan, closely aligned with the current 398-yuan support level, and its premium level being the lowest, making it suitable for short-term investors betting on a rebound.
Regarding bearish certificates, $SG#HKEX RP2812A.P (58918.HK)$and$UB#HKEX RP2812D.P (59493.HK)$ Both have a redemption price of 430 yuan, corresponding to the current resistance level. Among them, Societe Generale products offer 14.7x leverage, while UBS Group bear certificate (59493) not only provides 15.3x leverage but also has the lowest market premium, offering an efficient tool for bearish investors.
$HKEX (00388.HK)$ The stock exhibited an adjustment pattern today, with prices falling more than 2%, last trading at HKD 404.2. From a technical perspective, HKEX is currently at a key technical juncture, which professional investors should closely monitor. The current share price of HKEX is slightly above the first support level of HKD 398 but significantly below all major moving averages. The MA10 is at HKD 416.16, MA30 at HKD 425.66, and MA60 at HKD 416.72, indicating that the stock has broken below all short-term moving average supports, reflecting a technically weak trend. However, it is worth noting that the share price remains stable above the second support level of HKD 380, providing some buffer for future performance. From the oscillation indicators analysis, the RSI reading is 39, close to the oversold region but not fully in oversold territory, suggesting downward pressure has eased somewhat. The Stochastic Oscillator issued a sell signal, showing weak short-term momentum, while the CCI indicator maintains a neutral stance, implying that a trend reversal may be brewing. Regarding key technical levels, support levels at HKD 398 and HKD 380 will serve as crucial defenses; losing support at HKD 380 could trigger further adjustments. Resistance levels at HKD 419 and HKD 433 form potential rebound targets, especially since the resistance at HKD 419 aligns closely with the MA10 position—breaking through this level would be a significant signal of strengthening technical momentum. Product Review Looking back at the February 11, 2026 article, HKEX shares recorded a 3.01% drop over the following two trading sessions...
What do you think about the current technical pattern of the Hong Kong Exchanges? Do you believe the 398 yuan support level will hold? Or do you expect the share price to reclaim the 419 yuan resistance and challenge higher levels? Feel free to share your technical analysis views!$Hang Seng Index (800000.HK)$
Remember to follow the 'HK Stock Warrants Jenny' account for more professional technical analysis content.
Friendly reminder: This article is for reference only and does not constitute any investment advice. Market data, opinions, and analyses contained herein may change at any time without prior notice. We are not responsible for any loss or damage caused by reliance on the information in this article. Technical analysis only shows whether certain technical conditions are met; asset performance should be comprehensively evaluated using other sources, and trading decisions should not be made solely based on this article. Please note that past performance is not indicative of future results.
#Hong Kong Stock Exchange #00388 #Technical Analysis #Support and Resistance #Moving Averages #RSI #Stochastic Oscillator #Hong Kong Stocks #Professional Investment #Trading Strategy
Risk Disclaimer: The above content only represents the author's view. It does not represent any position or investment advice of Futu. Futu makes no representation or warranty.Read more
Thumbs Up
4
114K Views
Report
Comments
Write a Comment...
4