
港股節後行情如何看?
【窩輪透視】恆指考驗26200點關鍵支持,量能配合成止跌企穩關鍵
,當日恆指呈下跌態勢,跌幅約1.2%,全日收於26559點。成交量較上週四(5日)略有萎縮,成交額約2478.65億元。
從技術面來看,恆指近期持續回調,盤中一度下探至26200點附近,此類走勢可能影響市場情緒。市場上多空觀點分歧屬正常現象,一方面源於市場波動本身,另一方面也與投資者所關注的時間週期不同有關,部分注重短線交易,部分則從中長期視角進行分析。我們不對市場走勢作出預測,所提供的技術分析與數據僅供參考,旨在協助各位結合自身投資風格進行判斷。
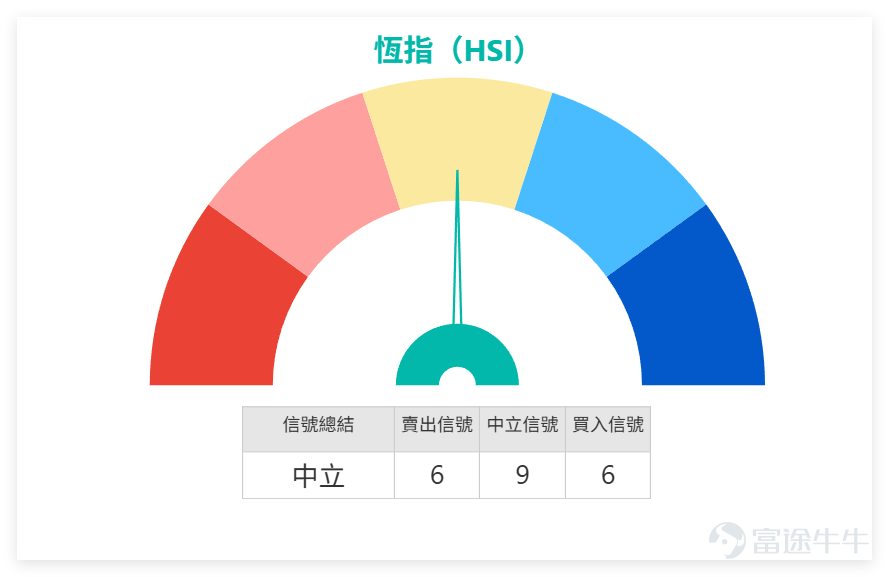
恆指RSI 為 47(中立信號),技術指標總結信號為中立(信號強度 9),多個震盪指標中威廉指標處於超賣狀態但整體偏中立,MACD、CCI 等指標呈賣出信號,整體技術面偏謹慎。支持阻力位方面,支持位:第一支持 26064 點、第二支持 25472 點。阻力位:第一阻力 27254 點、第二阻力 27648 點。

2月6日,港股主要藍籌股普遍下跌,科技股跌幅相對顯著,部分個股出現超賣跡象,內銀股則有個別逆勢收漲,具體技術細節如下:
1. 騰訊控股(00700):收547.5元(跌1.97%),RSI 25超賣,技術信號強力買入;股價低於各條均線,走弱但存反彈機會。
2. 阿里巴巴(09988):收155.0元(跌2.88%),RSI 44,技術信號強力買入;股價略高於MA60,短期均線承壓。
3. 美團-W(03690):收91.4元(跌2.56%),RSI 33超賣,技術信號強力買入;股價低於各均線,動弱或築底。
4. 匯豐控股(00005):收134.8元(跌2.67%),RSI 58,技術信號中立;股價接近MA10,中長期趨勢仍強。
5. 友邦保險(01299):收83.5元(跌5.54%),RSI 47,技術信號強力買入;股價略高於MA60,大跌後存反彈可能。
6. 香港交易所(00388):收407.6元(跌1.64%),RSI 39,技術信號強力買入;股價低於各均線,走弱但指標偏積極。
7. 建設銀行(00939):收7.97元(升0.63%),RSI 58,技術信號中立;股價高於MA10/MA30,短線動能轉強。
8. 中國平安(02318):收69.6元(跌2.18%),RSI 55,技術信號中立偏買入;股價高於MA30/MA60,中長期尚可。
9. 工商銀行(01398):收6.49元(升0.46%),RSI 60,技術信號中立;均線多頭排列,但提示超買風險。
10. 中國移動(00941):收80.2元(跌0.25%),RSI 49,技術信號中立;股價高於MA10,低於MA30/MA60,走勢平穩。
藍籌股2月6日呈現「普遍下跌、個別逆勢」的格局,操作上可重點關注兩點:一是科技股的超賣信號,若後續出現成交量回升,可結合自身交易週期適度關注;二是內銀股的分化走勢,避免盲目跟漲,重點參考均線與RSI指標的配合度。
(一)近期窩輪牛熊回顧
回顧2月2日推薦的兩隻恆指牛證,表現如下(數據僅供參考):
1. 摩通牛證(66685): 2日後升幅11%,同期恆指上漲0.27%;
2. 瑞銀牛證(65182): 2日後升幅12%,同期恆指上漲0.27%。
溫馨提示:窩輪牛熊產品帶有槓桿屬性,波動較大,投資者需密切關注市場走勢,謹慎操作,注意控制風險。
(二)窩輪牛熊精選:
結合恆指走勢及技術面,精選兩隻窩輪產品,供各位投資者參考:
1. 瑞銀認購證(23091):槓桿13,行使價28341,產品特點為槓桿及引伸波幅較為理想;
2. 中銀牛證(63488):槓桿25.3,收回價25595,產品特點為溢價相對較低。
風險提示:投資者需結合自身對市場的判斷,謹慎選擇。
面對恆指持續回調,你是選擇持幣觀望還是擇機佈局?快來評論區講下你的睇法。
溫馨提示:本文章不構成任何投資建議。
本文章僅供參考,並不構成任何投資建議。內容所載的市場數據、觀點與分析可能隨時變動,恕不另行通知。對於因依賴本文章資訊而導致的任何損失或損害,我們概不負責。技術分析僅顯示部分技術條件是否滿足,應結合其他資料全面評估資產表現,不應單憑本文作出交易決策。請注意,過往表現不代表未來結果。
#港股 #恆指 #即時分析 #窩輪精選 #窩輪攻略 #衍生品避險 #藍籌股 #科技股 #金融股 #技術分析
風險及免責聲明:以上內容僅代表作者個人觀點,不代表富途任何立場,亦不構成任何投資建議,富途對此不作任何保證與承諾。更多信息
評論
發表評論