English
Back
Open Account
How to view the post-holiday market trend in Hong Kong stocks?
港股窩輪Jenny
joined discussion · Feb 9 09:27

[Warrant Perspective] The tug-of-war between long and short signals for the technology index continues, with the short-term direction yet to be clarified.

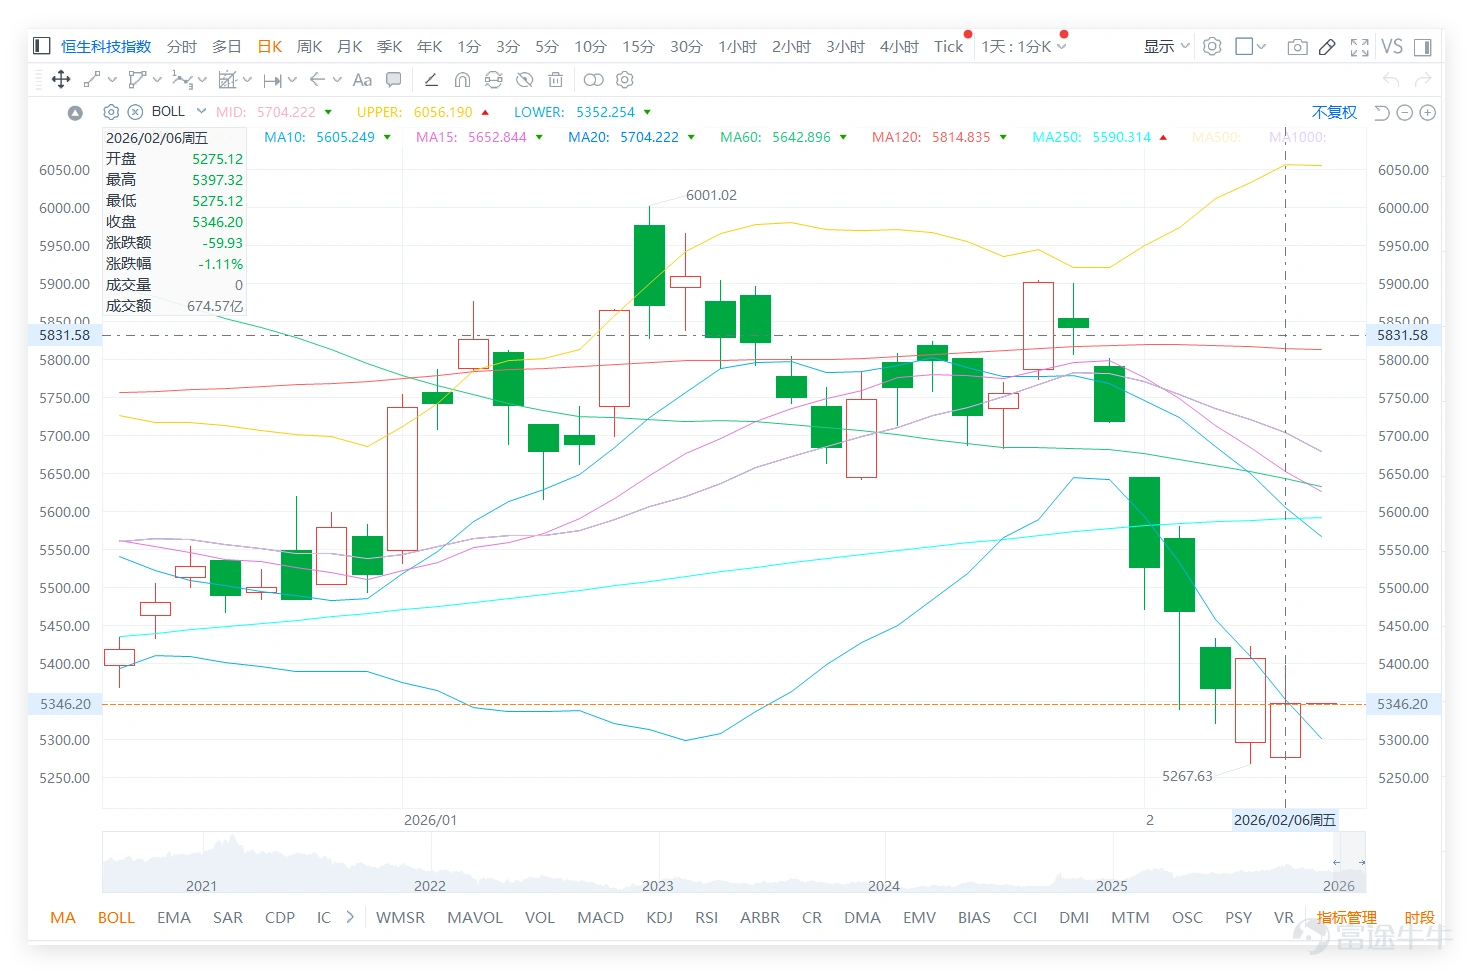
On February 6, the market closed at 5,346.2 points, a single-day drop of 1.11%, with a trading volume of 67.457 billion yuan.
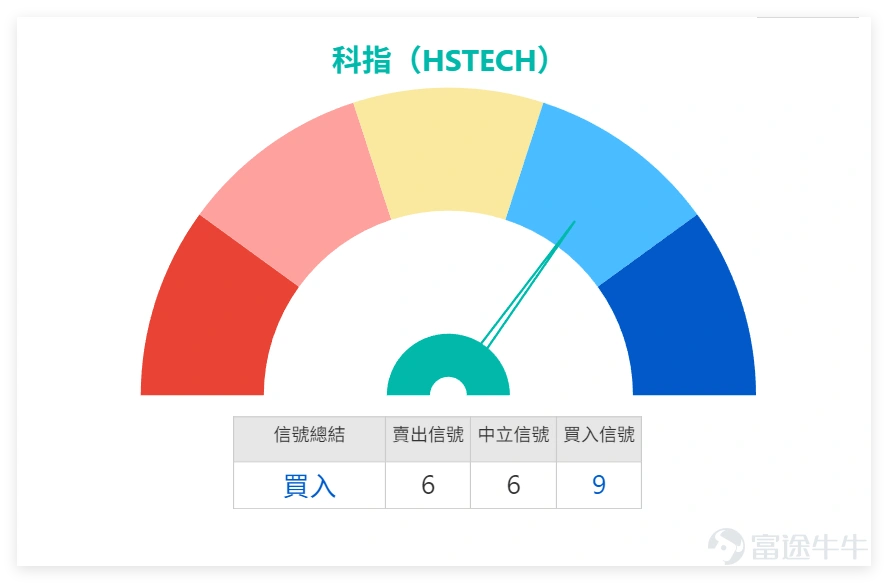
Technical indicators show that the RSI indicator at 32 is approaching the oversold region (RSI below 30 is typically considered oversold), with a summarized technical signal of 'Buy' at strength level 9. MACD signals a sell, but multiple oscillators are in a neutral state, showing divergence in the short-term technical outlook.
$Hang Seng TECH Index (800700.HK)$ On February 6, the market closed at 5,346.2 points, a single-day drop of 1.11%, with a trading volume of 67.457 billion yuan. Technical indicators show that the RSI indicator at 32 is approaching the oversold region (RSI below 30 is typically considered oversold), with a summarized technical signal of 'Buy' at strength level 9. MACD signals a sell, but multiple oscillators are in a neutral state, showing divergence in the short-term technical outlook. Support levels are clearly visible at 5,188 points (Support 1) and 4,955 points (Support 2); resistance levels are seen at 5,601 points (Resistance 1) and 5,802 points (Resistance 2). A 5-day volatility of 7% indicates increased short-term fluctuations, combined with a 56% probability of an uptrend. Investors may focus on whether effective support can form near 5,188 points; if stabilized, the likelihood of a rebound increases. Technical pattern analysis of key technology stocks as of February 6, dissecting individual stock movements and trading opportunities: 1. $TENCENT (00700.HK)$ : Closed at 547.5 yuan, down 1.97%. The share price is significantly below the MA10 (589.9 yuan) and MA30 (605.27 yuan), reflecting a typical short-to-medium term bearish moving average alignment. The RSI indicator at 25 has entered the oversold zone, with a summarized technical signal of 'Buy' at strength level 10, suggesting strong short-term technical rebound potential. 2. $MEITUAN-W (03690.HK)$ : Closed at 91.4 yuan, down 2.56%. The share price is below the MA10 (95.3...
Support levels are clearly visible at 5,188 points (Support 1) and 4,955 points (Support 2); resistance levels are at 5,601 points (Resistance 1) and 5,802 points (Resistance 2). A 7% volatility over five days indicates increased short-term fluctuations. With a 56% probability of an upward trend, investors can focus on whether effective support forms near 5,188 points; if stabilized, the likelihood of a rebound increases.
$Hang Seng TECH Index (800700.HK)$ On February 6, the market closed at 5,346.2 points, a single-day drop of 1.11%, with a trading volume of 67.457 billion yuan. Technical indicators show that the RSI indicator at 32 is approaching the oversold region (RSI below 30 is typically considered oversold), with a summarized technical signal of 'Buy' at strength level 9. MACD signals a sell, but multiple oscillators are in a neutral state, showing divergence in the short-term technical outlook. Support levels are clearly visible at 5,188 points (Support 1) and 4,955 points (Support 2); resistance levels are seen at 5,601 points (Resistance 1) and 5,802 points (Resistance 2). A 5-day volatility of 7% indicates increased short-term fluctuations, combined with a 56% probability of an uptrend. Investors may focus on whether effective support can form near 5,188 points; if stabilized, the likelihood of a rebound increases. Technical pattern analysis of key technology stocks as of February 6, dissecting individual stock movements and trading opportunities: 1. $TENCENT (00700.HK)$ : Closed at 547.5 yuan, down 1.97%. The share price is significantly below the MA10 (589.9 yuan) and MA30 (605.27 yuan), reflecting a typical short-to-medium term bearish moving average alignment. The RSI indicator at 25 has entered the oversold zone, with a summarized technical signal of 'Buy' at strength level 10, suggesting strong short-term technical rebound potential. 2. $MEITUAN-W (03690.HK)$ : Closed at 91.4 yuan, down 2.56%. The share price is below the MA10 (95.3...
Technical pattern analysis of key technology stocks on February 6, breaking down individual stock movements and trading opportunities:
1. $TENCENT (00700.HK)$ : Closed at $547.5, down 1.97%. The stock price is significantly below the MA10 ($589.9) and MA30 ($605.27), showing a typical short- to medium-term bearish moving average arrangement. The RSI indicator at 25 has entered the oversold zone. The technical indicator summary signal is 'Buy' with a strength rating of 10, indicating strong short-term technical rebound momentum.
2. $MEITUAN-W (03690.HK)$ : Closed at $91.4, down 2.56%. The stock price is below the MA10 ($95.32) and MA30 ($99.61). The RSI indicator at 33 is approaching the oversold region. The technical indicator summary signal is 'Buy' with a strength rating of 10. Trading volume decreased by 15% compared to the previous session, indicating reduced selling pressure. It is important to observe the support level at the $90 mark; stabilization here could lead to a technical rebound.
3. $XIAOMI-W (01810.HK)$ : Rose against the trend by 0.74% to close at $35.18, making it one of the few tech stocks to rise. The stock price is slightly below the MA10 ($35.29), with the RSI indicator at 37 in a neutral-to-weak region. The technical indicator summary signal is 'Buy' with a strength rating of 10.
4. $NTES-S (09999.HK)$ : Closed at $188.3, down 2.23%. The stock price is below the MA10 ($200.82) and MA30 ($212.17), with the RSI indicator at 26 in an oversold state. The technical indicator summary signal is 'Buy' with a strength rating of 10. Five-day volatility reached 9%, indicating high fluctuations; investors should be mindful of risk management.
5. $JD-SW (09618.HK)$ : Closed at $106.9, down 1.75%. The stock price is below the MA10 ($111.66) and MA30 ($113.21), with the RSI indicator at 31 showing weakness. The technical indicator summary signal is 'Buy' with a strength rating of 10. Strong support exists near $105; it is worth observing whether the price stabilizes at this level.
The tech sector was broadly under pressure on February 6, with leading stocks such as Tencent, Alibaba, and Meituan recording significant declines. Technical indicators generally reflect oversold or weak signals. Although most stocks show a 'Buy' signal in the 'technical indicator summary,' this may suggest a potential technical rebound after prolonged declines. Investors should monitor whether prices stabilize at key support levels.
Review and Selection of Bull/Bear Warrants:
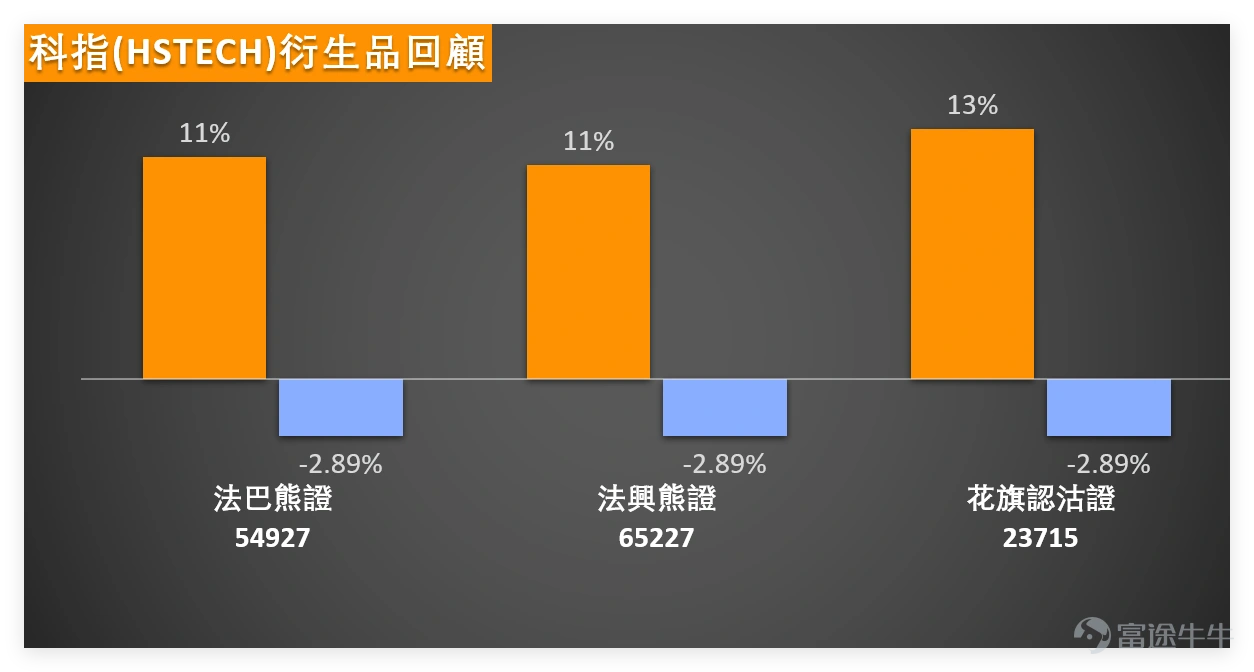
Performance Review: The Tech Index recommended on February 2 $BP#HSTECRP2901L.P (54927.HK)$$SG#HSTECRP2812Y.P (65227.HK)$ Both recorded an 11% increase over two days, while Citi's put warrants (23715) surged 13%, effectively hedging against the Tech Index’s 2.89% decline during the same period. Among them, $CTHSTEC@EP2609A.P (23715.HK)$The implied volatility is the lowest, showing more stability when market volatility increases.
$Hang Seng TECH Index (800700.HK)$ On February 6, the market closed at 5,346.2 points, a single-day drop of 1.11%, with a trading volume of 67.457 billion yuan. Technical indicators show that the RSI indicator at 32 is approaching the oversold region (RSI below 30 is typically considered oversold), with a summarized technical signal of 'Buy' at strength level 9. MACD signals a sell, but multiple oscillators are in a neutral state, showing divergence in the short-term technical outlook. Support levels are clearly visible at 5,188 points (Support 1) and 4,955 points (Support 2); resistance levels are seen at 5,601 points (Resistance 1) and 5,802 points (Resistance 2). A 5-day volatility of 7% indicates increased short-term fluctuations, combined with a 56% probability of an uptrend. Investors may focus on whether effective support can form near 5,188 points; if stabilized, the likelihood of a rebound increases. Technical pattern analysis of key technology stocks as of February 6, dissecting individual stock movements and trading opportunities: 1. $TENCENT (00700.HK)$ : Closed at 547.5 yuan, down 1.97%. The share price is significantly below the MA10 (589.9 yuan) and MA30 (605.27 yuan), reflecting a typical short-to-medium term bearish moving average alignment. The RSI indicator at 25 has entered the oversold zone, with a summarized technical signal of 'Buy' at strength level 10, suggesting strong short-term technical rebound potential. 2. $MEITUAN-W (03690.HK)$ : Closed at 91.4 yuan, down 2.56%. The share price is below the MA10 (95.3...
Product Picks:
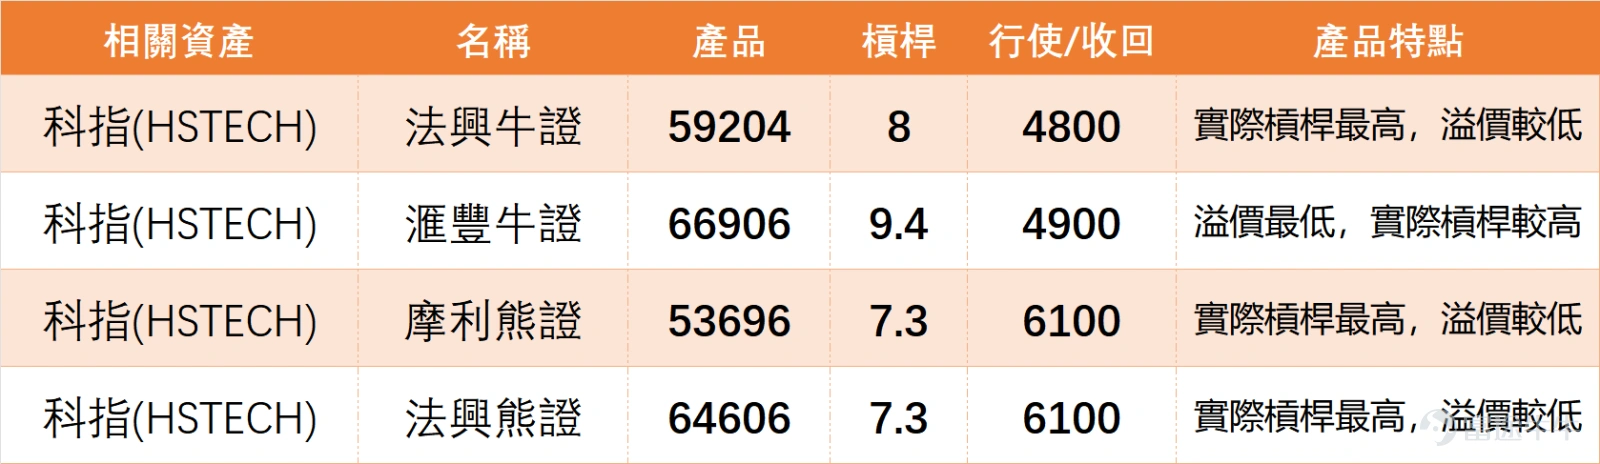
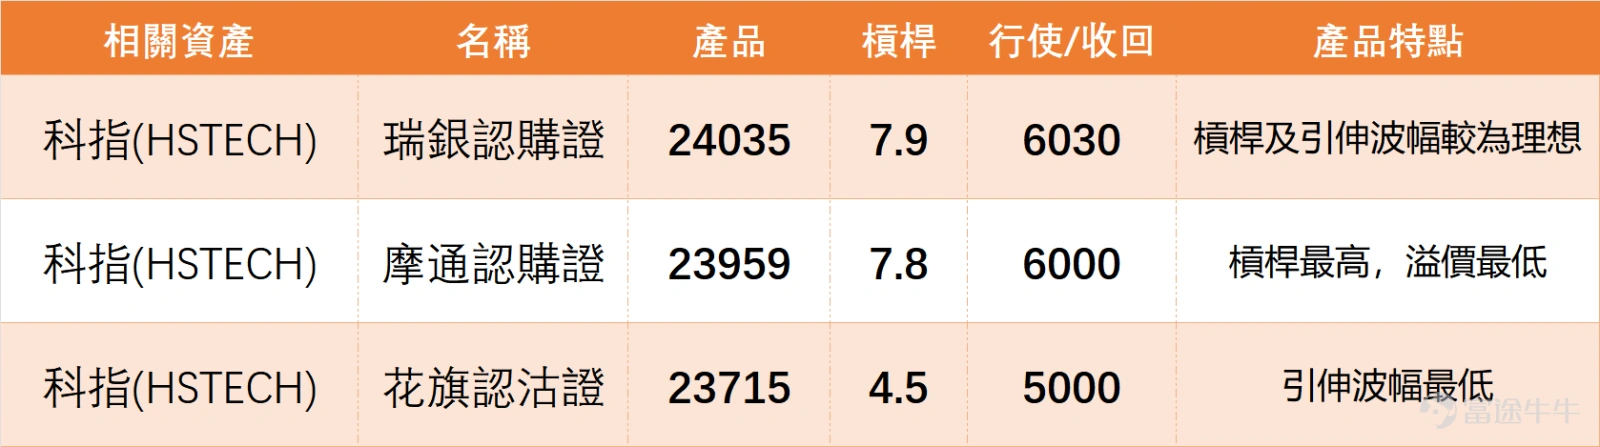
1、 $UBHSTEC@EC2606A.C (24035.HK)$: Strike price at 6030 points, leverage of 7.9 times, with relatively ideal implied volatility. This product expires in August 2026, with slower time decay, suitable for investors optimistic about a mid-term rebound in the technology index.
2、 $HS#HSTECRC2605B.C (66906.HK)$: Recovery price at 4900 points, actual leverage of 9.4 times, with the lowest premium. The product has a safety cushion of about 9.5% from the recovery price, offering potentially higher returns when the tech index stabilizes and rebounds.
3、 $CTHSTEC@EP2609A.P (23715.HK)$: Strike price at 5000 points, with the lowest implied volatility. When the tech index fails to stabilize effectively, it can serve as a hedging tool to reduce portfolio risk.
$Hang Seng TECH Index (800700.HK)$ On February 6, the market closed at 5,346.2 points, a single-day drop of 1.11%, with a trading volume of 67.457 billion yuan. Technical indicators show that the RSI indicator at 32 is approaching the oversold region (RSI below 30 is typically considered oversold), with a summarized technical signal of 'Buy' at strength level 9. MACD signals a sell, but multiple oscillators are in a neutral state, showing divergence in the short-term technical outlook. Support levels are clearly visible at 5,188 points (Support 1) and 4,955 points (Support 2); resistance levels are seen at 5,601 points (Resistance 1) and 5,802 points (Resistance 2). A 5-day volatility of 7% indicates increased short-term fluctuations, combined with a 56% probability of an uptrend. Investors may focus on whether effective support can form near 5,188 points; if stabilized, the likelihood of a rebound increases. Technical pattern analysis of key technology stocks as of February 6, dissecting individual stock movements and trading opportunities: 1. $TENCENT (00700.HK)$ : Closed at 547.5 yuan, down 1.97%. The share price is significantly below the MA10 (589.9 yuan) and MA30 (605.27 yuan), reflecting a typical short-to-medium term bearish moving average alignment. The RSI indicator at 25 has entered the oversold zone, with a summarized technical signal of 'Buy' at strength level 10, suggesting strong short-term technical rebound potential. 2. $MEITUAN-W (03690.HK)$ : Closed at 91.4 yuan, down 2.56%. The share price is below the MA10 (95.3...
Risk Warning:Derivative investments have high leverage characteristics; changes in implied volatility may impact product prices. The tech index has significant short-term fluctuations (5-day range of 7%), so investors need to evaluate based on their own risk tolerance to avoid excessive leverage.
Which resistance level do you think will be broken first during the tech index rebound? (A, 5601 points. B, 5802 points.)Come share your thoughts in the comment section.
For more analysis, be sure to follow Jenny's daily updates on "HK Stock Warrants"!
Disclaimer: This article does not constitute any investment advice.
This article is for reference only and does not constitute any investment advice. The market data, opinions, and analysis contained herein may change at any time without prior notice. We are not responsible for any loss or damage caused by reliance on the information in this article. Technical analysis only shows whether certain technical conditions are met; a comprehensive assessment of asset performance should be conducted using additional data. Decisions to trade should not be based solely on this article. Please note that past performance is not indicative of future results.
#HongKongStocks #RealTimeAnalysis #WarrantsSelection #WarrantsStrategy #DerivativesHedging #HongKongWarrantsJenny #TechIndex #TechStocks #TechnicalAnalysis
Risk Disclaimer: The above content only represents the author's view. It does not represent any position or investment advice of Futu. Futu makes no representation or warranty.Read more
Thumbs Up
4
128K Views
Report
Comment (1)
Write a Comment...
1
4