
BTC surpasses $75,000! Has the upward channel been fully opened?
January Summary of the Cryptocurrency Market: Judging from Four Dimensions, BTC's 'Deep Bear Market' Has Become a High Probability Event | Bitcoin | Bear Market | Research Report | Cryptocurrency Market Analysis
As consensus becomes mainstream and Wall Street capital flows in, $Bitcoin (BTC.CC)$ Bitcoin is gradually becoming 'the leading indicator of changes in global liquidity and risk appetite.' This means that its price movements and even cycle patterns will increasingly be influenced by the attitudes and actions of global risk capital, represented by the United States.
The internal market dynamics of Bitcoin around the four-year halving cycle remain influential, shaping the market trends and cycle patterns of this emerging asset alongside newly entered risk capital.
Regarding the continuous decline of Bitcoin since November, in the December 2025 monthly report, we proposed two observation frameworks: 'Deep Bear Market' and 'Cooling Bear Market,' along with the formation conditions and temporal-spatial performance of both patterns.
By the end of January 2026, with the finalization of the new Federal Reserve chair, expectations for global risk capital’s risk appetite are likely to decrease further. Bitcoin's price has fallen below the low point on November 21st, and based on multidimensional assessments from the 'Bitcoin Cycle Multi-Factor Analysis Model,' we believe the probability of this decline being a 'Deep Bear Market' has increased and may be confirmed in the near future.
Based on this assessment, EMC Labs believes that the depth and duration of the current correction starting in October will exceed the three 'Cooling Bear Markets' since January 2023, aligning more closely with the 'Deep Bear Markets' following the previous four halving cycles. Whether the adjustment depth exceeds 70% and whether the downturn lasts close to 12 months will depend on the vulnerability and liquidation timeline of institutional players, changes in U.S. macro liquidity, and progress in relevant U.S. industrial policies.

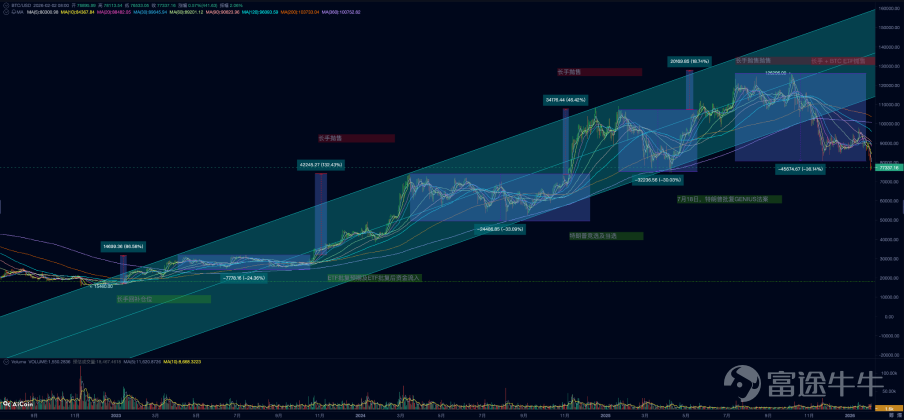
BTC Price Daily Chart
Macroeconomic Liquidity: New Fed Chair Triggers Sudden Change in Expectations
On December 23, the US reported that Q3 actual GDP annualized quarter-on-quarter growth reached 4.3%, surpassing expectations of 3.3% and the previous value of 3.8%. Meanwhile, the Q3 core Personal Consumption Expenditure (PCE) price index annualized quarter-on-quarter was 2.9%, higher than the previous value of 2.6%, and also far from the Fed’s target of 2%.
Subsequently released non-farm data also showed that the US job market has cooled somewhat but remains relatively stable.
These data indicate that the previously mainstream pricing of a 'soft landing/hard landing' dichotomy needs to be expanded. While the probability of a 'hard landing' has decreased, the likelihood of a 'no landing' scenario has increased. This means stronger economic growth, stubborn inflation, and the Fed's monetary policy being unable to smoothly pivot to easing. Rate cuts may be later, slower, or even reversed with potential discussions of re-hiking if the economy overheats. This aligns with the Fed's dot plot once showing only one rate cut in 2026.
If the risk of 'no landing' rises, the market could adjust upwards on 'terminal rates/extended high-rate periods/term premium,' leading to an increase in discount rates and persistently high financing costs. Particularly when real interest rates and the US dollar strengthen simultaneously, long-duration assets such as tech stocks and Bitcoin valuations will face pressure.
However, the market did not immediately react significantly, with the Nasdaq showing a sideways consolidation pattern.
On January 30, US President Trump officially announced Kevin Warsh as the nominee for Federal Reserve Chairman.
Regarding the direction of the Federal Reserve, Kevin Warsh wrote an article titled 'The Federal Reserve's Broken Leadership' in the Wall Street Journal last November. In it, he pointed out that inflation primarily stems from the Fed's own policy decisions (such as excessive money printing), rather than solely supply chain or geopolitical factors. The widespread adoption of AI technology will significantly boost productivity, allowing strong economic growth without triggering inflation, thus creating room for substantial rate cuts by the Fed.
Cutting interest rates reduces corporate financing costs and US fiscal spending pressures, a proposition that aligns with Trump's wishes. However, he also presented another bold view in both the article and subsequent interviews — the Fed's bloated balance sheet (QE policy) distorts market pricing, and liquidity should be withdrawn through 'quantitative tightening' (QT policy), serving as a 'cover' or compensation for lowering benchmark rates.
With Kevin Warsh's victory in the Federal Reserve Chair race, equities and commodities markets have begun pricing in the possibility of a new round of 'quantitative tightening' by the Fed. If quantitative tightening is restarted, the yield on ten-year US Treasuries may continue to rise, further compressing the valuation of long-duration assets.
After the announcement, gold and silver, already crowded trades, plummeted violently by 8.35% and 25.5%, respectively, on the 30th. Bitcoin, which had already broken down on the 29th, continued to fall over Friday and the weekend, fully reflecting its characteristic as a 'leading indicator of global liquidity and risk appetite changes.'
Aside from the new pricing expectations brought by the newly appointed Fed Chair, the slowdown in Treasury spending, rising account balances, and declining reserves at Fed depository institutions have led to another drop in net supply from the Federal Reserve, tightening US dollar liquidity once again.

Fed net liquidity
The decline of Bitcoin (BTC) in January was also influenced by the postponement of the vote on the CLARITY Act due to analysis by Coinbase and traditional banks. In fact, BTC’s main rebound this month was driven by positive expectations surrounding the CLARITY Act vote. After the vote was suspended, BTC fell back to around $90,000. By the eve of the Fed Chair's announcement, macro liquidity and risk appetite expectations re-emerged as the primary pricing factors, triggering a new round of declines for BTC, with prices falling as low as $75,644.15.
Crypto Market: Loss of Liquidity Worsens
Following the return of capital inflows to the crypto market in December, BTC stabilized around $90,000 and rebounded to nearly $98,000. However, in January, there were significant outflows through stablecoin and Bitcoin ETF channels, with total monthly outflows amounting to approximately $2.868 billion, comparable to the $2.922 billion outflow seen in November.

Monthly Crypto Market Fund Flow Statistics
Outflow structure is also deteriorating.
In November, outflows were mainly through the Bitcoin ETF channel, with only minor outflows from stablecoins. During the rebound in December, there were small inflows into stablecoins while outflows persisted through the Bitcoin ETF channel. This month, stablecoins saw massive outflows of up to $6.768 billion, making it the second-largest monthly outflow in this cycle, surpassed only by the $7.648 billion outflow in May 2025. Additionally, funds flowing through the Bitcoin ETF channel, which has been the most important driver of this cycle, have experienced continuous outflows for three months, setting a record for the longest outflow streak in this cycle.
Funds inside exchanges and Bitcoin ETF channel funds are flowing out simultaneously, indicating that the loss of liquidity in the Bitcoin ETF channel caused by worsening liquidity expectations has spread to internal funds within the crypto market. It also implies that DAT companies are now the sole remaining buyers in the current market.
For assets lacking free cash flow and buybacks, Bitcoin price increases primarily rely on enhanced macro liquidity and consensus-driven allocation growth. The new Fed Chair advocating both 'rate cuts' and 'quantitative tightening' may not bode well for Bitcoin, an asset with no intrinsic cash flow and high duration. The loss of liquidity in both the Bitcoin ETF channel and stablecoin channels may just be the beginning.
Cycle Phase: Probability of 'Deep Bear Market' Significantly Increased
Bitcoin is currently in the midst of a historic transition from early investors to mature-phase investors. This unique phase makes it particularly difficult to determine the cycle pattern, duration, and scope of the new phase.
At present, we tend to prioritize using the 'old cycle' (i.e., the four-year halving cycle) as the main axis of intrinsic movements — incorporating macro liquidity changes, on-exchange capital movement patterns, on-chain profit and loss status, and other multi-dimensional indicators for comprehensive analysis.
First, let’s examine the long-term and short-term on-exchange movement.

Long and short position statistics
Prices reaching the top are often caused by macro liquidity turning points. During the price increase, early long-term holders continuously sell their positions to short-term traders (short hands) and long-term holders entering the market in the mid-to-late stages. The more early long-term holders sell, the looser the market chips become, leading to greater market volatility. When liquidity expectations change, buying pressure from short-term traders weakens, unable to absorb selling pressure from long-term holders, triggering a price decline. Afterward, short-term traders join in selling, pushing prices further down. Without external buffering, allowing the market to fall freely, prices often reach the cycle bottom only after long-term holders who entered in the mid-to-late stages start selling as well. As the bear market progresses, long-term holder positions initially show a decline, then gradually rise again.
Currently, the selling by long-term holders is still ongoing, but their chip holdings remain at historically high levels without significant re-accumulation, indicating that the bear market is likely still in its early stages.
Secondly, let’s look at capital supply.
A bear market destroys both confidence and capital, especially during a 'deep bear market.' Capital can be viewed as an expression of the overall participants' sentiment, which shows very clear trends. Once a bear or bull market is established, the outflow or inflow trend is often difficult to reverse in a short period.

Stablecoin supply
We select stablecoin channel funds as a representative indicator for observation. Due to historical chip distribution reasons, Bitcoin price increases require continuous capital inflows. Once inflows slow down or stop, it often leads to the formation of a cycle top. In this cycle, the growth of stablecoin channel funds stopped after October 2025, with an outflow of $6.8 billion in January this year, seemingly confirming a trend reversal. The current stage resembles April or May 2022, suggesting that the market is in the early stages of a bear market. If capital continues to withdraw, it will inevitably push prices further down. The shift from capital withdrawal to inflow typically takes over a year. Only after the market experiences the bottom and recovery, re-establishing an upward trend, does overall capital usually turn into positive inflow.
Looking again at the on-chain profit and loss status.
Due to Bitcoin's transparent network, we are able to see the cost price and profit/loss status of all UTXOs, which helps us observe whether a 'deep bear market' has been established and at what stage it currently stands.
Rather than examining the profitability of a specific group, we adopt a macro perspective by statistically analyzing the profit/loss status of all UTXOs. This allows us to assess the overall pressure faced by market participants and their 'capitulation' (stop-loss) state under significant stress.
In the early phase of the cycle, during the recovery period, MVRV gradually rises, crossing above the middle band to form a bull market where the overall market is in a profitable state until it crosses above the upper band. As more long-term holders sell to take profits, market pressure increases, leading to a price drop. During the process of the price peaking, there may be several mid-term corrections, with MVRV potentially retreating to the middle band. Eventually, the balance between selling pressure and buying power reverses, causing the middle band to fail to support MVRV, and the market as a whole starts transitioning into losses.

MVRV Deviation Bands
After the market decline in November broke below the middle band, mid-month MVRV attempted to recover the middle band but has since failed and fallen below the November low. This breakdown may repeat, but once it is confirmed to move significantly away from the middle band, a 'deep bear market' can clearly unfold.
Based on historical experience, this breakdown might see multiple attempts to recover, ultimately resulting in more bulls giving up resistance, with an increasing number of holders opting to cut losses. This drives the MVRV value further down until it reaches the lower band, entering the cycle bottom through token exchange.
Finally, let’s examine the so-called 'cycle law.'
The formation of the cycle law stems from Bitcoin's four-year halving cycle and its correlation with broader financial cycles. Bitcoin emerged as a response from the crypto community to the massive monetary easing following the 2008 subprime mortgage crisis, combined with its design feature of halving issuance every four years. Over the past 17 years, these two factors have collectively shaped Bitcoin's cyclical pattern. Despite voices in the market suggesting that traditional 'cycle laws' might fail due to changes in the current U.S. interest rate cycle and the inflow of funds from Bitcoin ETFs, we still see them holding true. The reason may be that a large portion of the crypto community, who hold substantial amounts of Bitcoin, still adhere to this 'ideological imprint,' basing their buy/sell decisions on it.

Comparison of Bitcoin price trends post-halving over the years
So far this cycle, the BTC's peak and decline have largely corresponded to the timing of the previous two cycles’ peaks. If the subsequent trend continues to align, a 'deep bear market' could soon be confirmed, possibly leading to steeper declines and requiring a longer time to gradually reach the market bottom by the second half of 2026.
Of course, the cyclicality is just an empirical observation, but its accuracy compels us to take it seriously.
Based on our analysis across four dimensions — 'long and short-term market movements,' 'capital supply,' 'on-chain profit and loss status,' and 'cyclicality' — almost all indicators have or will soon confirm a 'deep bear market.' Therefore, we believe we are likely in the early stages of a deep bear market. The market will likely experience painful declines, liquidations, and even institutional bankruptcies over the next six months before reaching the bottom and restarting a new cycle.
Conclusion
Based on our analytical framework and statistical data, we consider a 'deep bear market' as highly probable. However, the market might still alter this conclusion through shifts such as changes in Federal Reserve policy, risk appetite adjustments, abrupt industrial policy shifts, or large-scale capital inflows.
Going forward, we will closely track changes in macro-financial conditions, market structure, and market dynamics, sharing updates via reports.
In its 17 years since inception, Bitcoin has faced countless crises and suffered multiple downturns exceeding 70%, eventually becoming a widely accepted new mainstream asset within this cycle.
The cycles repeat themselves, always similar. After enduring these trials, Bitcoin and crypto-assets will enter a larger growth phase.
The above analysis is provided by EMC Labs.
———————————————————————
About EMC Labs
EMC Labs is a partner of Victory Securities, and together they launched the only virtual asset fund approved by the SEC that accepts stablecoin subscriptions — the Victory EMC BTC Cycle Fund. EMC Labs was co-founded by experienced virtual asset investors and data scientists, with a core team from JD.com Finance, Bell Labs, Marsbit, and other companies. EMC Labs has invested substantial resources into building professional engines to analyze BTC on-chain data and technical indicators.
Disclaimer
Investing involves risks, and investors should be aware. The value of securities and investments can rise or fall, and there is no guarantee. Investors may not recover their initial investment amount; past performance does not necessarily predict future results. The securities trading services of Victory Securities are provided by Victory Securities Limited (hereinafter referred to as 'Victory Securities'). This document was prepared and authorized for release on this platform by Victory Securities Limited. The information contained herein is for reference purposes only, and Victory Securities reserves the right to change or terminate without prior notice. All information provided on this platform cannot be reproduced, linked, reposted, or otherwise used by any media, website, or individual without prior written authorization from Victory Securities. Authorized users must attribute the source of this document to Victory Securities and commit to complying with relevant laws and internet usage practices worldwide, refraining from illegal purposes or methods. Violators will bear all related legal and financial responsibilities. Data cited in this document may be sourced from third parties; Victory Securities does not guarantee the accuracy, fairness, timeliness, completeness, or correctness of any data, forecasts, and/or opinions contained herein, nor does it assume legal responsibility for any benchmarks upon which such forecasts and/or opinions are based. Any forward-looking statements in this document should not be considered guarantees of future performance, and actual developments may differ significantly. This document is neither an offer nor a solicitation for the purchase or sale of any securities or investment decision-making basis, nor should it be interpreted as professional advice. Readers or those making investment decisions should fully understand the risks and the associated legal, tax, and accounting implications, and decide whether investing aligns with their personal objectives and risk tolerance, seeking appropriate professional advice if necessary. In certain countries, dissemination and distribution of this document may be restricted by law, and recipients are responsible for compliance with such restrictions.
Risk Disclaimer: The above content only represents the author's view. It does not represent any position or investment advice of Futu. Futu makes no representation or warranty.Read more

Comments
to post a comment
1
2