
Hong Kong-listed AI 'twin leaders' see active trading! How to position in the AI sector for the Year
Technical Analysis of Chinese Stocks (January 30): Alibaba/Baidu/Bilibili/Futu/PDD Holdings/Tencent Music/NetEase/JD.com/Tencent/Meituan/Kuaishou/Xiaomi
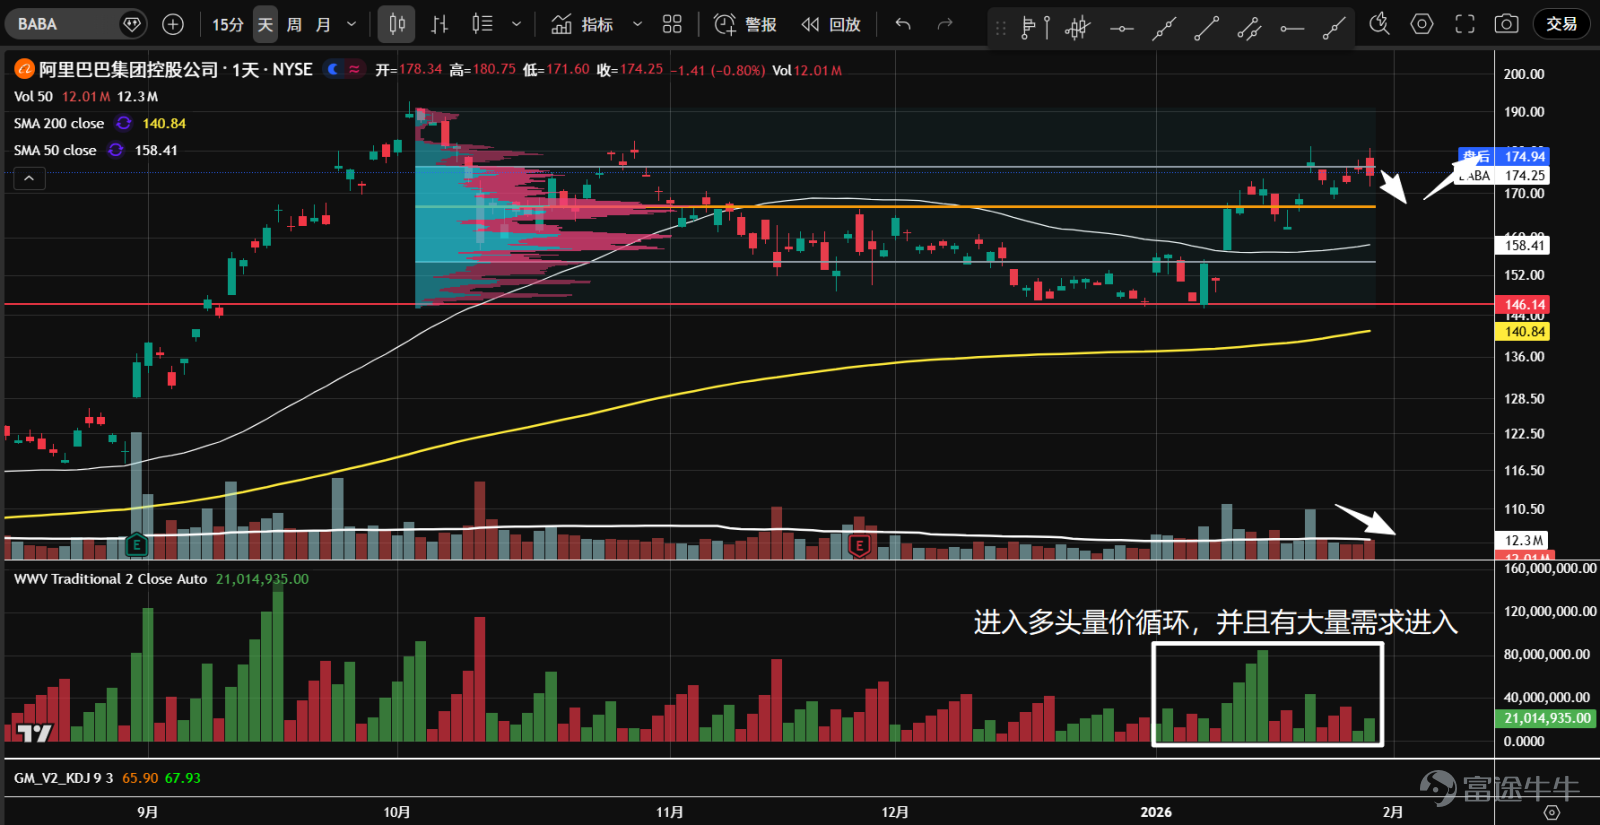
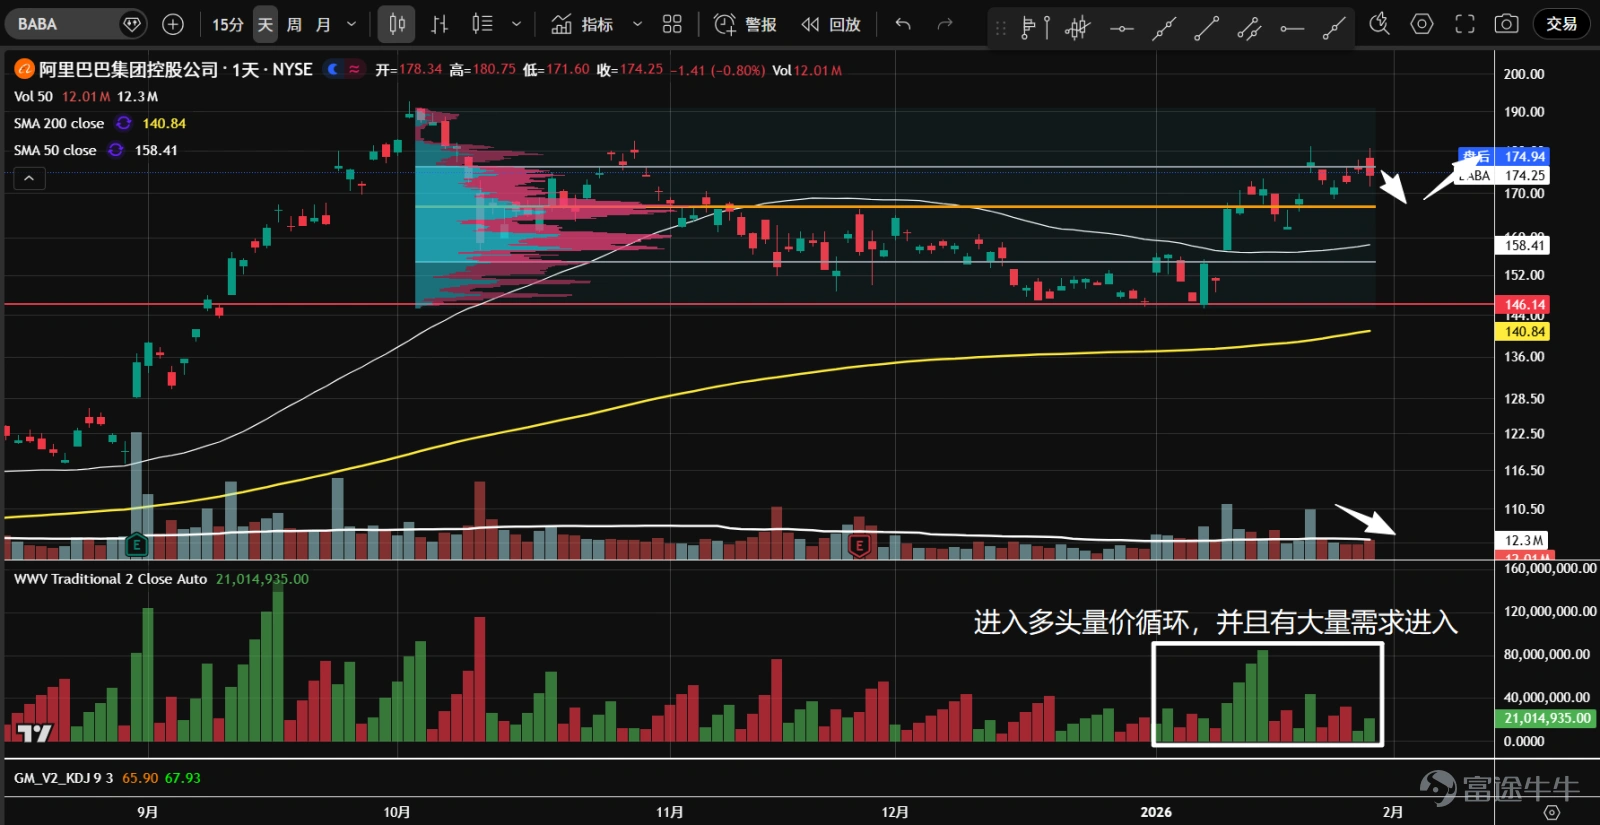
1、 $Alibaba (BABA.US)$ A large-volume rebound occurred at the start of the new year, but it is currently facing resistance at the upper boundary of the value range and has started to see reduced volume. The bulls have a strong price-volume cycle with significant demand entering, indicating a high probability of accumulation in this range. There is short-term pullback pressure, but an upward breakout may be brewing for the future.
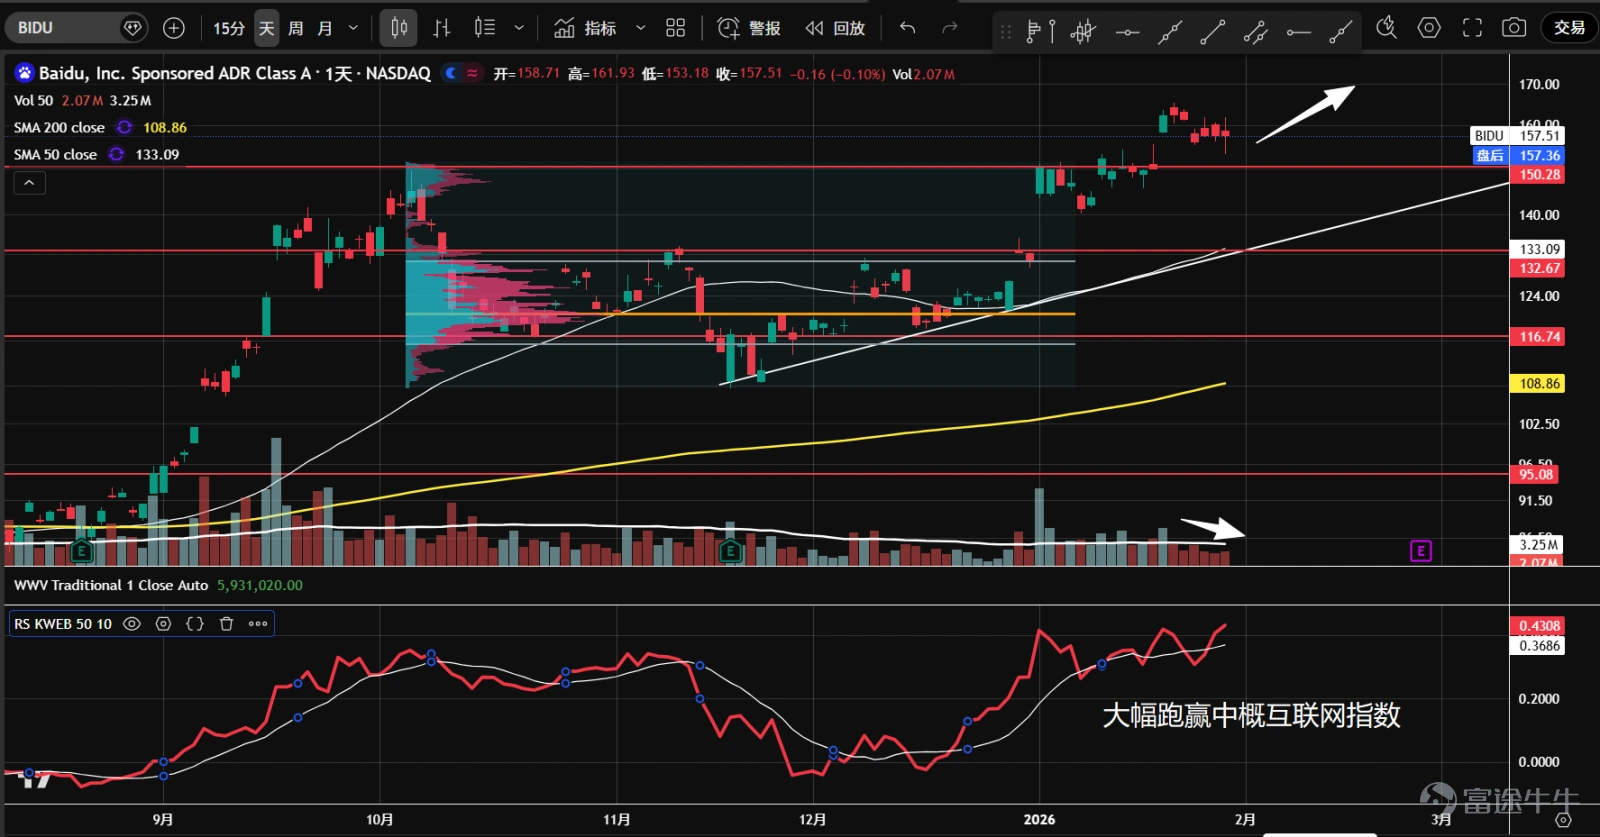
2、 $Baidu (BIDU.US)$ Since October last year, the stock has been trapped in range-bound trading. After a large-volume breakout above the previous resistance level of 150 at the beginning of the month, it quickly saw reduced volume and a minor pullback. It has significantly outperformed the Chinese Internet Index, making a valid breakout highly probable. The daily chart shows a doji with a lower shadow, presenting a bullish opportunity.
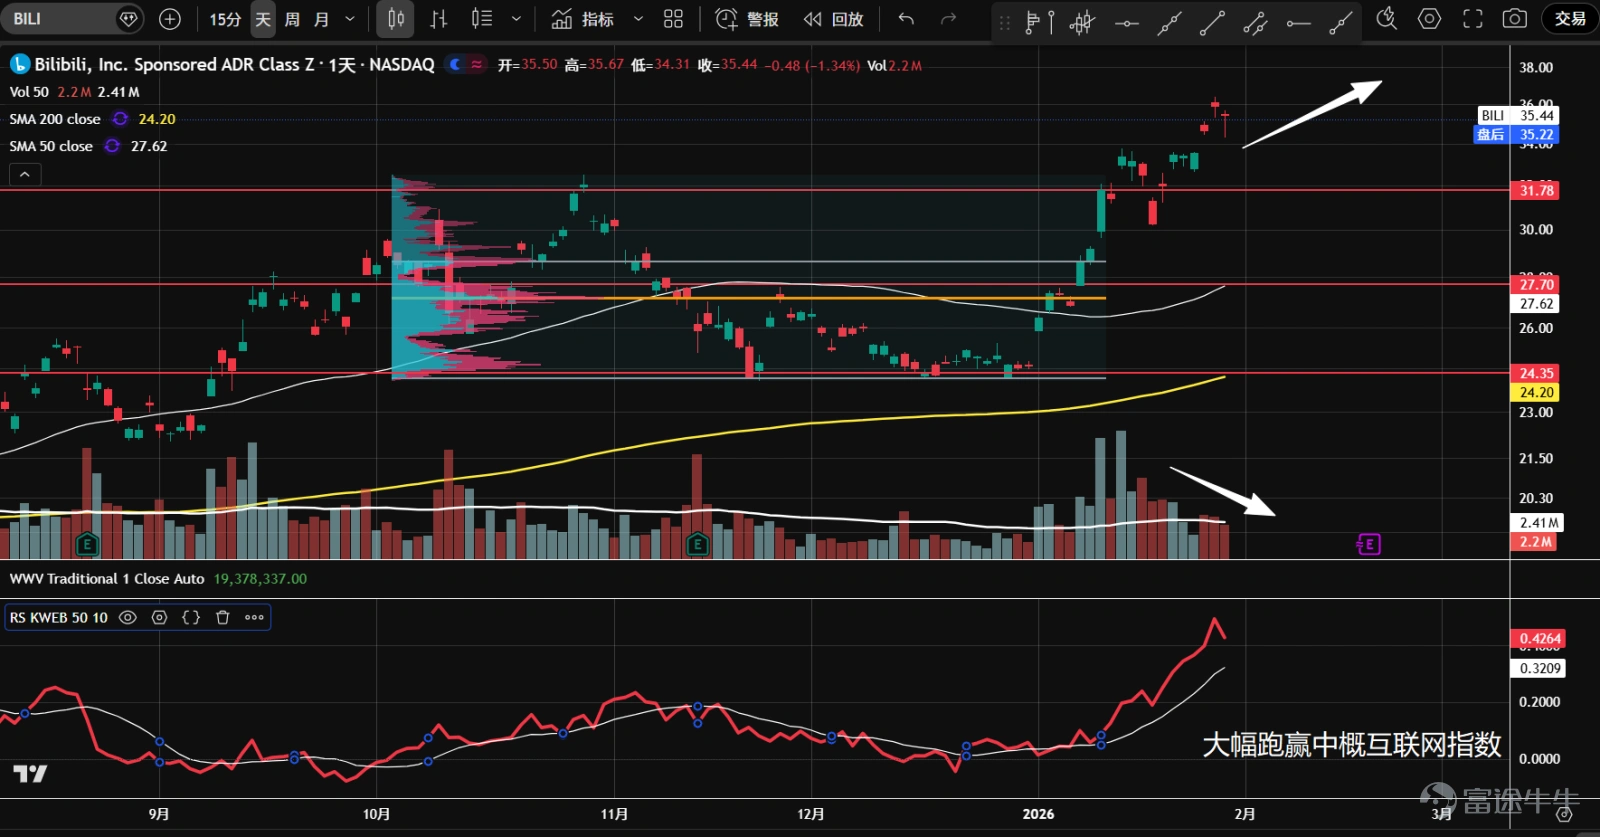
3、 $Bilibili (BILI.US)$ Since October last year, the stock has been moving sideways. This month, it surged with heavy volume from the bottom, breaking through the previous resistance level of 31, then slightly pulled back with reduced volume before setting a new high. It has significantly outperformed the index, showing a strong bullish price-volume cycle, possibly opening up room for further upside.
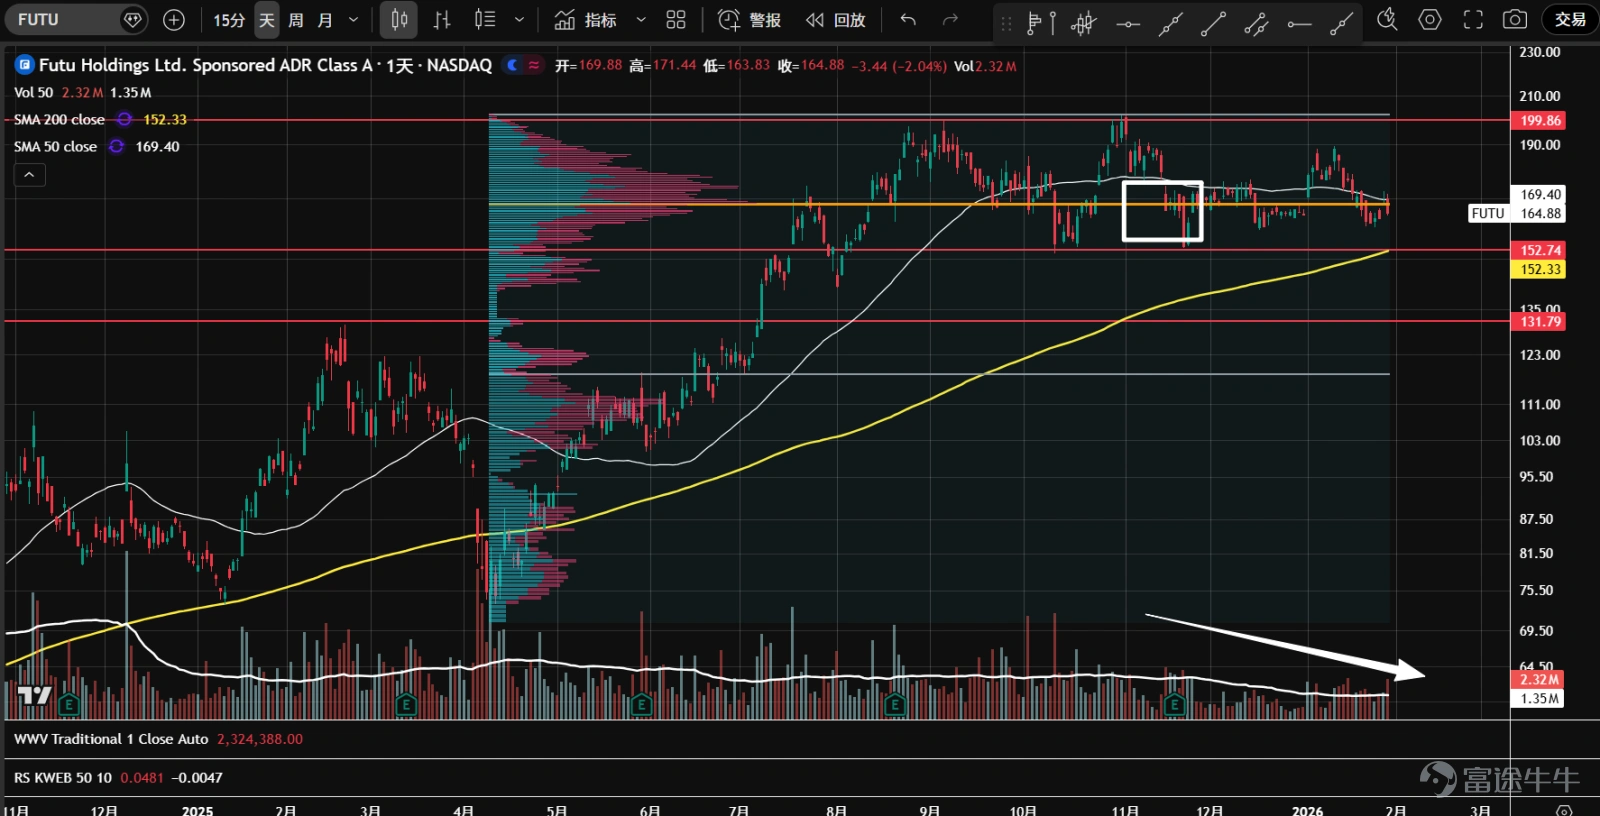
4、 $Futu Holdings Ltd (FUTU.US)$ The stock continues to move sideways with volatility, forming a P-shaped volume distribution, with heightened divergence between bulls and bears at higher levels. Currently, the stock price is near the volume control point (orange line), showing no clear direction. Overall trading volume is gradually declining, suggesting possible accumulation. Price movements are becoming more convergent, with moderate expansion in trading volume, potentially signaling an upcoming breakout.
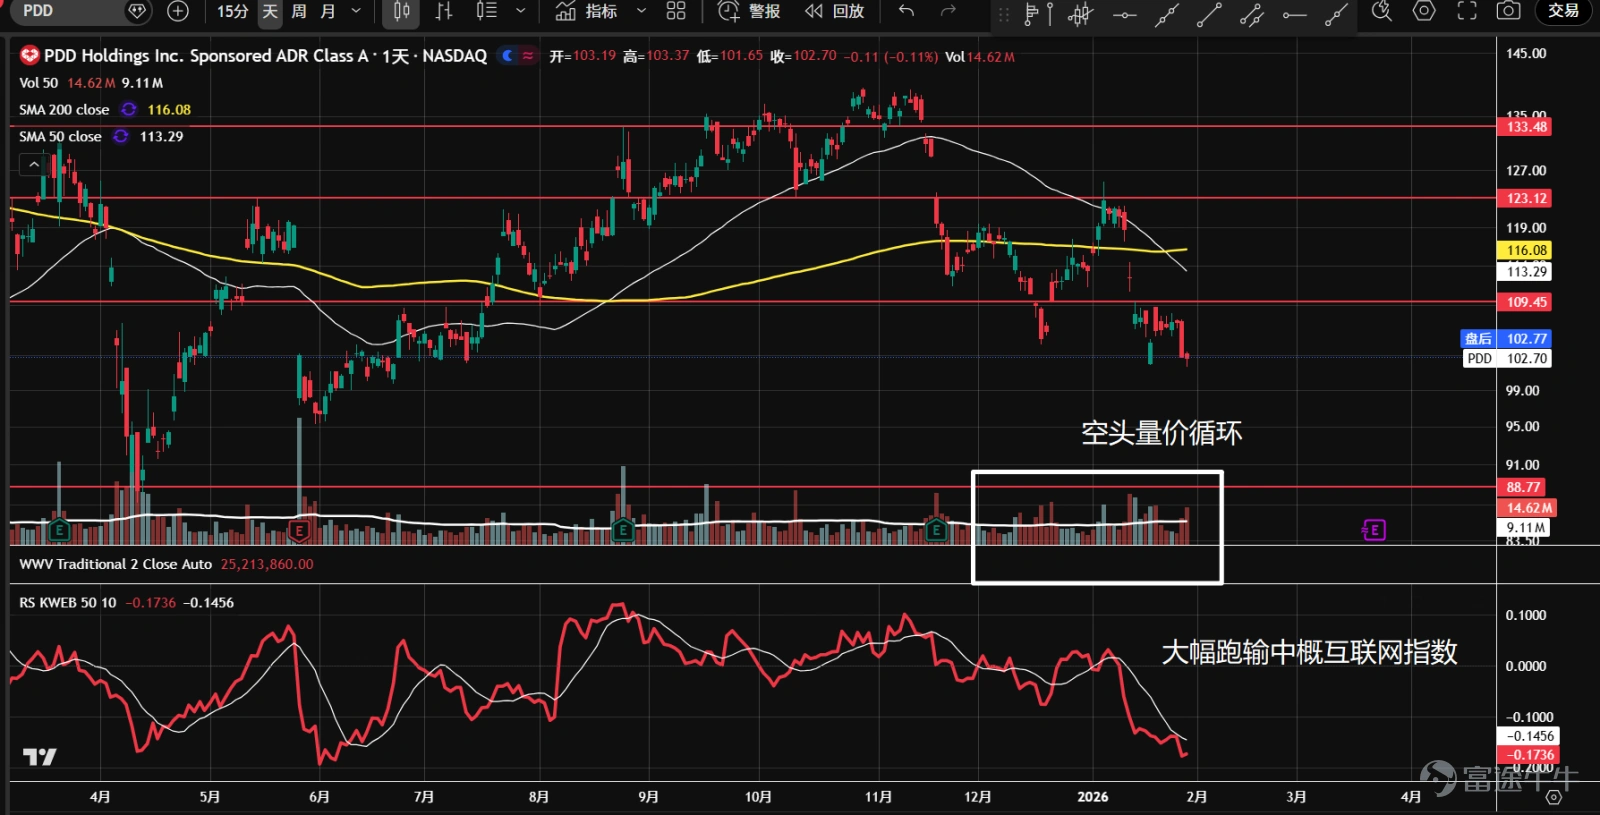
5、 $PDD Holdings (PDD.US)$ Since entering a large consolidation range in 2024, the stock rebounded this month to the internal axis at 123 but faced resistance, leading to a significant volume-driven decline and breaking below the 109.5 support level. Supply has expanded, underperforming the China Internet Index. The bearish price-volume cycle indicates extremely weak technical performance; it is recommended to stay on the sidelines for now.
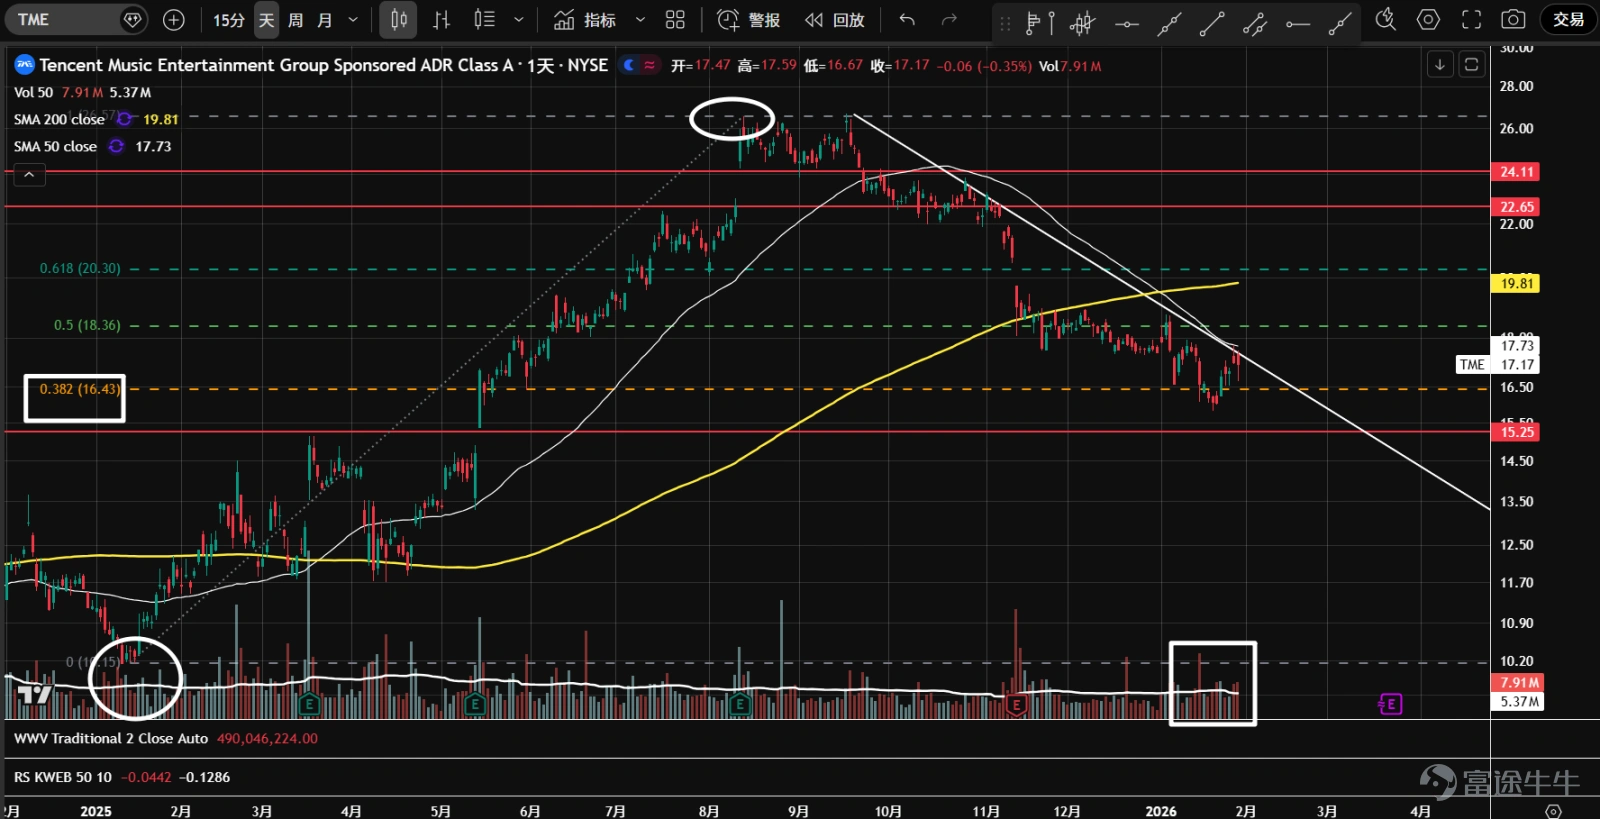
6、 $Tencent Music (TME.US)$ The stock’s performance remains sluggish, briefly stabilizing at the 38.2% retracement level of the previous rally, with trading volume starting to increase. It is not advisable to bottom-fish until the downtrend line is broken.
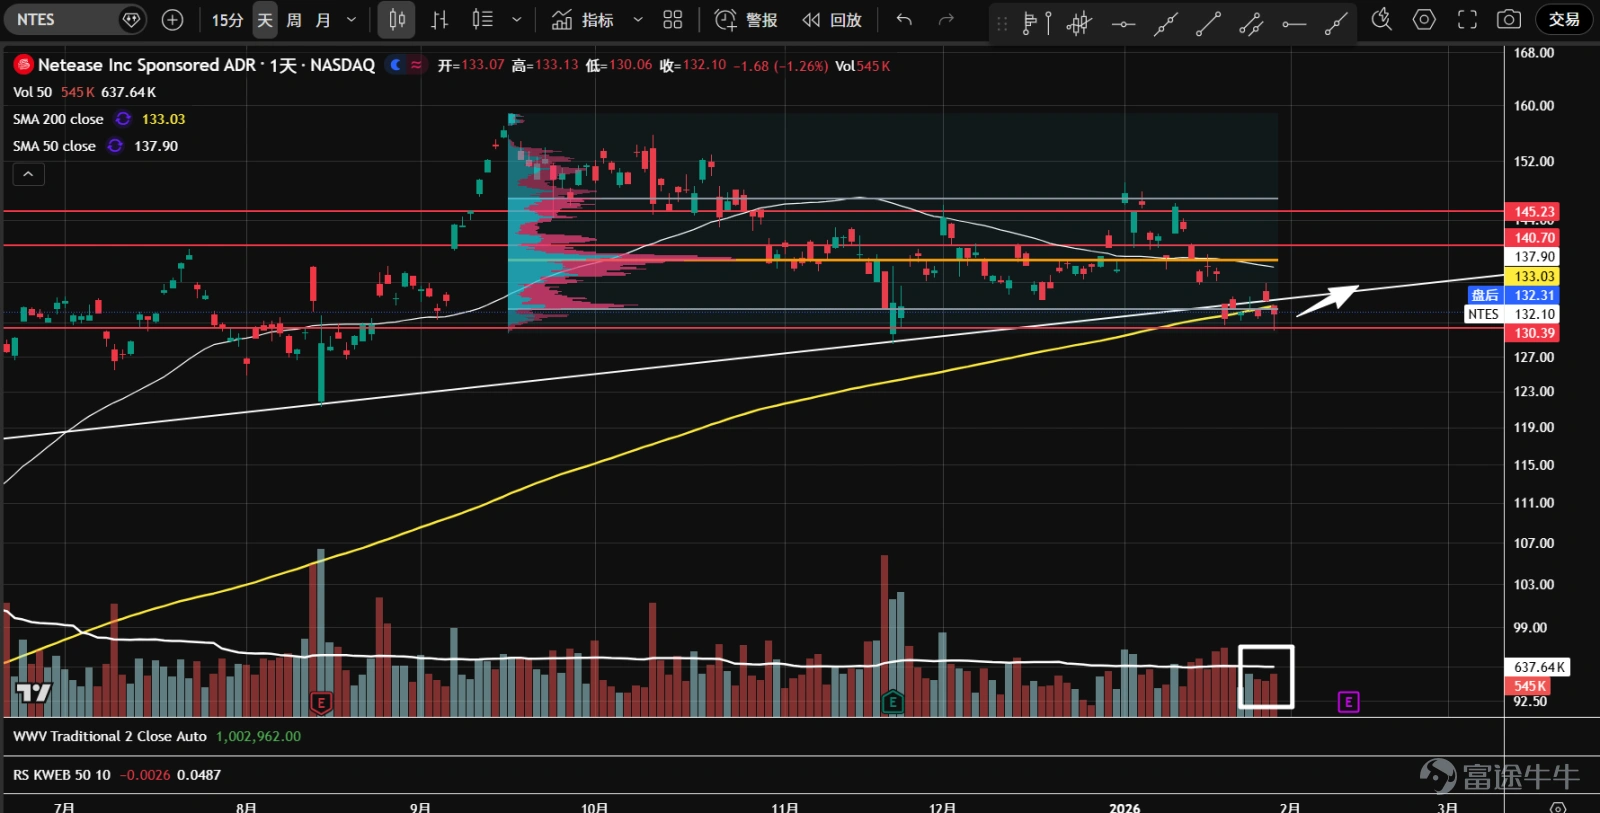
7、 $NetEase (NTES.US)$ Since September of last year, the stock has been moving sideways with overall trading volume trending lower, suggesting a possible accumulation range. Recently, there was a significant volume-driven drop to the 130-axis and annual line, but it did not break below support. Instead, it stabilized on low volume, closing with a small K-line that had a lower shadow. Selling pressure may have subsided, but a rebound needs to happen quickly, otherwise, a shakeout could occur.
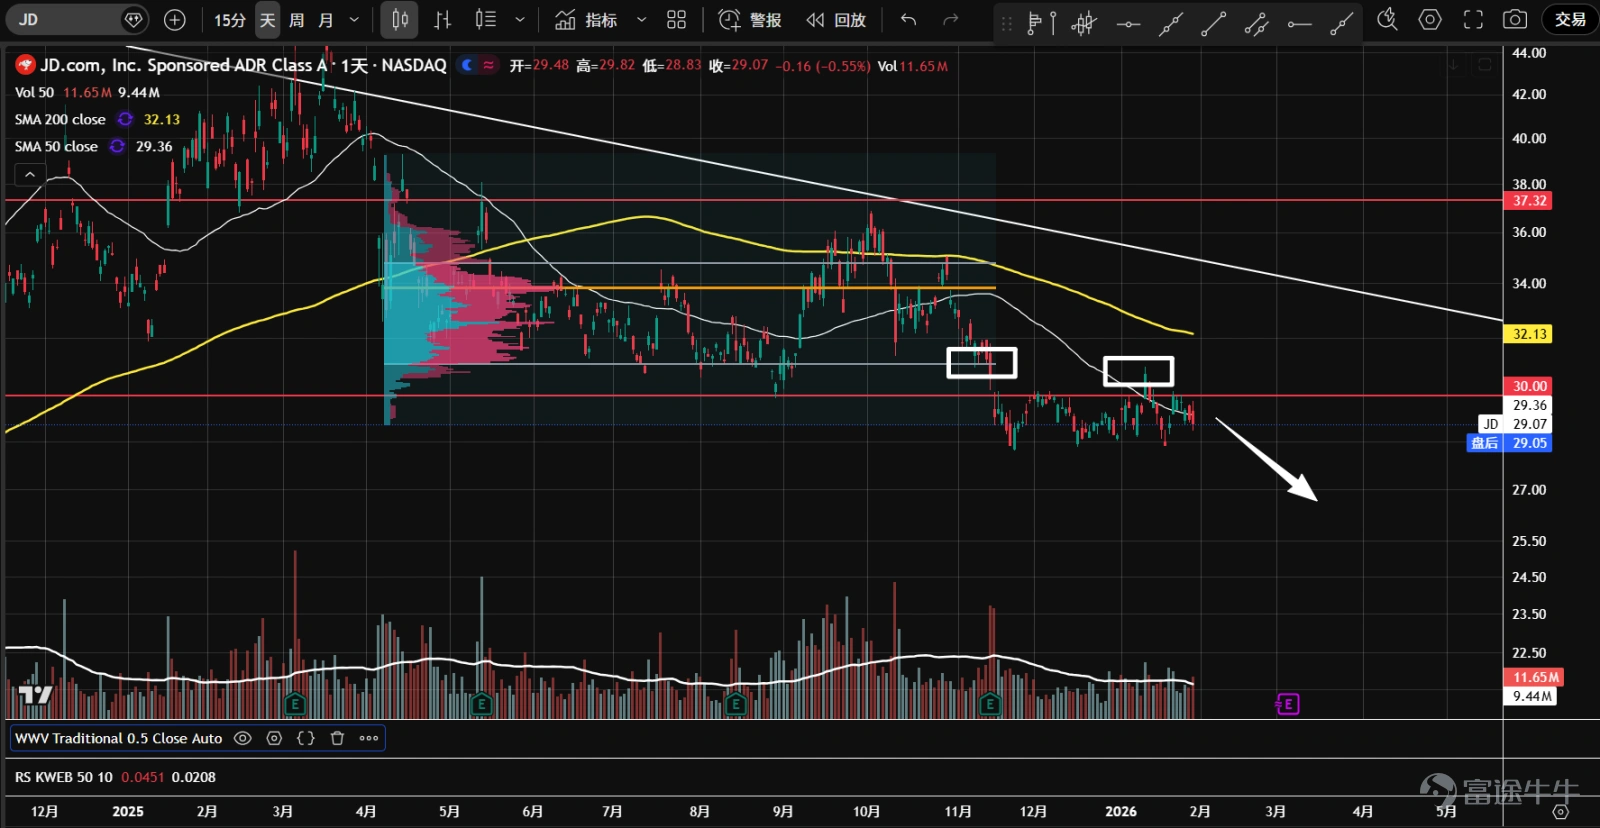
8、 $JD.com (JD.US)$ After breaking through the key support level around 30 on high volume, the stock has continued to trade in a narrow range. A minor rebound occurred recently, but it met resistance and retreated at the lower end of the previous value area. The likelihood of further declines remains high; for now, it is best to remain on the sidelines.
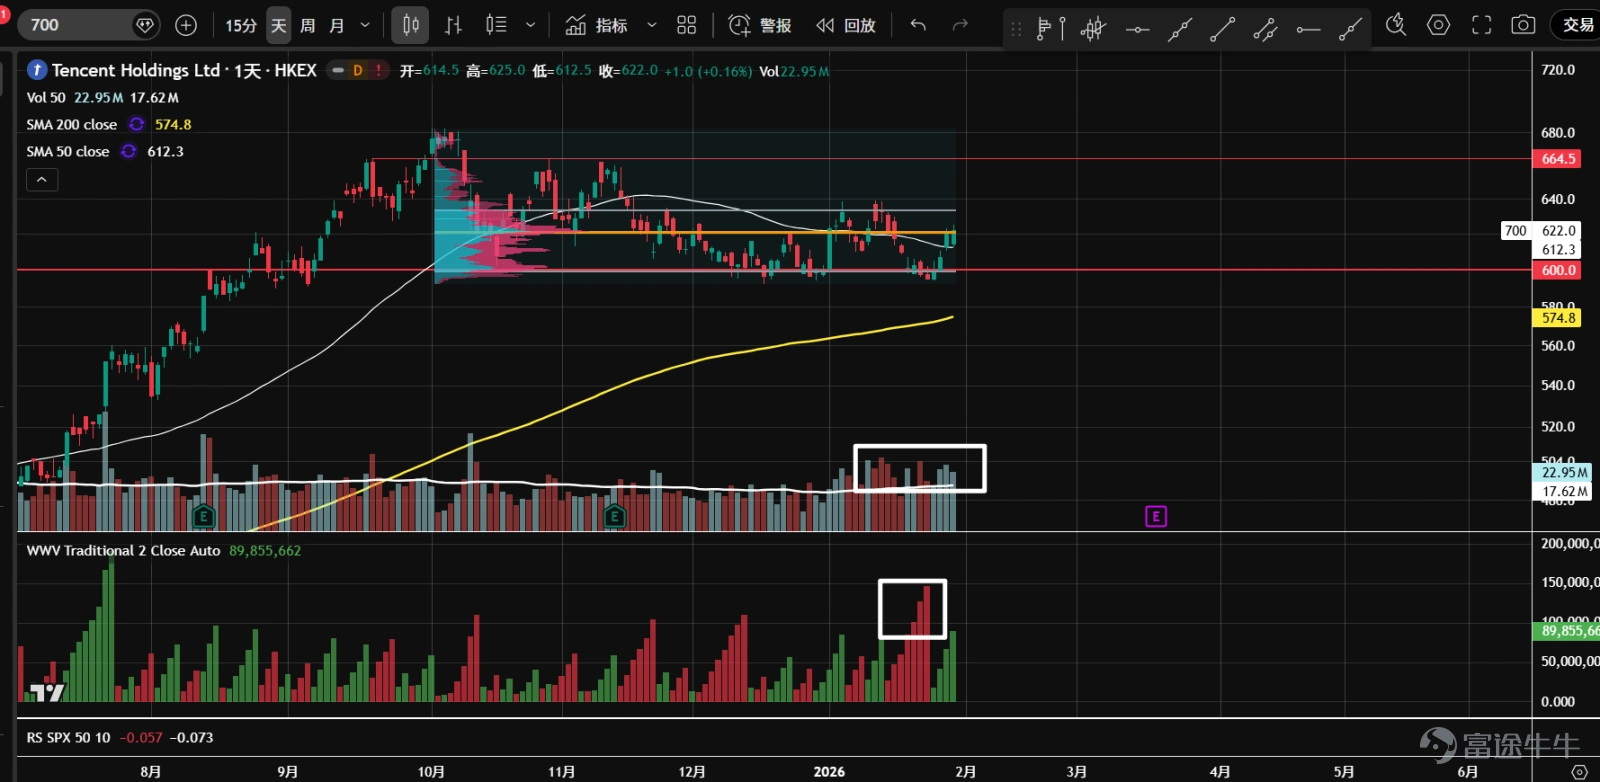
9、 $TENCENT (00700.HK)$ The stock is oscillating within a sideways range, recently rebounding from the 600-support level. Since the beginning of the new year, trading volume has continued to expand. Based on wave volume analysis, the significant selling pressure failed to break through support, indicating buying interest underneath. There is a strong possibility of an upward breakout.
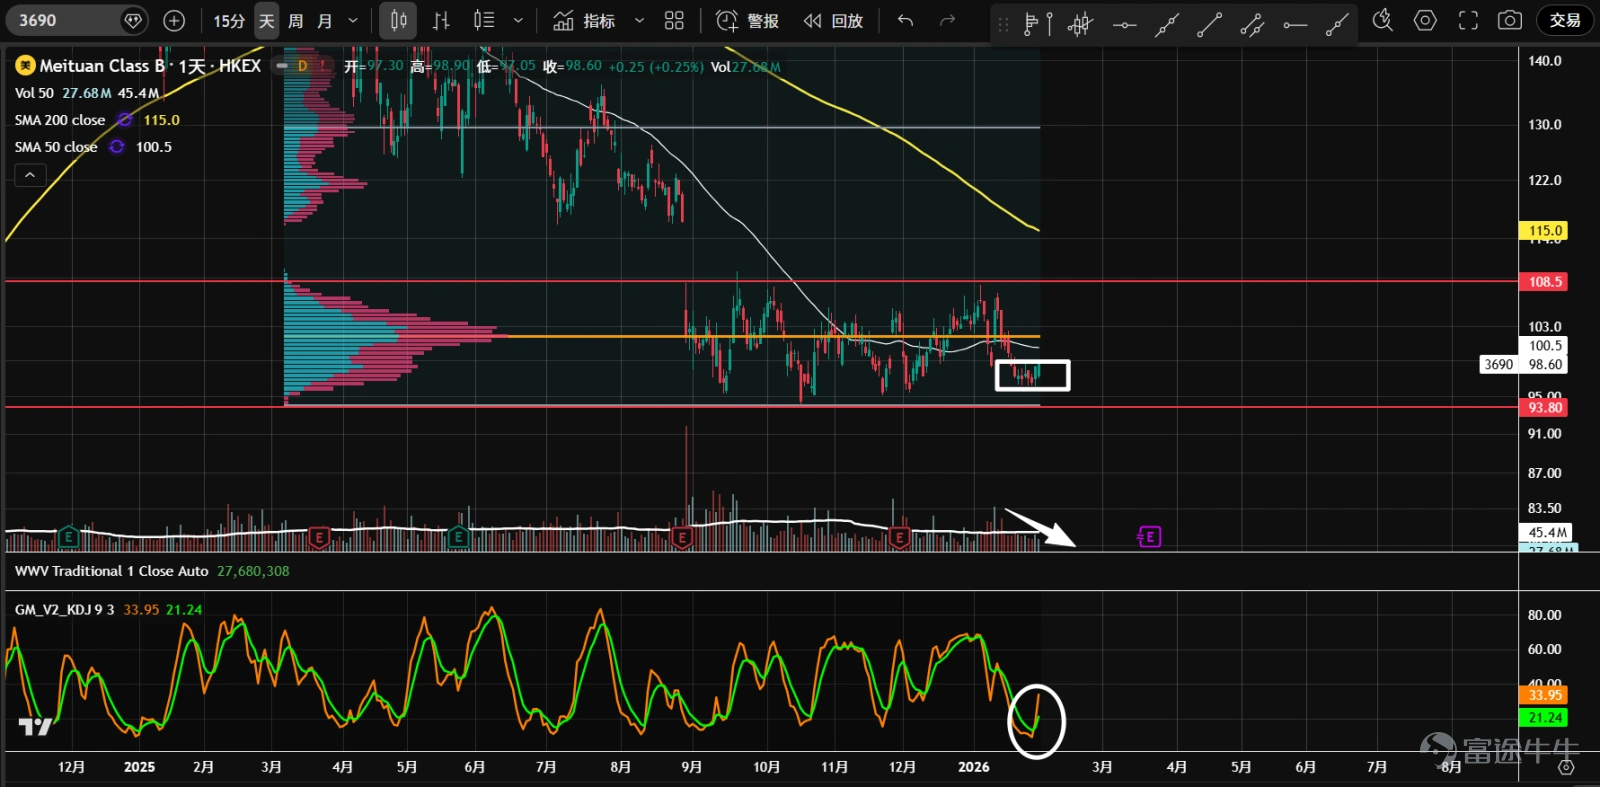
10、 $MEITUAN-W (03690.HK)$ Since September of last year, the stock has been consolidating, with overall trading volume trending lower and forming a B-shaped distribution, suggesting a probable accumulation phase. This month, there was a surge in volume during a pullback after an attempted breakout, but it quickly stabilized on reduced volume, closing with a K-line at a high position and forming a bullish crossover in the KD indicator at a low level. Selling pressure may have been absorbed, presenting a potential long opportunity.
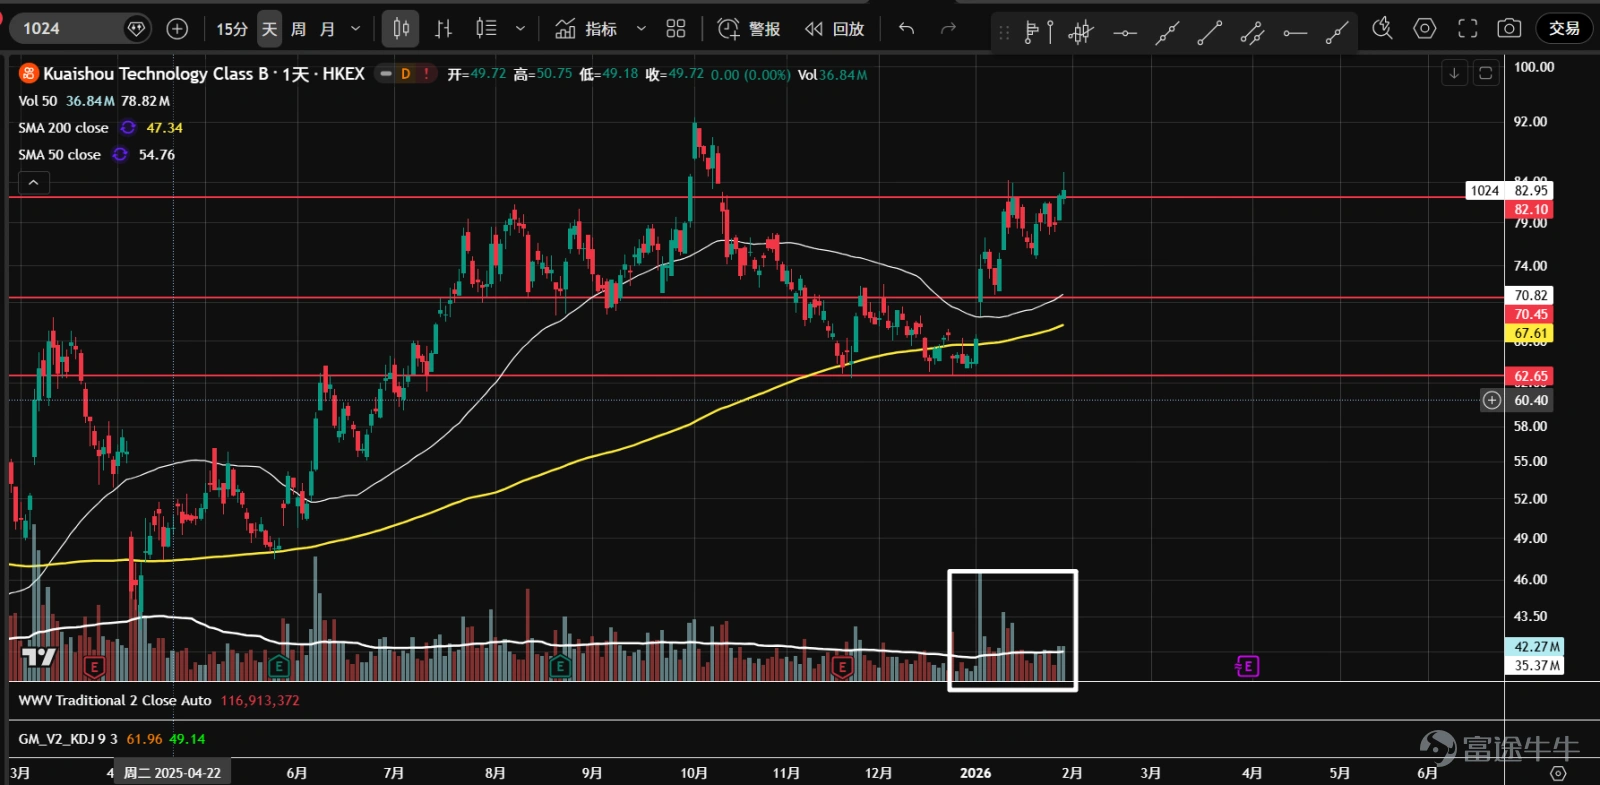
11、 $KUAISHOU-W (01024.HK)$ After testing support around 62.6 twice on low volume, the stock entered a phase of high-volume price appreciation with a bullish price-volume cycle. After encountering resistance at the 82-axis, it pulled back on reduced volume before continuing its upward push in an attempt to break through this resistance. Bulls are currently working to absorb floating supply; it is advisable to remain on the sidelines for now.
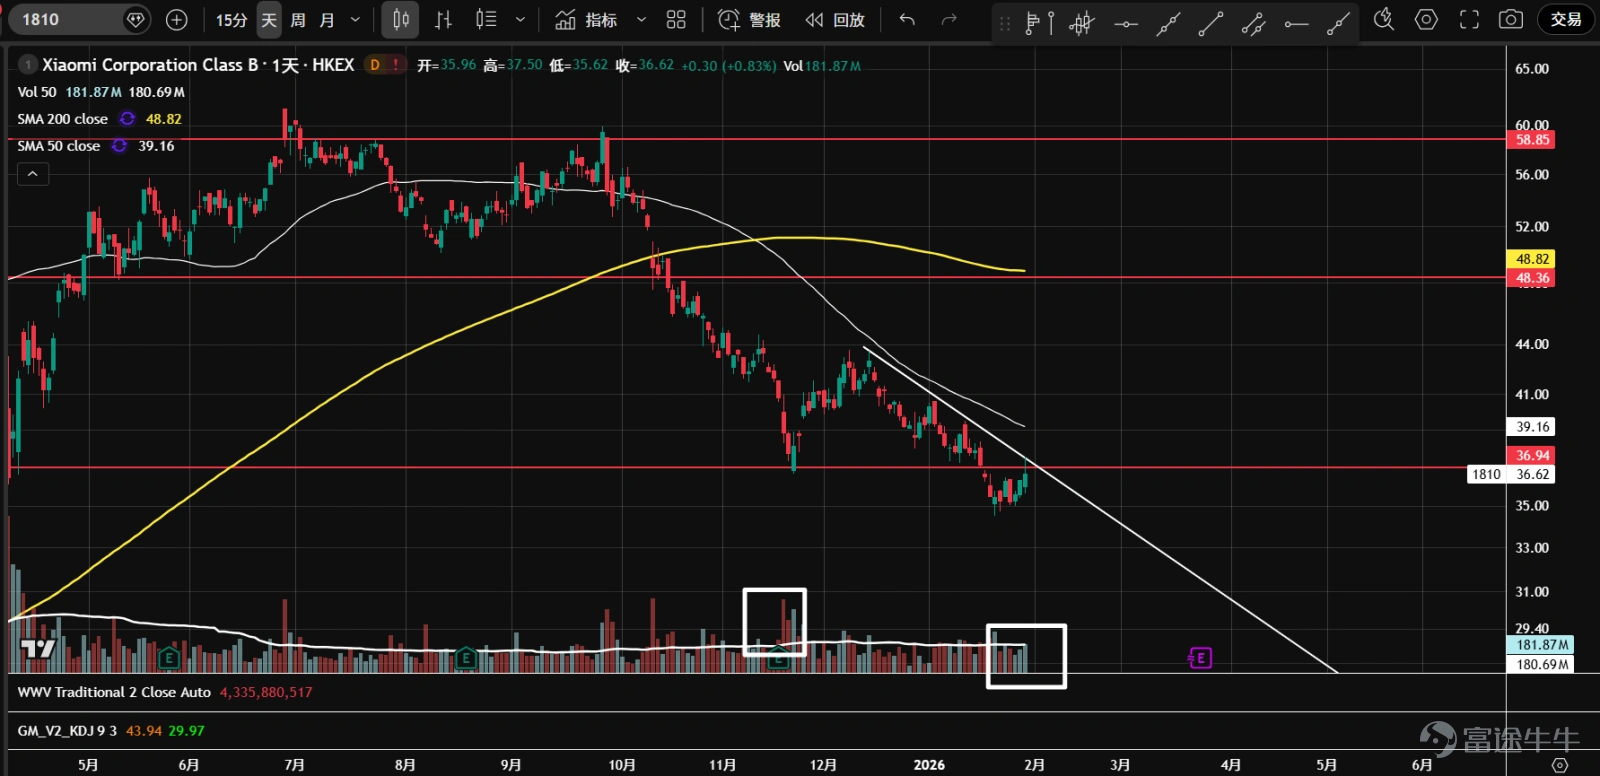
12、 $XIAOMI-W (01810.HK)$ A downtrend began in September of last year, with panic selling occurring near the 36.9-axis level, followed by a natural rebound. It is currently undergoing a second test. Although it hit a new low, trading volume was significantly lower compared to the sharp decline in November, possibly setting up a false downside breakout.
$S&P 500 Index (.SPX.US)$ $SPDR S&P 500 ETF (SPY.US)$ $NASDAQ 100 Index (.NDX.US)$ $Invesco QQQ Trust (QQQ.US)$ $Dow Jones Industrial Average (.DJI.US)$ $State Street® SPDR® Dow Jones Industrial Average® ETF Trust (DIA.US)$ $Russell 2000 Index (.RUT.US)$ $iShares Russell 2000 ETF (IWM.US)$ $Hang Seng Index (800000.HK)$ $Hang Seng TECH Index (800700.HK)$ $Hang Seng TECH Index ETF (03032.HK)$ $KraneShares CSI China Internet ETF (KWEB.US)$ $Direxion Daily FTSE China Bull 3X Shares ETF (YINN.US)$ $Direxion Daily FTSE China Bear 3X Shares ETF (YANG.US)$ $Invesco China Technology ETF (CQQQ.US)$
Risk Disclaimer: The above content only represents the author's view. It does not represent any position or investment advice of Futu. Futu makes no representation or warranty.Read more


Comments
to post a comment
10