Baidu: After hitting a new high, technical indicators diverge. How to use derivatives to capitalize on the trend?
Baidu (09888) Short-term Analysis: After hitting a new high, technical indicators diverge. How to use derivatives to capitalize on the trend?
Baidu's share price showed strong momentum at the start of 2026, breaking through 155.5 yuan on January 21, reaching a new high since August 2023. Behind this rally were positive news about the international expansion of its autonomous driving business and endorsements from major banks regarding the growth prospects of its AI cloud business. However, the rapid rise to key technical resistance levels has exacerbated market divergence, with technical indicators showing conflicting signals.
Technical Perspective: Key Resistance and Overbought Signals Behind New Highs
Based on data as of January 21, after Baidu's stock price hit a new high, the key technical levels have become very clear. Above, the first resistance level is at 159.2 yuan, with the second resistance level at 168.2 yuan. Below, the first support level is at 143.1 yuan, while the stronger second support level lies at 130.1 yuan. This technical range largely aligns with the short-term resistance (approximately 151.9 yuan) and the further upside target (164.9 yuan) analyzed in the January 19 episode of the [HK Stocks Podcast], indicating that this area has become a consensus battleground for market bulls and bears.
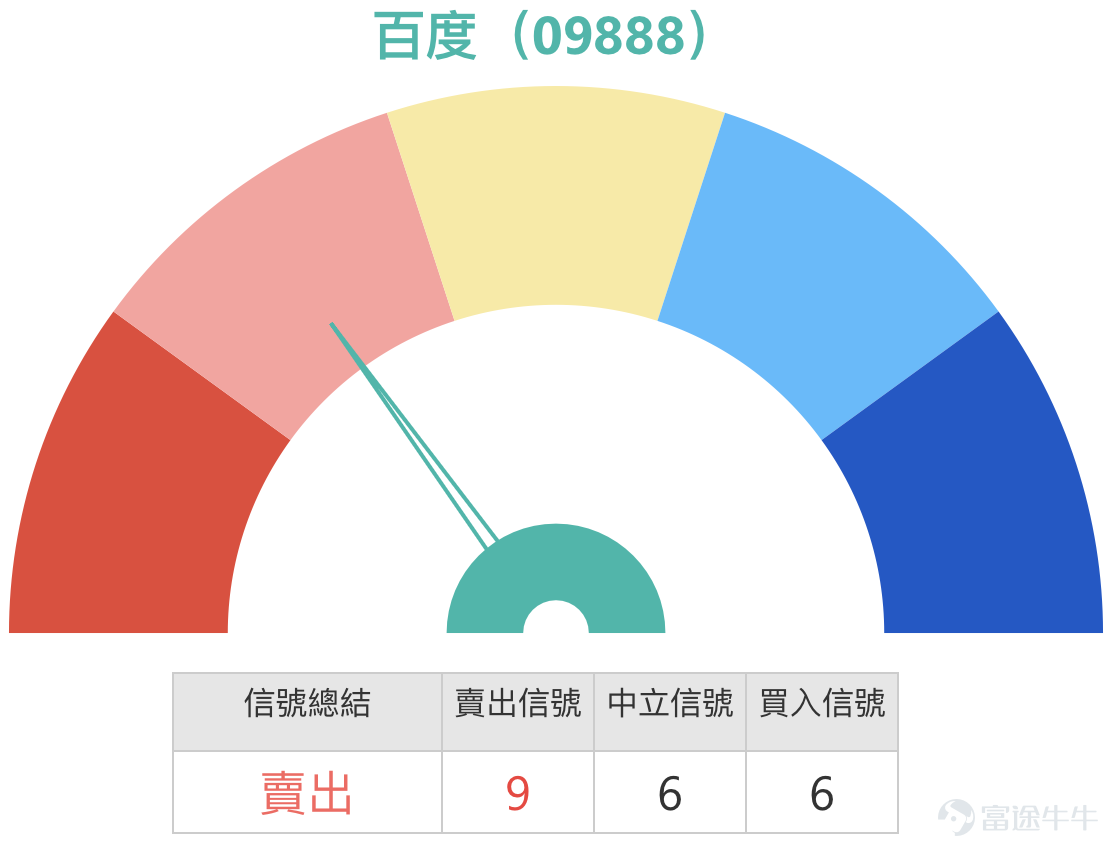
Investors should pay close attention: While several technical indicators have issued 'buy' signals due to the rise in stock price (such as MACD, Ichimoku Cloud, and Bollinger Bands), some short-term volatility indicators have turned 'yellow.' Data shows that the 14-day RSI has reached 70, entering the 'overbought' zone; Stochastic Oscillator and Williams %R also signal 'overbought' or 'sell' conditions. This divergence between a positive medium-term trend and short-term overbought conditions typically foreshadows potentially higher volatility or technical corrections when the stock challenges key resistance levels. This corroborates the observation in the [HK Stocks Podcast] about 'technical signals mainly pointing to sell.' Additionally, Astmax Financial Network’s technical analysis noted that Baidu’s recent stock performance exhibited a bullish 'Head and Shoulders Bottom' breakout, providing technical support for its mid-term trend.
Market Dynamics & Insights: Fundamental Support vs. Caution in Derivatives Markets
Baidu's recent strong stock performance has been driven by solid fundamental catalysts. Leading investment banks hold positive views on the transformation of its core business. UBS Group expects Baidu's AI cloud infrastructure to remain the primary growth driver; Bank of America Securities notes that although AI cloud revenue growth may slow due to a high base, full-year growth is still expected to remain robust, maintaining a 'Buy' rating. These viewpoints collectively build long-term market confidence in Baidu’s AI strategic value.
However, in the derivatives market, capital deployment reflects more tactical caution. The [HK Stocks Podcast] pointed out that despite overall investor optimism about the outlook and inquiries into upward resistance, some funds have started shifting towards put warrant products to hedge against risks of short-term technical pullbacks. This 'long-term optimism but short-term caution' sentiment requires investors to manage short-term volatility risks carefully while chasing trends.
![$BIDU-SW (09888.HK)$ Baidu (09888) Short-term Analysis: After hitting a new high, technical indicators diverge. How to use derivatives to capitalize on the trend? Baidu's share price showed strong momentum at the start of 2026, breaking through 155.5 yuan on January 21, reaching a new high since August 2023. Behind this rally were positive news about the international expansion of its autonomous driving business and endorsements from major banks regarding the growth prospects of its AI cloud business. However, the rapid rise to key technical resistance levels has exacerbated market divergence, with technical indicators showing conflicting signals. Technical Perspective: Key Resistance and Overbought Signals Behind New Highs [Share Link: January 19 [Hong Kong Stock Podcast] Hang Seng Index, Zijin Mining, BYD, Baidu Group, HSBC] According to data as of January 21, after Baidu's stock price hit a new high, the key technical positions it faces have become very clear. Above, the first resistance level is at 159.2 yuan, while the second resistance level is at 168.2 yuan. Below, the first support level is at 143.1 yuan, with a stronger second support level at 130.1 yuan. This technical range aligns roughly with the short-term resistance level (around 151.9 yuan) and further upside target (164.9 yuan) analyzed in the January 19 [Hong Kong Stock Podcast] segment, indicating that this area has become a consensus battleground for bulls and bears. Investors should pay close attention as multiple technical indi...](https://nnqimage.futunn.com/sns_client_feed/1162342/20260121/web-1768978613988-6nspTTXhMW.png/big?area=1&is_public=true&imageMogr2/ignore-error/1/format/webp)
Warrant Product Review: Leverage Effects in Volatile Markets
Reviewing the Baidu-related bullish products mentioned on January 16, their performance in the following two trading sessions vividly demonstrated the potential efficiency of derivatives in following trends. During that period, the underlying stock rose cumulatively by 2.20%, while related bullish products recorded even more significant gains: J.P. Morgan Bull Certificate (53225) $JP#BAIDURC2702E.C (53225.HK)$ rose 17%, UBS Bull Certificate (66510) $UB#BAIDURC2612I.C (66510.HK)$ rose 13%, UBS Call Warrant (21259) $UBBAIDU@EC2603B.C (21259.HK)$ rose 15%, and Bank of China Call Warrant (21276) rose 13%.
![$BIDU-SW (09888.HK)$ Baidu (09888) Short-term Analysis: After hitting a new high, technical indicators diverge. How to use derivatives to capitalize on the trend? Baidu's share price showed strong momentum at the start of 2026, breaking through 155.5 yuan on January 21, reaching a new high since August 2023. Behind this rally were positive news about the international expansion of its autonomous driving business and endorsements from major banks regarding the growth prospects of its AI cloud business. However, the rapid rise to key technical resistance levels has exacerbated market divergence, with technical indicators showing conflicting signals. Technical Perspective: Key Resistance and Overbought Signals Behind New Highs [Share Link: January 19 [Hong Kong Stock Podcast] Hang Seng Index, Zijin Mining, BYD, Baidu Group, HSBC] According to data as of January 21, after Baidu's stock price hit a new high, the key technical positions it faces have become very clear. Above, the first resistance level is at 159.2 yuan, while the second resistance level is at 168.2 yuan. Below, the first support level is at 143.1 yuan, with a stronger second support level at 130.1 yuan. This technical range aligns roughly with the short-term resistance level (around 151.9 yuan) and further upside target (164.9 yuan) analyzed in the January 19 [Hong Kong Stock Podcast] segment, indicating that this area has become a consensus battleground for bulls and bears. Investors should pay close attention as multiple technical indi...](https://nnqimage.futunn.com/sns_client_feed/1162342/20260121/web-1768978622133-XX2CB2rzfi.png/big?area=1&is_public=true&imageMogr2/ignore-error/1/format/webp)
By integrating key technical levels, market sentiment, and the characteristics of derivatives, we can align recommended products with specific strategic scenarios:
For investors who remain bullish on the market outlook and believe that the stock price will consolidate before breaking through resistance levels at 159.2 or even 168.2, call warrants or bull contracts can be considered. For instance, HSBC Call Warrant (21022) $HSBAIDU@EC2603C.C (21022.HK)$ with a strike price of 138.1, offers leverage of 5.8 times. Its features of 'lowest premium and implied volatility' make it a cost-efficient choice for tracking upside movements in the underlying stock. The Morley Bull Contract (53764) has a recovery price of 135, actual leverage of 6.6 times, which is the highest among similar products. Its recovery price is significantly below the current market price and the first support level of 143.1, providing a wider safety buffer, making it suitable for investors who are optimistic but wish to control downside risks.
![$BIDU-SW (09888.HK)$ Baidu (09888) Short-term Analysis: After hitting a new high, technical indicators diverge. How to use derivatives to capitalize on the trend? Baidu's share price showed strong momentum at the start of 2026, breaking through 155.5 yuan on January 21, reaching a new high since August 2023. Behind this rally were positive news about the international expansion of its autonomous driving business and endorsements from major banks regarding the growth prospects of its AI cloud business. However, the rapid rise to key technical resistance levels has exacerbated market divergence, with technical indicators showing conflicting signals. Technical Perspective: Key Resistance and Overbought Signals Behind New Highs [Share Link: January 19 [Hong Kong Stock Podcast] Hang Seng Index, Zijin Mining, BYD, Baidu Group, HSBC] According to data as of January 21, after Baidu's stock price hit a new high, the key technical positions it faces have become very clear. Above, the first resistance level is at 159.2 yuan, while the second resistance level is at 168.2 yuan. Below, the first support level is at 143.1 yuan, with a stronger second support level at 130.1 yuan. This technical range aligns roughly with the short-term resistance level (around 151.9 yuan) and further upside target (164.9 yuan) analyzed in the January 19 [Hong Kong Stock Podcast] segment, indicating that this area has become a consensus battleground for bulls and bears. Investors should pay close attention as multiple technical indi...](https://nnqimage.futunn.com/sns_client_feed/1162342/20260121/web-1768978665198-NIZwCCgBmr.jpeg/big?area=1&is_public=true&imageMogr2/ignore-error/1/format/webp)
For investors concerned about short-term overbought conditions and expecting a potential pullback to test the first support level at 143.1, put warrants or bear contracts may be worth considering. UBS Put Warrant (24276) $UBBAIDU@EP2607B.P (24276.HK)$ with a strike price of 131.7 and leverage of 3.6 times, has relatively ideal implied volatility. Its strike price is close to the second support level at 130.1. If there is a deep correction in the stock price, this product could offer strong downside capture capability. The HSBC Bear Contract (65572), with a recovery price of 160 and actual leverage of 17.1 times, has its recovery price just above the first resistance level at 159.2, making it a powerful tool for betting on a reversal when the stock price meets resistance. However, high leverage also comes with higher volatility risk. $BIBAIDU@EP2607B.P (24326.HK)$$JP#BAIDURP2710B.P (66662.HK)$
![$BIDU-SW (09888.HK)$ Baidu (09888) Short-term Analysis: After hitting a new high, technical indicators diverge. How to use derivatives to capitalize on the trend? Baidu's share price showed strong momentum at the start of 2026, breaking through 155.5 yuan on January 21, reaching a new high since August 2023. Behind this rally were positive news about the international expansion of its autonomous driving business and endorsements from major banks regarding the growth prospects of its AI cloud business. However, the rapid rise to key technical resistance levels has exacerbated market divergence, with technical indicators showing conflicting signals. Technical Perspective: Key Resistance and Overbought Signals Behind New Highs [Share Link: January 19 [Hong Kong Stock Podcast] Hang Seng Index, Zijin Mining, BYD, Baidu Group, HSBC] According to data as of January 21, after Baidu's stock price hit a new high, the key technical positions it faces have become very clear. Above, the first resistance level is at 159.2 yuan, while the second resistance level is at 168.2 yuan. Below, the first support level is at 143.1 yuan, with a stronger second support level at 130.1 yuan. This technical range aligns roughly with the short-term resistance level (around 151.9 yuan) and further upside target (164.9 yuan) analyzed in the January 19 [Hong Kong Stock Podcast] segment, indicating that this area has become a consensus battleground for bulls and bears. Investors should pay close attention as multiple technical indi...](https://nnqimage.futunn.com/sns_client_feed/1162342/20260121/web-1768978672777-RlSL6vZnQo.jpeg/big?area=1&is_public=true&imageMogr2/ignore-error/1/format/webp)
#Learn Warrants & Bull/Bear Contracts with Jenny#: A detailed analysis of the core differences between 'R-type' and 'N-type' bull/bear contracts
When selecting bull/bear contracts, apart from focusing on recovery prices and leverage multiples, there is another crucial classification that needs clarification: the difference between 'R-type' and 'N-type'. The core distinction lies in the cash settlement method after a mandatory recovery event is triggered.
'N-type' bull/bear contracts have a recovery price equal to their strike price. This means that once the underlying asset price hits the recovery price, the product will be mandatorily recovered, and investors typically receive no residual value payment, potentially losing their entire principal investment. On the other hand, 'R-type' bull/bear contracts have a recovery price different from their strike price. When a mandatory recovery event occurs, the issuer calculates based on the strike price and the reference price of the related asset at a certain point after triggering, possibly leaving investors with some residual cash payment (i.e., 'residual value'). Of course, in the worst-case scenario, the residual value may also be zero.
Taking the recommended products in this article as examples, both the Morley Bull Contract (53764) and HSBC Bear Contract (65572) are 'R-type' products. Assuming an investor holds the Morley Bull Contract (recovery price 135), if Baidu’s share price unfortunately drops to 135 triggering a recovery, the issuer will calculate the residual value based on its strike price (usually lower than the recovery price) and the settlement price of the underlying stock determined post-recovery, allowing the investor to potentially recover part of their funds. In contrast, if these products were designed as 'N-type', investments might be completely lost upon hitting the recovery price. Therefore, understanding the classification between 'R' and 'N' is a crucial step in assessing the maximum downside risk of bull/bear contracts.
Interactive Question: After Baidu's share price hit a new high, short-term overbought signals appeared on the technical side. Do you think the share price will first leverage positive fundamentals to successfully break through the first resistance level at 159.2 and continue rising, or will it first undergo a technical correction and retreat to test the first support level at 143.1? In the current situation where trends and adjustment pressures coexist, would you prefer using bull/bear contracts or warrants to deploy your strategy? Feel free to share your thoughts in the comments section.
For more detailed explanations of the terms and market strategy analysis for Hong Kong stock warrants and bull/bear contracts, follow @港股窩輪Jenny.
Friendly reminder: This article does not constitute any investment advice.
This article is for reference only and does not constitute any investment advice. The market data, opinions, and analysis contained herein may change at any time without prior notice. We shall not be liable for any loss or damage arising from reliance on the information in this article. Technical analysis merely indicates whether certain technical conditions are met; a comprehensive evaluation of asset performance should incorporate additional data. Trading decisions should not be based solely on the content of this article. Please note that past performance is not indicative of future results.
#Baidu #TechnicalAnalysis #SupportResistanceLevels #Warrants #BullBearCertificates #TypeR_BullBearCertificates #TypeN_BullBearCertificates #ArtificialIntelligence #HongKongStockDeployment #DerivativeProductStrategies
Risk Disclaimer: The above content only represents the author's view. It does not represent any position or investment advice of Futu. Futu makes no representation or warranty.Read more
Comments
to post a comment
9