
Long-term optimism and short-term caution: The collision of institutional and technical perspectives from [Hong Kong Stock Podcast]
As of January 19, 2026, the share price of Tencent (00700.HK) is at a crucial technical juncture. On one hand, the stock price remains above key moving averages, maintaining the framework of a medium-term upward trend; on the other hand, as it approaches the year's high, upward resistance has become increasingly apparent, with multiple technical indicators suggesting short-term overbought conditions and adjustment pressures. This article will integrate the latest technical data, market news, and key insights from [Hong Kong Stock Podcast] to analyze Tencent’s short-term price movements and guide investors on how to prudently use derivatives for strategic deployment under current market conditions.
I. Technical Analysis: Consolidation at highs, key support levels under test
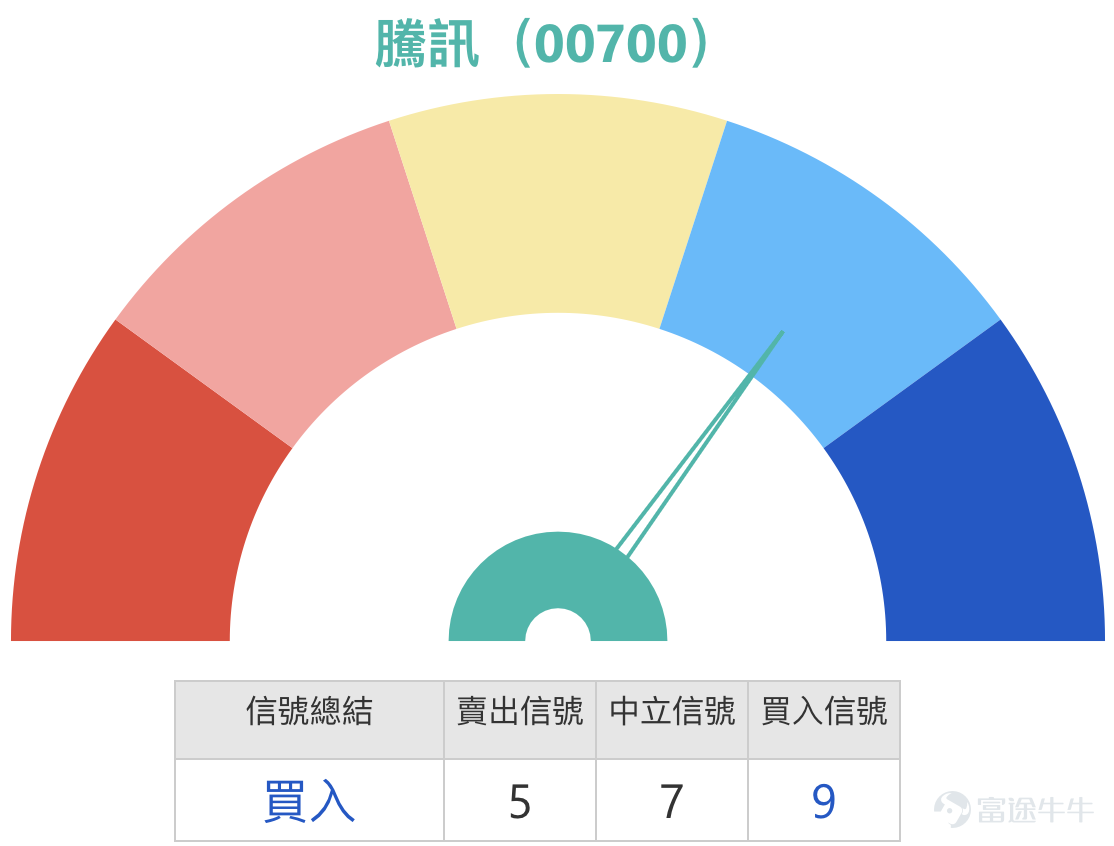
From the daily chart analysis, Tencent's share price reached a high of 633 yuan in mid-January, very close to the upper Bollinger Band (around 636 yuan), indicating that short-term upward momentum may be facing exhaustion. This technical phenomenon aligns with host Simon’s observation on the January 14 [Hong Kong Stock Podcast], where he noted 'Tencent’s movement seems weaker.' As of January 16, the stock closed at 617.5 yuan, slightly above the 10-day moving average (about 623.15 yuan) but still below the 20-day moving average, reflecting a weakening of short-term momentum. Although several oscillation indicator signals appear “neutral,” the overall technical signal summary leans slightly towards selling signals, further confirming the need for consolidation at these high levels. According to today’s (January 19) continued decline in Tencent’s share price, the current price stands at 610.5 yuan, down 1.13%.
The key price range thus becomes particularly clear. Above, the primary resistance level is at 634 yuan, with stronger resistance at 650 yuan, which also marks the upper Bollinger Band and a previous psychological threshold. Below, the first important line of defense is at 602 yuan, a position that not only represents the recent consolidation zone bottom but also forms support together with the 30-day moving average (around 611.8 yuan). As Simon emphasized on [Hong Kong Stock Podcast], if this position fails, the correction could deepen further to the second support level at 585 yuan, an area that coincides with deeper Fibonacci retracement support and a long-term trendline, holding significant technical importance.
![$TENCENT (00700.HK)$ As of January 19, 2026, the share price of Tencent (00700.HK) is at a crucial technical juncture. On one hand, the stock price remains above key moving averages, maintaining the framework of a medium-term upward trend; on the other hand, as it approaches the year's high, upward resistance has become increasingly apparent, with multiple technical indicators suggesting short-term overbought conditions and adjustment pressures. This article will integrate the latest technical data, market news, and key insights from [Hong Kong Stock Podcast] to analyze Tencent’s short-term price movements and guide investors on how to prudently use derivatives for strategic deployment under current market conditions. I. Technical Analysis: Consolidation at highs, key support levels under test [Share Link: January 14 [HK Stocks Podcast] Hang Seng Index, Tencent, Xiaomi, Wuxi Bio, Trip.Com, Ali Health ] From the daily chart analysis, Tencent's share price reached a high of 633 yuan in mid-January, very close to the upper Bollinger Band (around 636 yuan), indicating that short-term upward momentum may be facing exhaustion. This technical phenomenon aligns with host Simon’s observation on the January 14 [Hong Kong Stock Podcast], where he noted 'Tencent’s movement seems weaker.' As of January 16, the stock closed at 617.5 yuan, slightly above the 10-day moving average (about 623.15 yuan) but still below the 20-day moving average, reflecting a weakening of short-term momentum...](https://nnqimage.futunn.com/sns_client_feed/1162342/20260119/web-1768795141218-pqQ4F3R2ek.png/big?area=1&is_public=true&imageMogr2/ignore-error/1/format/webp)
II. Integration of Market Views: Strong long-term fundamentals coexist with cautious short-term technical outlook
The current market view on Tencent exhibits a clear binary structure. From a long-term perspective, research reports from major banks are generally optimistic, providing a solid valuation anchor for the stock price. UBS Group recently reiterated Tencent as a 'top pick and key recommendation,' highlighting its firm commitment to restructuring its organization and attracting talent in the artificial intelligence field. In particular, WeChat, with its massive user ecosystem, holds a unique advantage in AI agent applications. UBS has assigned a 'Buy' rating with a target price of 780 yuan. Similarly, Nomura Securities expects Tencent's revenue from the previous quarter to achieve double-digit year-on-year growth, maintaining a 'Buy' rating and a target price of 775 yuan. Guohai Securities has even set a target price of 791 yuan, citing strong momentum in core businesses like gaming and advertising, along with ongoing AI empowerment.
However, at the short-term trading level, investor sentiment is more cautious, which aligns with technical signals. The market dynamics revealed in [HKEX Podcast] are highly representative: some investors have explicitly asked about entry points when the trend appears weak, mentioning that there are investors holding bull certificates with a strike price near 587 yuan. This behavior reflects that some capital is attempting to position itself in anticipation of a rebound at prices significantly lower than the current market, considered safer, to hedge against possible adjustments.SimonThe advice given in the program was very specific: 'Bull certificates below 600 yuan are relatively safe at this juncture,' directly providing market references and standards for subsequent risk control of derivatives. This 'long-term optimism, short-term caution' sentiment collectively forms Tencent's current complex market backdrop.
III. Review and Strategic Value of Warrant Products
Reviewing the recent performance of the warrant market, it is clear that derivative instruments play an 'amplifier' role during underlying stock volatility. Taking several bearish products mentioned on January 14, 2026, as an example, in the following two trading days when the underlying stock fell by approximately 2.45%, related products recorded more significant gains due to their leverage. Among them, the Morgan Bear Certificate (55281)... $MS#TENCTRP2808D.P (55281.HK)$ rose 48%, while UBS Put Warrants (21340) and Bank of China Put Warrants (24406) $BITENCT@EP2606B.P (24406.HK)$ increased by 15% and 17%, respectively.
![$TENCENT (00700.HK)$ As of January 19, 2026, the share price of Tencent (00700.HK) is at a crucial technical juncture. On one hand, the stock price remains above key moving averages, maintaining the framework of a medium-term upward trend; on the other hand, as it approaches the year's high, upward resistance has become increasingly apparent, with multiple technical indicators suggesting short-term overbought conditions and adjustment pressures. This article will integrate the latest technical data, market news, and key insights from [Hong Kong Stock Podcast] to analyze Tencent’s short-term price movements and guide investors on how to prudently use derivatives for strategic deployment under current market conditions. I. Technical Analysis: Consolidation at highs, key support levels under test [Share Link: January 14 [HK Stocks Podcast] Hang Seng Index, Tencent, Xiaomi, Wuxi Bio, Trip.Com, Ali Health ] From the daily chart analysis, Tencent's share price reached a high of 633 yuan in mid-January, very close to the upper Bollinger Band (around 636 yuan), indicating that short-term upward momentum may be facing exhaustion. This technical phenomenon aligns with host Simon’s observation on the January 14 [Hong Kong Stock Podcast], where he noted 'Tencent’s movement seems weaker.' As of January 16, the stock closed at 617.5 yuan, slightly above the 10-day moving average (about 623.15 yuan) but still below the 20-day moving average, reflecting a weakening of short-term momentum...](https://nnqimage.futunn.com/sns_client_feed/1162342/20260119/web-1768795059545-1ha1DfpOg7.png/big?area=1&is_public=true&imageMogr2/ignore-error/1/format/webp)
IV. Derivative Deployment Strategies under Current Market Conditions
As Tencent's stock price remains within a key technical range characterized by 'resistance above and support below,' deploying derivatives must closely integrate product terms with the aforementioned critical support/resistance levels while strictly adhering to risk management principles.
Analysis of Warrant Products:
For investors who are optimistic about the market outlook and expect the stock price to stabilize at the support level before breaking through the resistance level, they may consider highly leveraged call warrants. For example, UBS Group call warrant (23638). $UBTENCT@EC2606E.C (23638.HK)$ And HSBC call warrant (23657). $HSTENCT@EC2606D.C (23657.HK)$ Both have an exercise price of 729.38 yuan, offering approximately 10 times actual leverage. This exercise price is much higher than the current stock price and the strong resistance level of 650 yuan, making it a deep out-of-the-money clause. The characteristic of this type is its high potential leverage, suitable for investors with a higher risk appetite who anticipate significant stock price breakthroughs. For investors who are bearish on the market outlook and believe that the stock price will test the support level downward, put warrants can be considered. Among them, Credit Suisse put warrant (21495) has an exercise price of 571.27 yuan, close to the second support level of 585 yuan. Its clause features the lowest premium and implied volatility among similar products, helping control holding costs and time value decay. Another put warrant from Bank of China (21191) $BITENCT@EP2603C.P (21191.HK)$ has an exercise price of 570.27 yuan, providing relatively high leverage of about 13.8 times, suitable for investors seeking higher capital efficiency in bearish strategies.
![$TENCENT (00700.HK)$ As of January 19, 2026, the share price of Tencent (00700.HK) is at a crucial technical juncture. On one hand, the stock price remains above key moving averages, maintaining the framework of a medium-term upward trend; on the other hand, as it approaches the year's high, upward resistance has become increasingly apparent, with multiple technical indicators suggesting short-term overbought conditions and adjustment pressures. This article will integrate the latest technical data, market news, and key insights from [Hong Kong Stock Podcast] to analyze Tencent’s short-term price movements and guide investors on how to prudently use derivatives for strategic deployment under current market conditions. I. Technical Analysis: Consolidation at highs, key support levels under test [Share Link: January 14 [HK Stocks Podcast] Hang Seng Index, Tencent, Xiaomi, Wuxi Bio, Trip.Com, Ali Health ] From the daily chart analysis, Tencent's share price reached a high of 633 yuan in mid-January, very close to the upper Bollinger Band (around 636 yuan), indicating that short-term upward momentum may be facing exhaustion. This technical phenomenon aligns with host Simon’s observation on the January 14 [Hong Kong Stock Podcast], where he noted 'Tencent’s movement seems weaker.' As of January 16, the stock closed at 617.5 yuan, slightly above the 10-day moving average (about 623.15 yuan) but still below the 20-day moving average, reflecting a weakening of short-term momentum...](https://nnqimage.futunn.com/sns_client_feed/1162342/20260119/web-1768795086134-838MHXbZnP.jpeg/big?area=1&is_public=true&imageMogr2/ignore-error/1/format/webp)
Bull and Bear Certificate Product Analysis:
Due to their forced recall mechanism, careful selection of terms for bull and bear certificates is crucial, ensuring sufficient safety buffer is reserved for daily stock price fluctuations. For investors optimistic about the market outlook, when choosing bull certificates, the recall price should be significantly lower than key technical support levels. For example, Bank of China bull certificate (65930) $BI#TENCTRC2612A.C (65930.HK)$ has a recall price of 590 yuan, while UBS Group bull certificate (61011) $UB#TENCTRC26066.C (61011.HK)$ has a recall price of 593 yuan. Both recall prices are below the first support level of 602 yuan, and even further below the second support level of 585 yuan, aligning with the principle of “below 600 yuan is safer” mentioned in [Hong Kong Stock Podcast], offering better shock absorption. For investors who are bearish on the market outlook, when selecting bear certificates, the recall price should be significantly above key technical resistance levels. For instance, Societe Generale bear certificate (55685) has a recall price of 645 yuan, while UBS Group bear certificate (60196) has a recall price of 640 yuan. These recall prices are close but slightly above the first resistance level of 634 yuan and below the strong resistance level of 650 yuan. Such design is suitable for capturing short-term opportunities when stock prices encounter resistance and retreat, but investors must be wary of the risk of product recall if the stock price strongly breaks through resistance.
![$TENCENT (00700.HK)$ As of January 19, 2026, the share price of Tencent (00700.HK) is at a crucial technical juncture. On one hand, the stock price remains above key moving averages, maintaining the framework of a medium-term upward trend; on the other hand, as it approaches the year's high, upward resistance has become increasingly apparent, with multiple technical indicators suggesting short-term overbought conditions and adjustment pressures. This article will integrate the latest technical data, market news, and key insights from [Hong Kong Stock Podcast] to analyze Tencent’s short-term price movements and guide investors on how to prudently use derivatives for strategic deployment under current market conditions. I. Technical Analysis: Consolidation at highs, key support levels under test [Share Link: January 14 [HK Stocks Podcast] Hang Seng Index, Tencent, Xiaomi, Wuxi Bio, Trip.Com, Ali Health ] From the daily chart analysis, Tencent's share price reached a high of 633 yuan in mid-January, very close to the upper Bollinger Band (around 636 yuan), indicating that short-term upward momentum may be facing exhaustion. This technical phenomenon aligns with host Simon’s observation on the January 14 [Hong Kong Stock Podcast], where he noted 'Tencent’s movement seems weaker.' As of January 16, the stock closed at 617.5 yuan, slightly above the 10-day moving average (about 623.15 yuan) but still below the 20-day moving average, reflecting a weakening of short-term momentum...](https://nnqimage.futunn.com/sns_client_feed/1162342/20260119/web-1768795095098-zndxzxRFZq.jpeg/big?area=1&is_public=true&imageMogr2/ignore-error/1/format/webp)
#FollowJennyToLearnWarrantsAndBullBearCertificates# Key Insights: The Core Risk of Derivatives — Time Value Decay
When choosing warrants (call/put options), in addition to focusing on exercise prices and leverage, time value decay is a hidden cost that must be understood. Time value accelerates as the expiration date approaches, meaning that even if the underlying stock price remains unchanged, the price of the warrant will decline over time. Generally speaking, the shorter the remaining term and the higher the out-of-the-money degree, the faster the time value decays. Therefore, investors should not treat warrants as long-term holdings but rather as tools to express short-term market views, closely monitoring their remaining term.
5. Interactive Q&A
Given Tencent's current situation where its long-term fundamentals are favored by institutional investors but its short-term technical outlook is under pressure, how would you balance your strategy?
1. Would you lean towards believing in long-term value and consider deploying in batches using instruments like the BOC bull contract (65930) with a recovery price of 590 when the stock price retraces to key support levels of 602 or even 585?
2. Or do you place more emphasis on short-term trends, waiting for a clear breakout above the short-term resistance level of 634 before following up with high-leverage call warrants, such as UBS Group call warrant (23638)?
3. Alternatively, do you think the correction is not over yet, and are you watching for short-term trading opportunities near the resistance zone of 640-645 using bearish tools like Societe Generale bear contract (55685)?
Feel free to share your insights and trading logic in the comment section. Investing in derivatives carries extremely high risks, prices can rise and fall sharply, and investors may lose all their capital. Before making any investment decisions, be sure to read the relevant listing documents carefully to fully understand the product characteristics and risks. For more real-time analysis, in-depth interpretation of terms, and practical strategy discussions on Hong Kong stocks and derivatives, follow 'Hong Kong Warrants Jenny'.
Disclaimer: This article does not constitute any investment advice.
This article is for reference only and does not constitute any investment advice. The market data, opinions, and analysis contained herein may change at any time without prior notice. We shall not be liable for any loss or damage arising from reliance on the information in this article. Technical analysis merely indicates whether certain technical conditions are met; a comprehensive evaluation of asset performance should incorporate additional data. Trading decisions should not be based solely on the content of this article. Please note that past performance is not indicative of future results.
#Tencent Holdings #00700 #Technical Analysis #Support and Resistance Levels #Warrants #Bull and Bear Certificates #Derivatives #Time Value Decay #Hong Kong Stock Podcast #Capital Efficiency
Risk Disclaimer: The above content only represents the author's view. It does not represent any position or investment advice of Futu. Futu makes no representation or warranty.Read more


Comment (1)
to post a comment
4
9