

The tech gala is here! Can CES 2026 ignite a tech rally?
Technical Analysis of the Seven Major U.S. Tech Stocks (January 7): MAGS/NVIDIA/Microsoft/Apple/Amazon/Google/META/Tesla
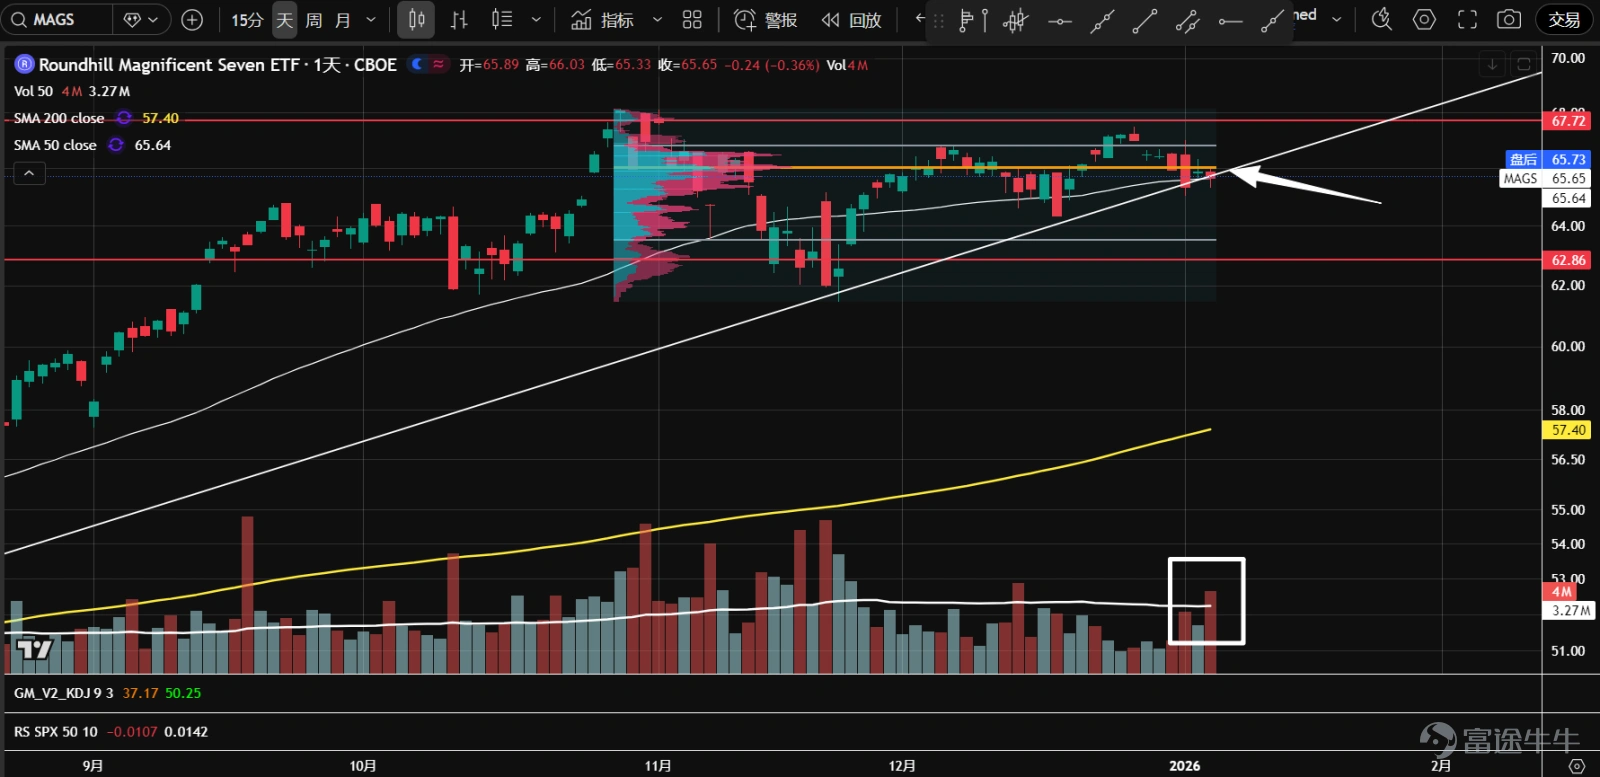
1. The ETF of the seven major tech stocks ( $Roundhill Magnificent Seven ETF (MAGS.US)$ It once broke through the upper limit of the value range at the end of December, but due to insufficient demand, it has retreated back into the range. It is currently oscillating near the volume control point (orange line), and trading volume has started to increase; it is recommended to observe.
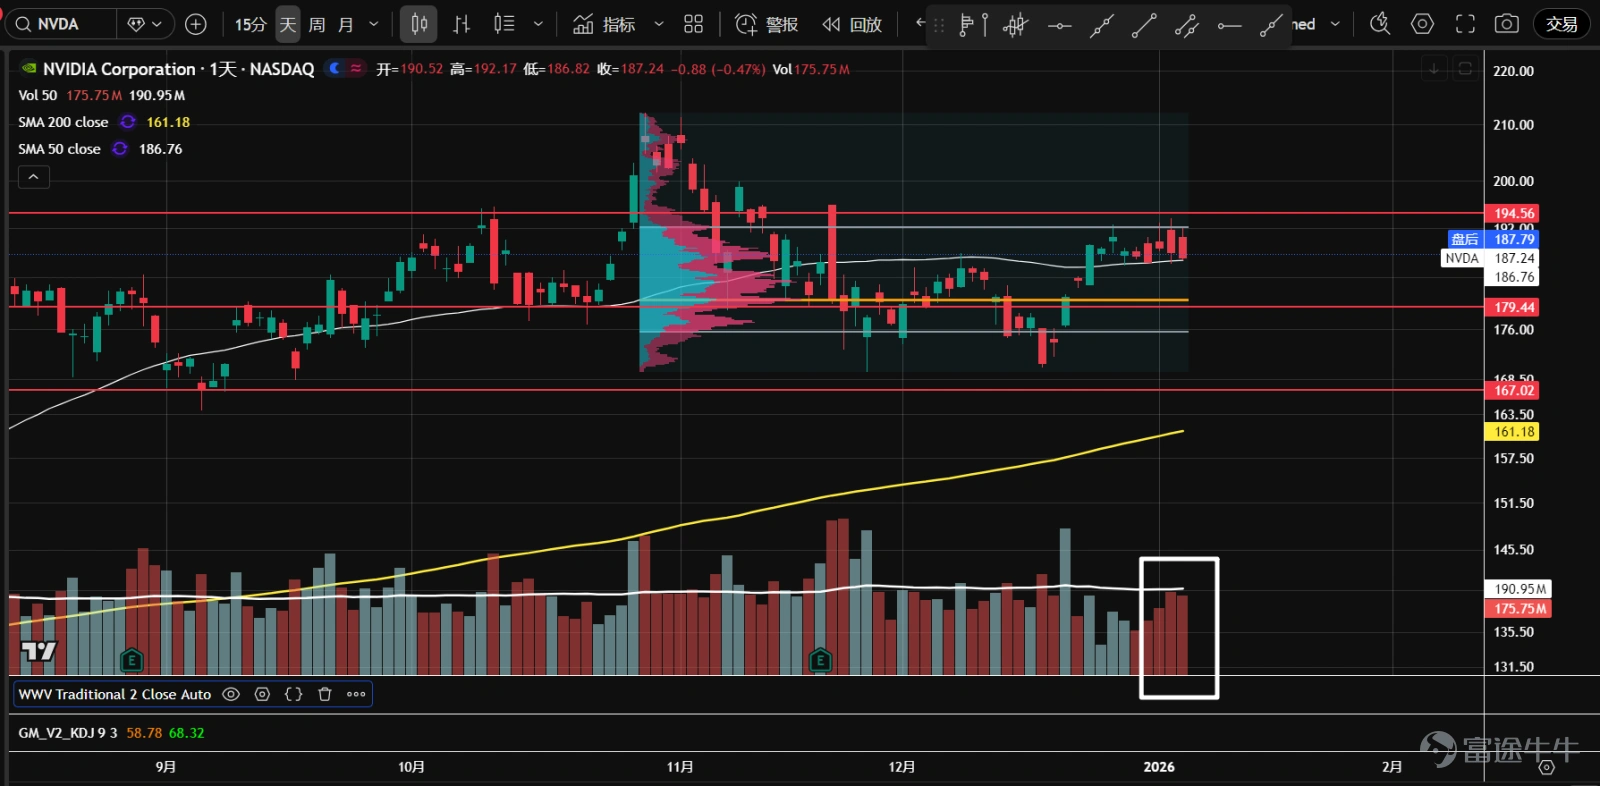
2、 $NVIDIA (NVDA.US)$ The stock is in a sideways consolidation phase and is currently challenging the resistance level of 194.5. The trading volume has been continuously expanding recently. Although the candlestick closed as a bearish line and settled at a low position, the closing prices have been close for several consecutive days without significant follow-through declines, suggesting that bulls may be absorbing floating shares.
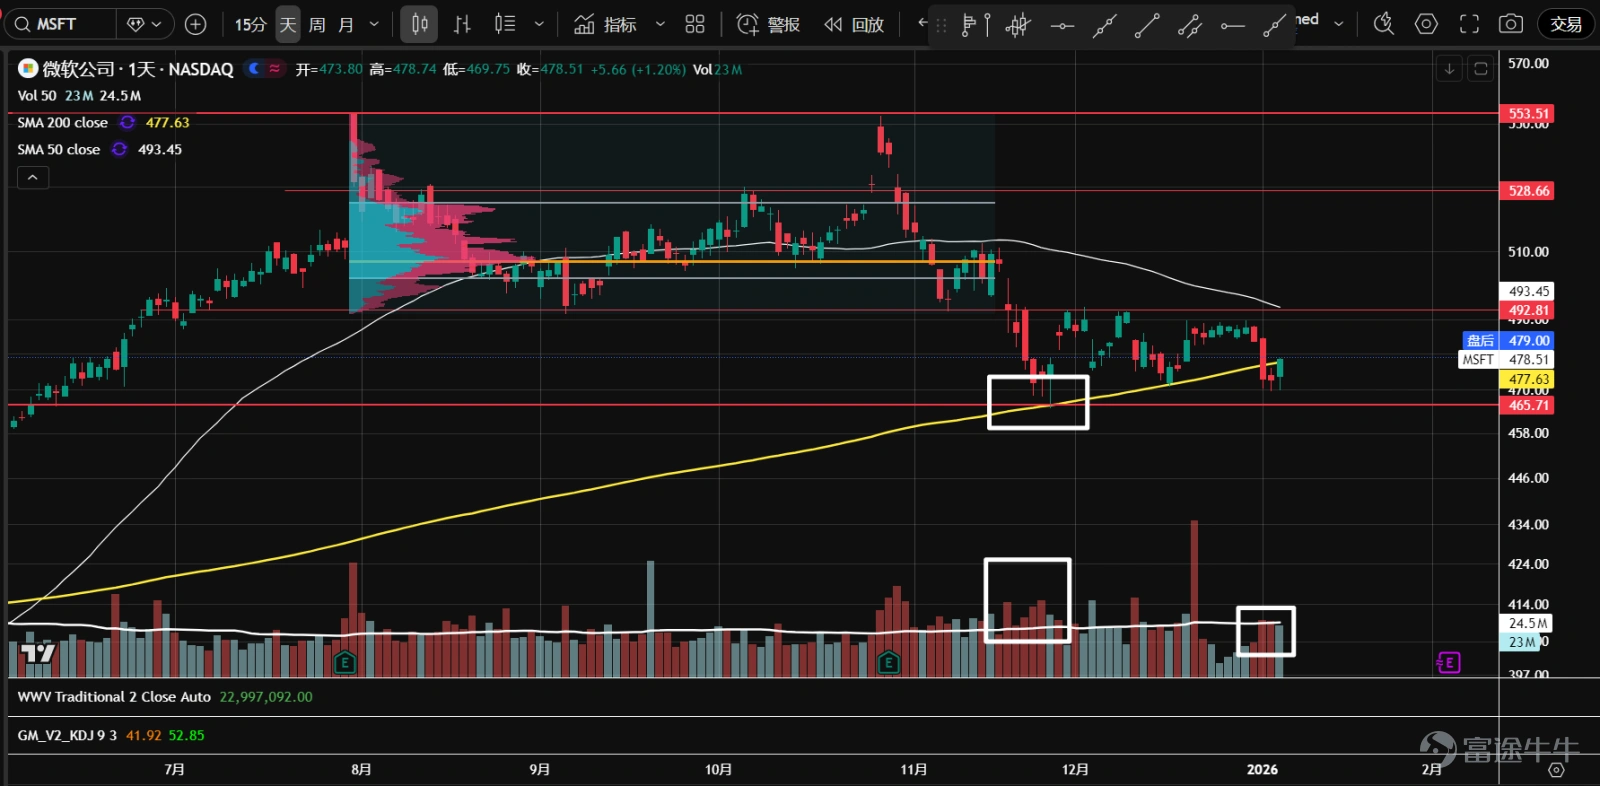
3、 $Microsoft (MSFT.US)$ The price has approached the support level near the previous low at 477.6 again. A morning star pattern has appeared on the candlestick chart, and the trading volume is gradually increasing. The overall volume is lower than when the price fell to this level in November. This could be a second test, and the stock price may stabilize.
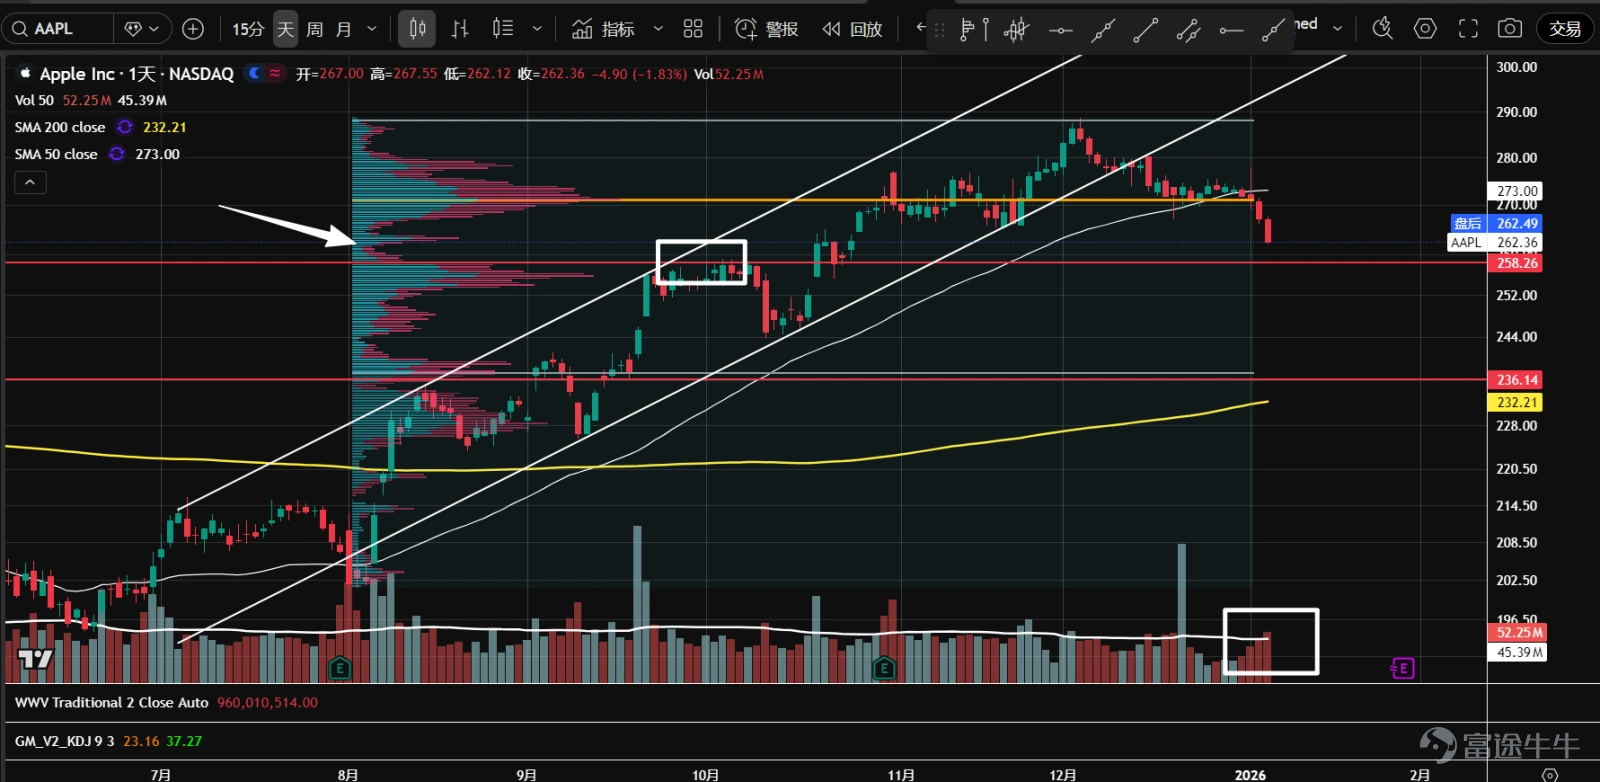
4、 $Apple (AAPL.US)$ A P-shaped volume distribution has formed. Since the high-level consolidation, the price has fluctuated around the volume control point (orange line). In recent days, there has been a continuous decline, approaching the 258-axis level and reaching a low-volume node. The trading volume is gradually expanding, indicating a possible stabilization.
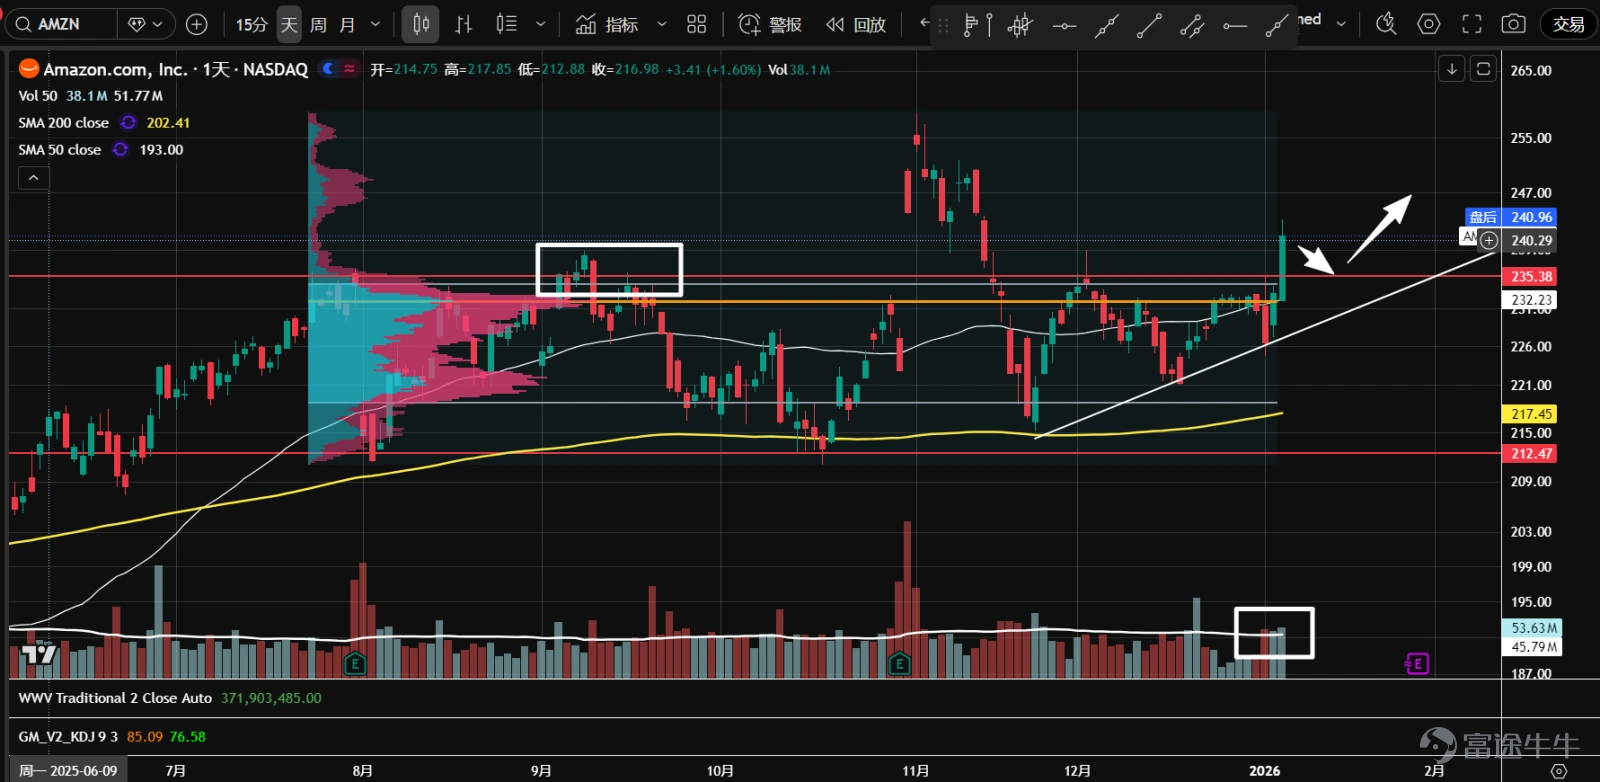
5、 $Amazon (AMZN.US)$ The price broke upward with increased volume at the angle of the consolidation range, once again standing above the 235-axis level and value zone. If the market sees a pullback with reduced volume in the future and confirms an effective breakout, upside potential may open up.
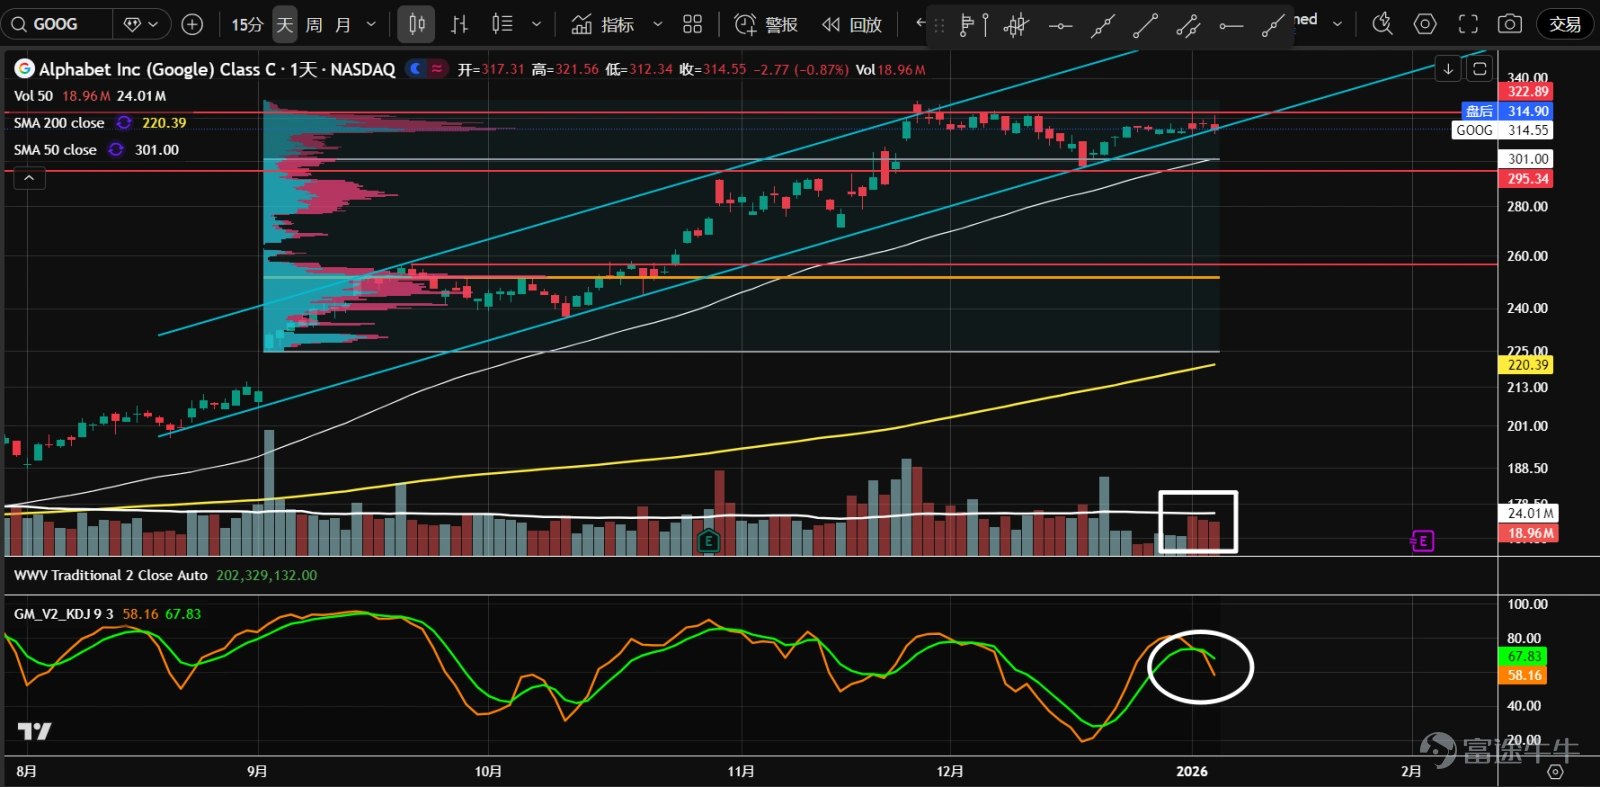
6、 $Alphabet-C (GOOG.US)$ The price continues to operate within the uptrend channel, but recent rallies have seen shrinking volume, failing to break through the previous high. Increased volume emerged near the resistance at the angle position. The candlestick closed at a low level, and the volume distribution has formed a second major peak. With KD showing a bearish crossover at a high level, the likelihood of breaking down the channel and entering a consolidation phase is high.
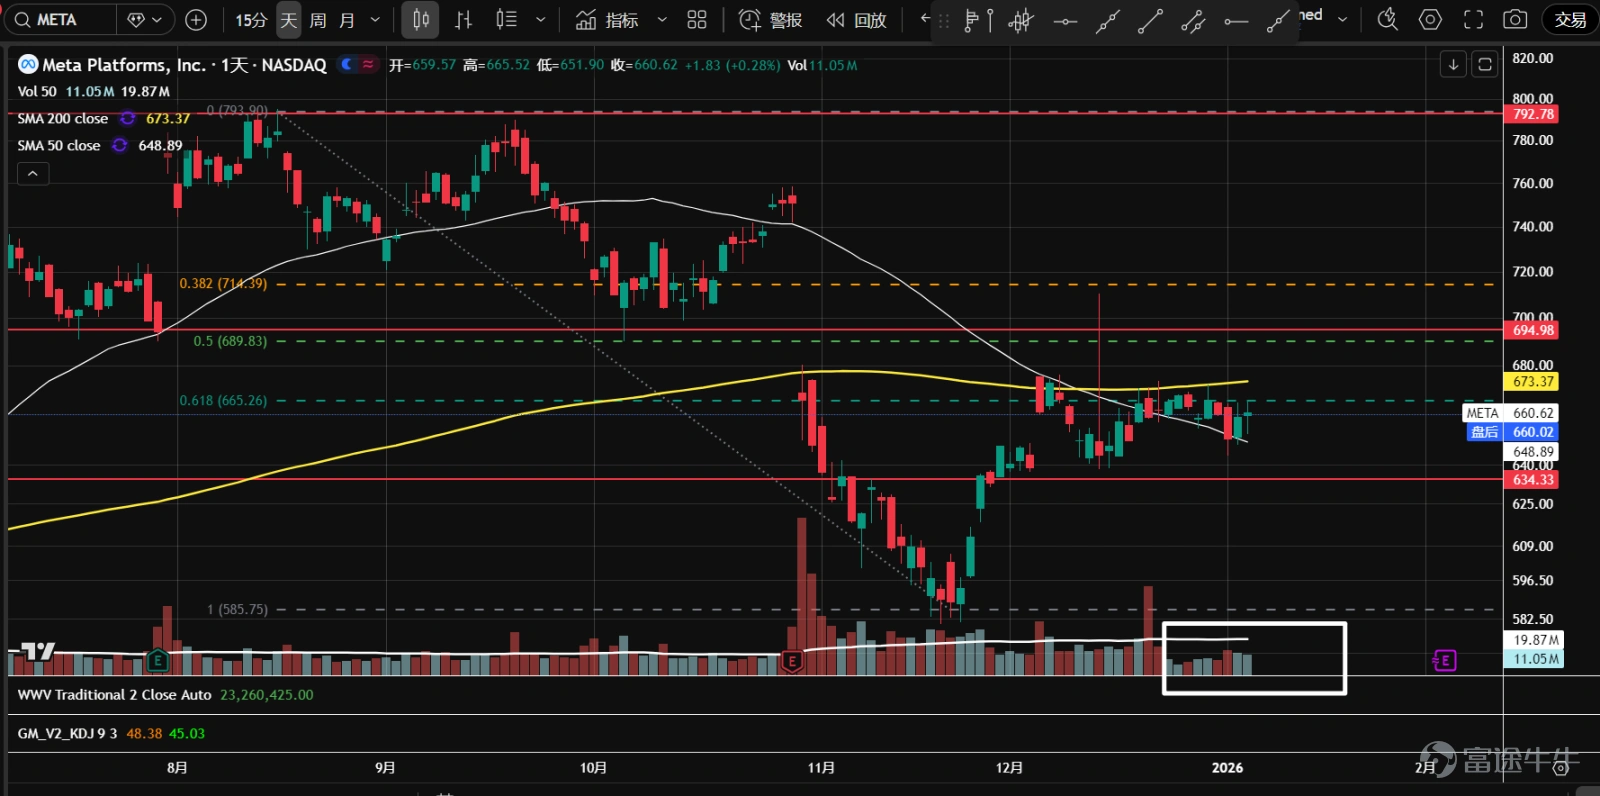
7、 $Meta Platforms (META.US)$ After bottoming out in November, the price quickly rebounded to the 61.8% retracement level of the previous downtrend while also hitting the yearly resistance line. After encountering resistance with high volume, the volume began to shrink rapidly. Insufficient demand might trigger a pullback. Even if the price rebounds, the resistance at the 50% retracement level remains significant.
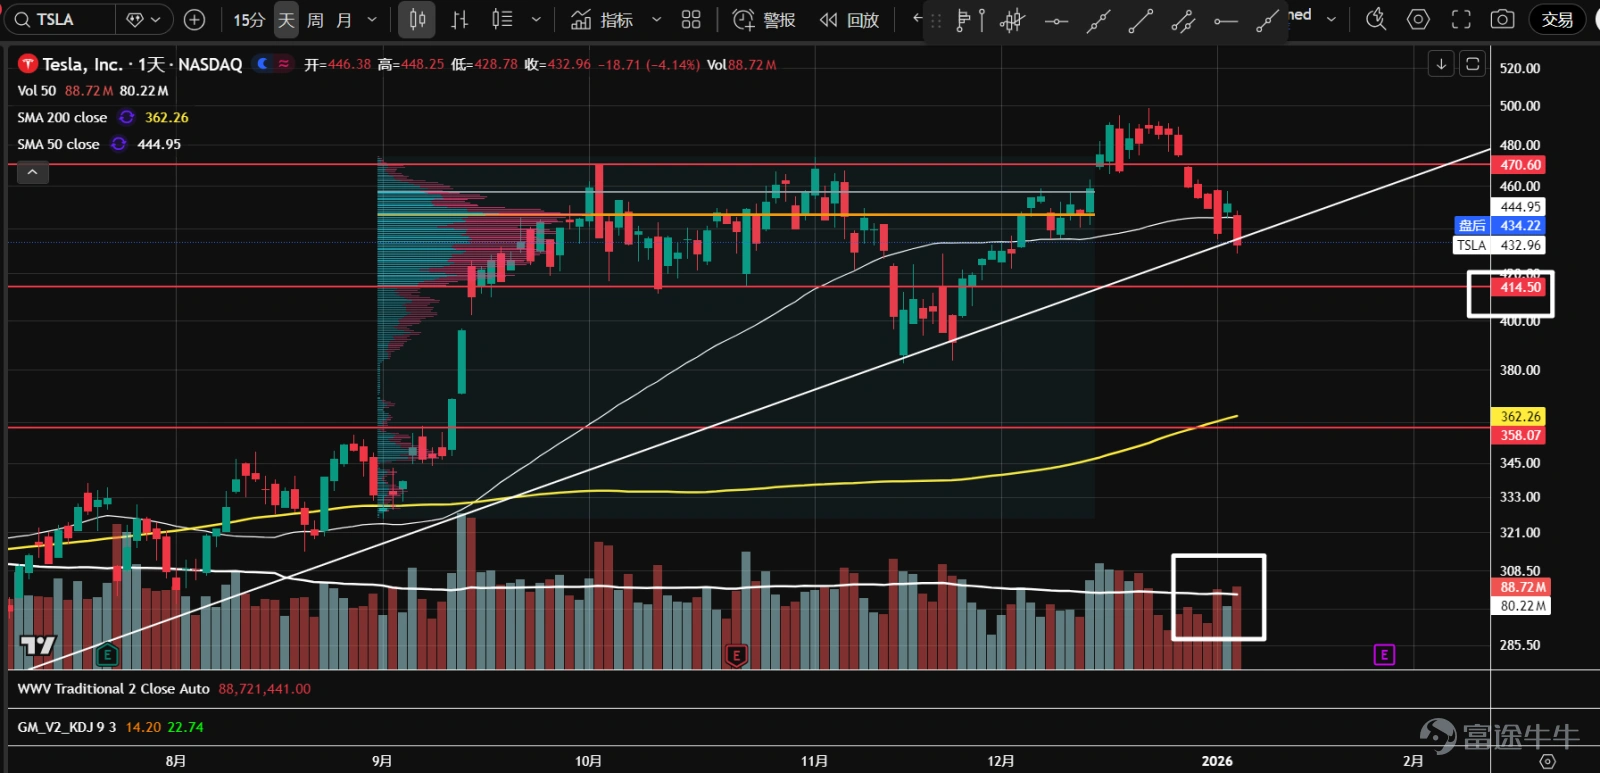
8、 $Tesla (TSLA.US)$ Following a false upward breakout in late December, the price retreated back into the range. As it fell toward the uptrend line, volume gradually increased as bulls started resisting. However, the candlestick closed bearish and at a lower level. If support is broken, the price will test the 414.5-axis position.
$S&P 500 Index (.SPX.US)$ $SPDR S&P 500 ETF (SPY.US)$ $NASDAQ 100 Index (.NDX.US)$ $Invesco QQQ Trust (QQQ.US)$ $Dow Jones Industrial Average (.DJI.US)$ $State Street® SPDR® Dow Jones Industrial Average® ETF Trust (DIA.US)$ $Russell 2000 Index (.RUT.US)$ $iShares Russell 2000 ETF (IWM.US)$ $USD (USDindex.FX)$ $U.S. 10-Year Treasury Notes Yield (US10Y.BD)$ $XAU/USD (XAUUSD.CFD)$ $Bitcoin (BTC.CC)$ $Ethereum (ETH.CC)$
Risk Disclaimer: The above content only represents the author's view. It does not represent any position or investment advice of Futu. Futu makes no representation or warranty.Read more


Comments
to post a comment
13
1