HBM shortages drive up chip prices: Is the memory supercycle continuing?

SK Hynix hits all-time high on US market; what signals is the technical analysis revealing?
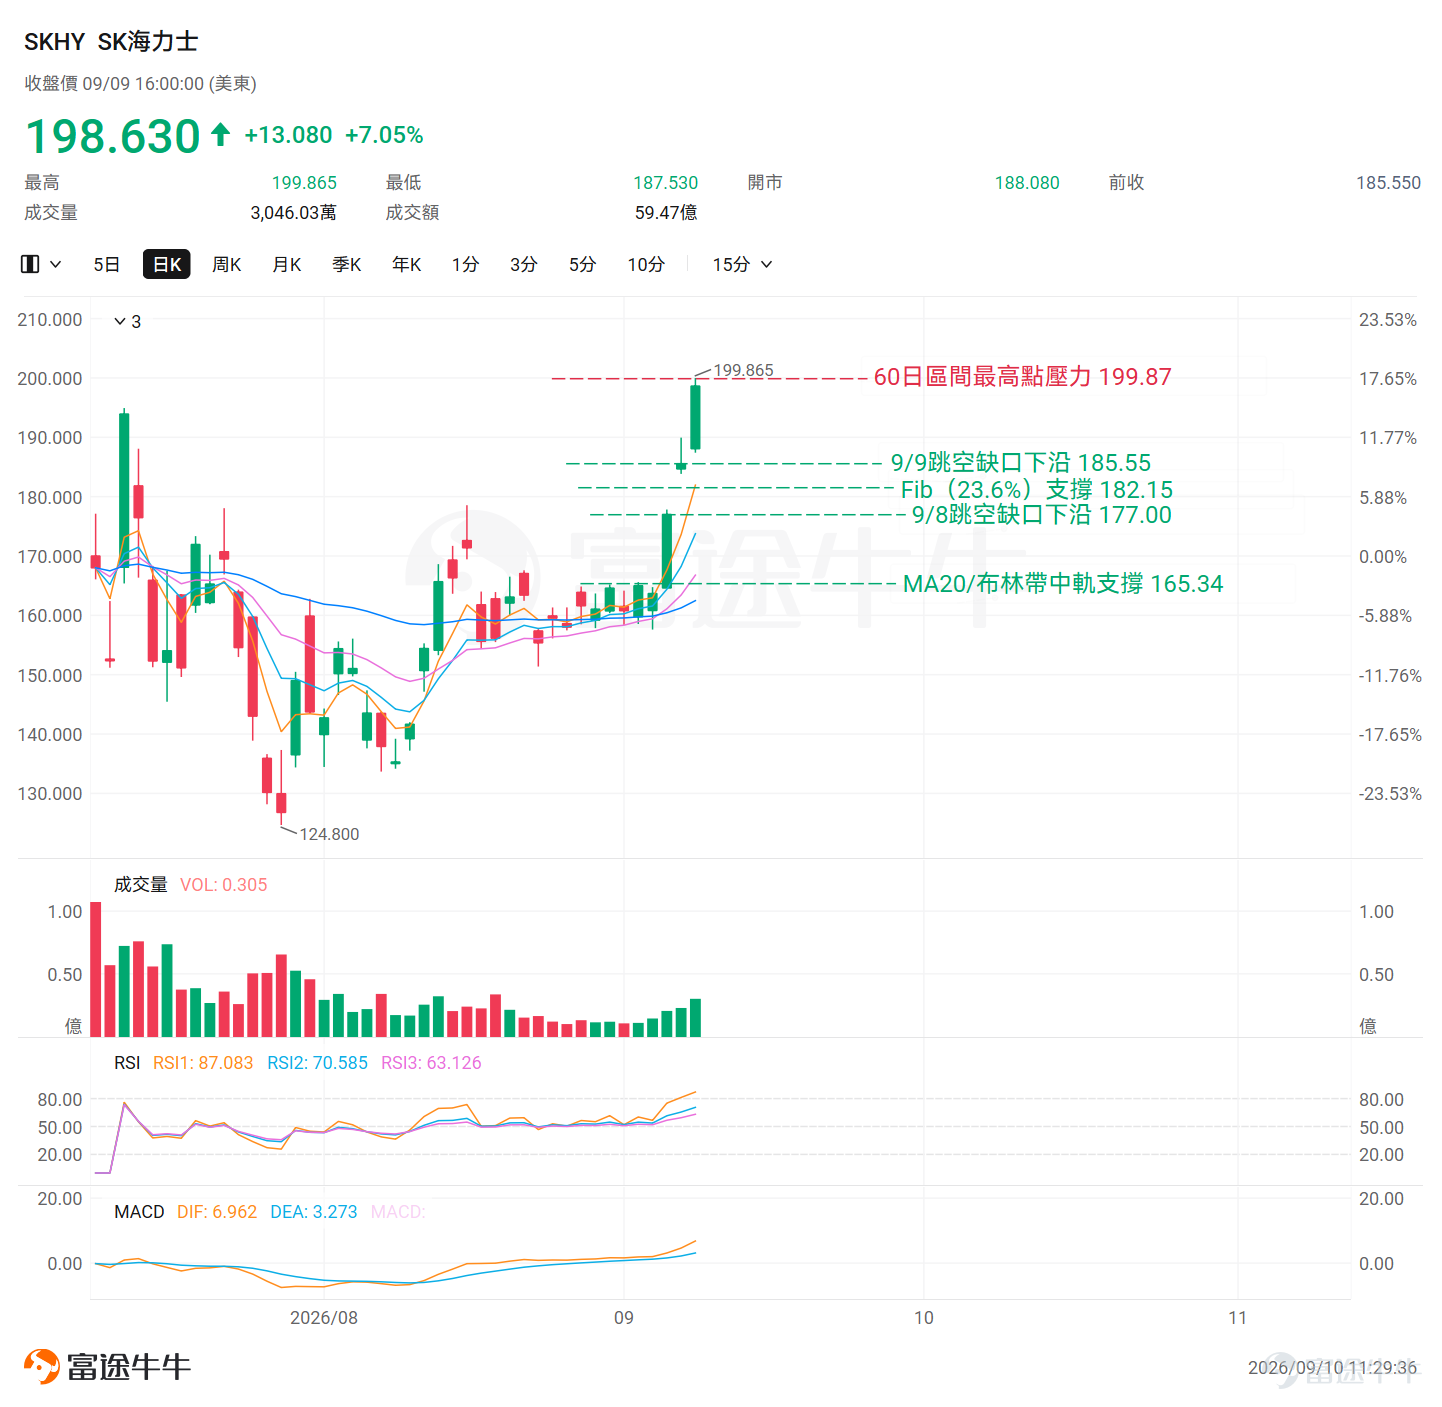
On Wednesday, $SK hynix (SKHY.US)$ it surged over 7%, closing at $198.63, marking its highest level since listing on the Nasdaq in July of this year. Intraday, it briefly touched $199.87, approaching the psychological barrier of $200.
Behind this rally lies a triple boost: KB Securities of South Korea pointed out that inventory levels for memory chips at Samsung Electronics and SK Hynix have dropped to less than 10 days' supply, with next year's demand for DRAM and NAND expected to exceed supply by more than 10 percentage points, termed a "historic shortage"; AI data centers continue to absorb capacity for DRAM, NAND, and HBM, prompting KB Securities to raise its forecast for global hyperscale tech firms' AI infrastructure investment next year to $1.3 trillion, a 60% year-on-year increase; meanwhile, market expectations suggest the company may prepare a share buyback and cancellation plan worth approximately KRW 20–40 trillion in the fourth quarter.
While fundamental catalysts are clear, prices are hovering near historical highs. Below, we will analyze SK Hynix's current price trend and key structural levels from a technical perspective.
Recent stock price movement
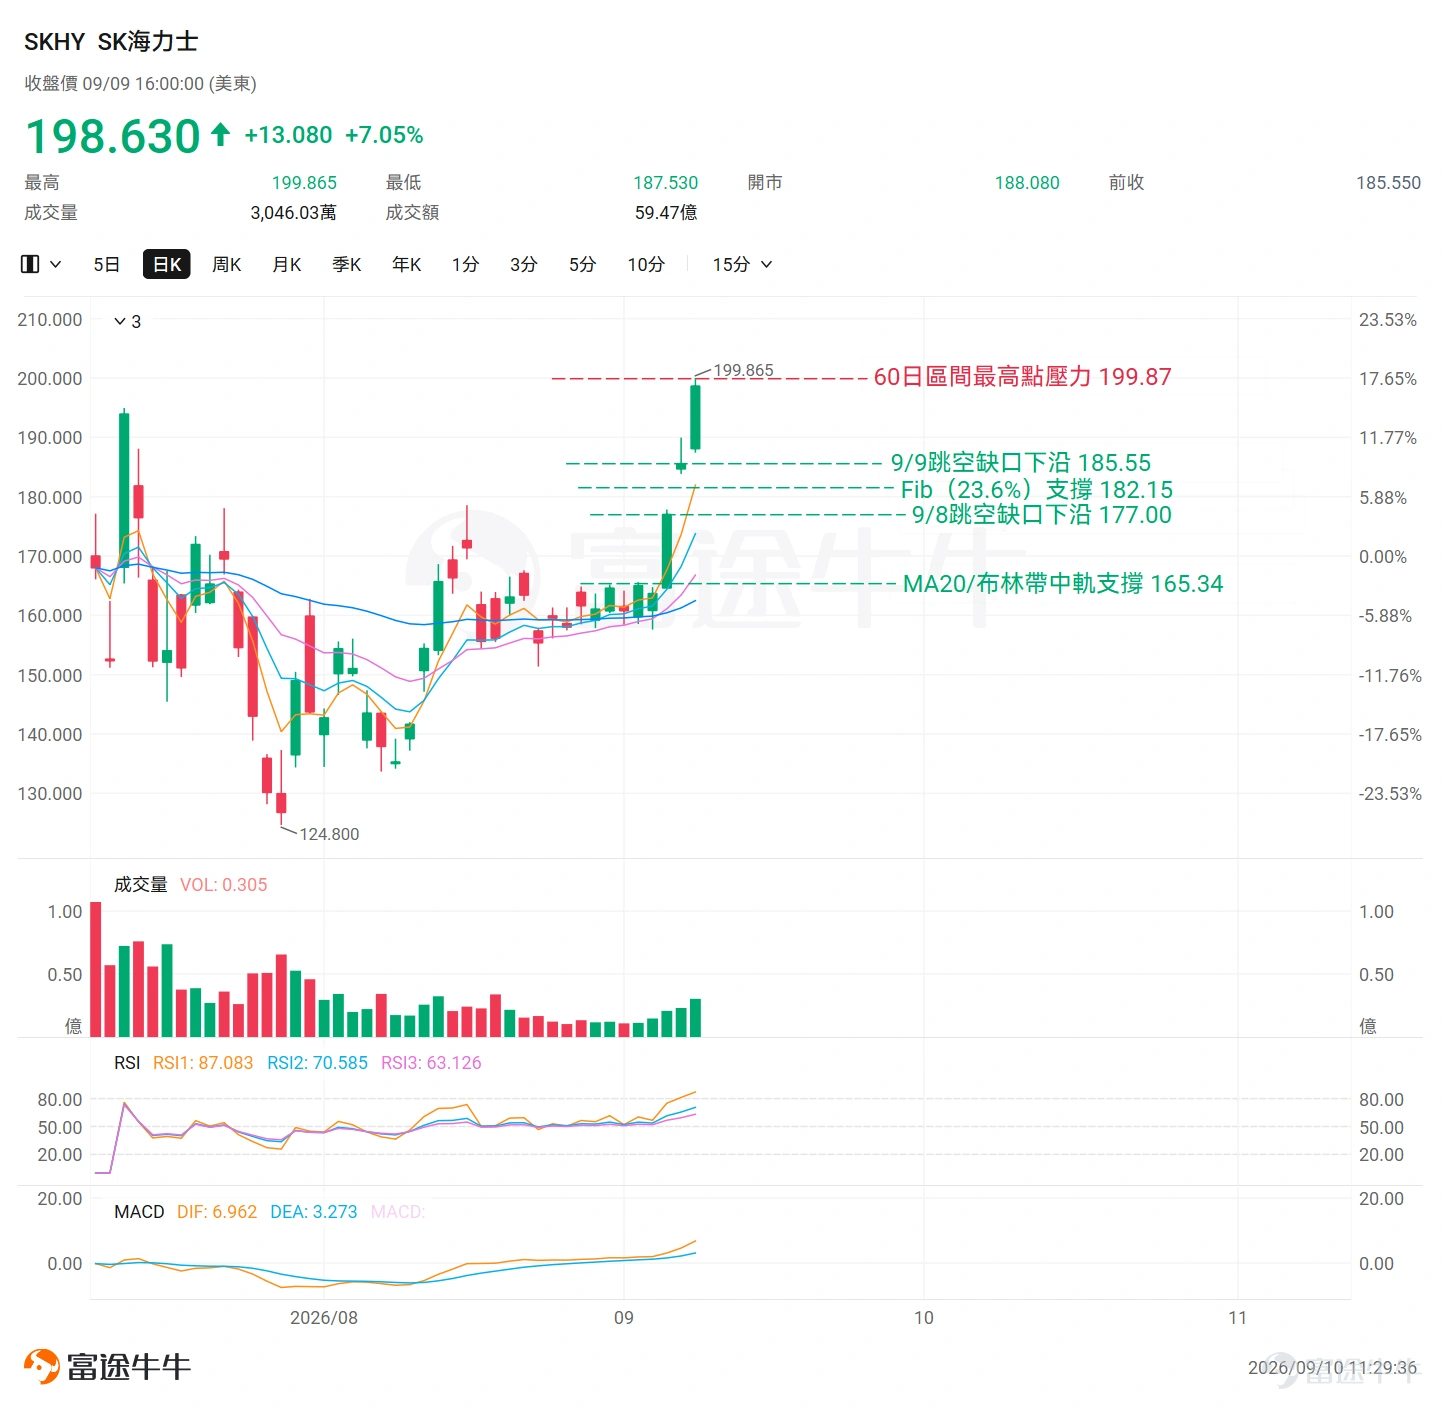
$SK hynix (SKHY.US)$The stock maintains a strong uptrend, with EMA5 > EMA10 > EMA20 forming a perfect bullish alignment.In the past two days, prices broke out of the consolidation zone via gap-ups and accelerated upward, forming three consecutive bullish gaps on September 4, September 8, and September 9,with significantly enlarged real bodies, signaling strong trend continuation.The current price of $198.63 is significantly higher than the MA20 ($165.34),with momentum at recent highs;on September 9, an upper shadow of approximately $1.24 appeared. Although limited in magnitude, it occurred within the historical high range.
Key Technical Indicator Analysis
EMA Moving Averages:The 5-day EMA is at $181.95, the 10-day EMA at $173.76, and the 20-day EMA at $166.99. The price is more than $16 above all moving averages, indicating a complete bullish alignment; however, the deviation from the 20-day EMA is approximately $31.6 (about 19%), suggesting significant short-term overextension and pressure for mean reversion.
RSI:70.585. It has entered the overbought zone (>70), showing signs of short-term overheating. While there is no obvious bearish divergence yet, the upside potential is further narrowing. Caution is advised regarding high-level consolidation or a pullback for stabilization.
MACD:The MACD line (6.962) is above the Signal line (3.273), forming a golden cross above the zero axis. The histogram is expanding, indicating strengthening momentum with no divergence.
Bollinger Bands:The latest closing price of $198.63 has broken above the upper band at $186.51. The bandwidth of 42.34 is in an expansion phase, characteristic of a strong trend rather than a simple overbought stop-loss signal. However, be wary of the risk of reverting to the middle band after the bandwidth peaks.
Fibonacci:The current price of $198.63 is trading just below the 60-day high of $199.87 (Fib 0%). In case of a pullback, the first support level is at $182.15 (Fib 23.6%), followed by $171.19 (Fib 38.2%).
* Fibonacci retracement levels are automatically calculated based on the highest and lowest stock prices over the past 60 trading days, rather than manually selected swing highs and lows. The actual effectiveness of support/resistance levels should be confirmed by market movements.
Comprehensive assessment
Regarding key support,$185.55Corresponds toThe lower edge of the support zone formed by the September 8th closing price and recent gap-ups,serves as the primary short-term buy-support level; if this level breaks, attention shifts tothe Fib 23.6% retracement level at $182.15Looking further down,$177.00 corresponds to the lower edge of the gap from September 8,forming the first strong support level.
On the resistance side, pay close attention tothe 60-day high of $199.87.The current price is hovering near this level; a breakout requires clear confirmation via increased volume;the previously breached upper Bollinger Band at $186.51 can now serve as a reference for near-term pullbacks.
Overall, trend indicators still support a bullish structure, but the deviation between price and moving averages is significant, and the price is testing absolute highs. In the short term, watch whether it can hold above the $200 mark and whether the gap will be filled.
Intraday trading waits for no one; volatility is extreme, and liquidity can vanish in an instant.
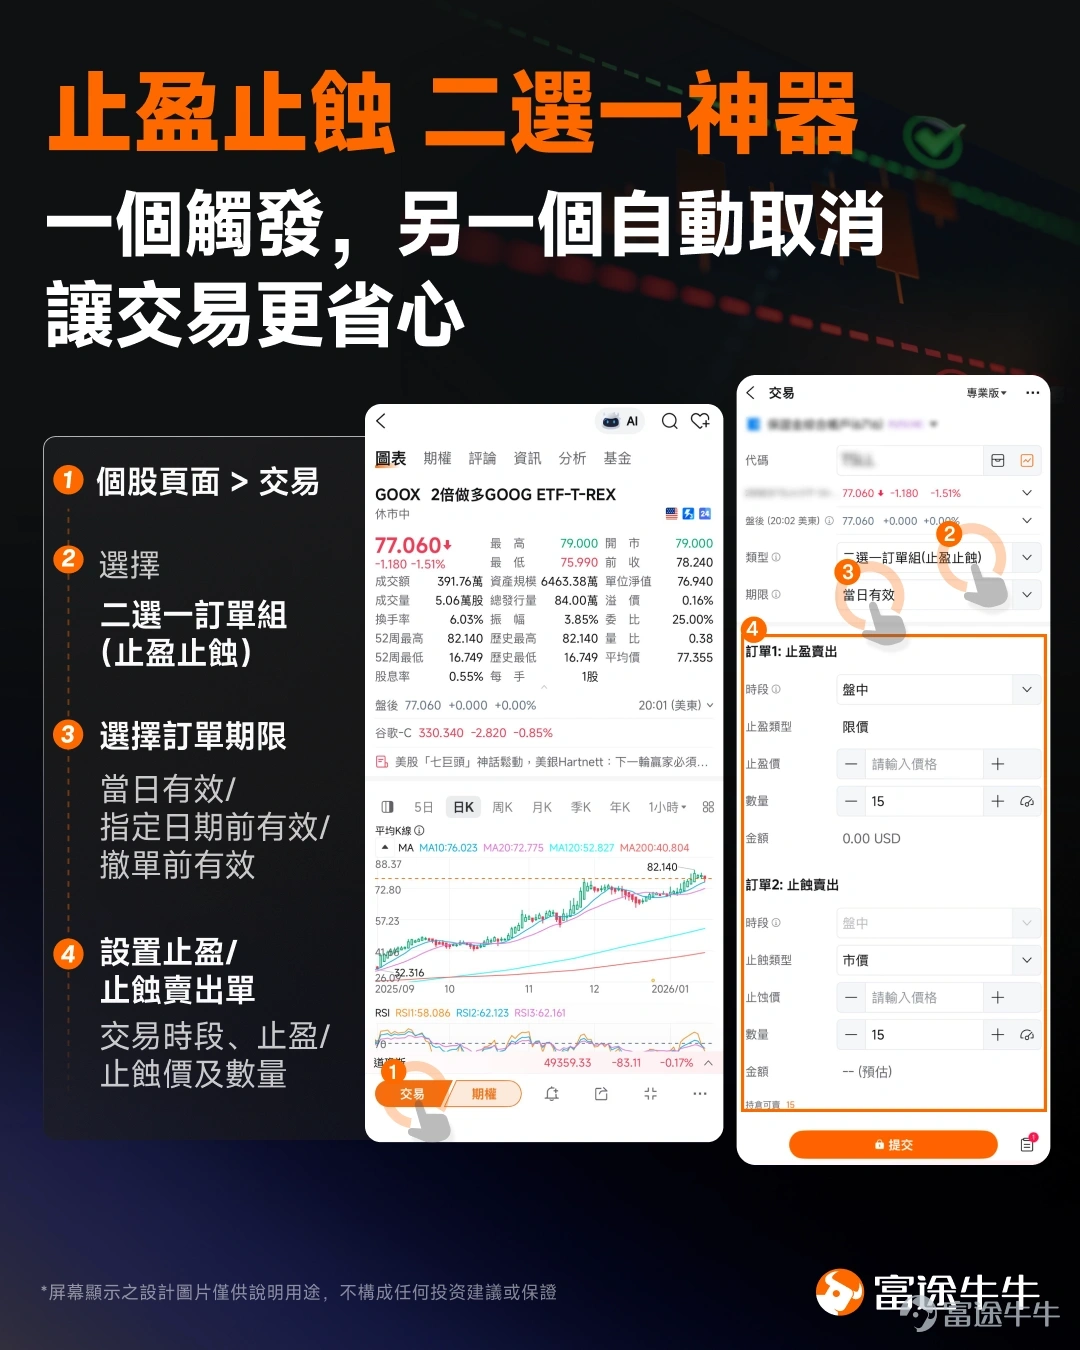
OCO Orders (One-Cancels-the-Other)—Set your target price for automatic selling, and trigger a stop-loss if support breaks!
One trigger cancels the other automatically, making trading more hassle-free
Risk Disclaimer: The above content only represents the author's view. It does not represent any position or investment advice of Futu. Futu makes no representation or warranty.Read more


Comments (2)
to post a comment
13
22