SpaceX's second wave of lock-up expirations is here; how should investors position themselves in spa

SpaceX's short-term uptrend is established; what key points should we watch for next?
US stocks faced broad pressure on Tuesday, $SpaceX (SPCX.US)$ yetit defied the trend to close up 3.73% at $153.47, with its total market capitalization surpassing the $2 trillion mark for the first time in nearly two months.The core driver behind this stock price movement was market anticipation of the Nasdaq 100 index rebalancing for the September quarter. As over 1 billion shares of restricted stock were gradually unlocked, SpaceX's free-float ratio rose to approximately 30%. According to estimates from JPMorgan strategists in their report this week:SpaceX's weight in the Nasdaq 100 is expected to rise to about 1.51%, which will drive passive net buying of approximately $12.4 billion worth of stock by index funds and ETFs tracking the index.However, it is important to note that passive buying represents mechanical and predictable capital inflows; some "smart money" may have already positioned themselves ahead of time. The actual price elasticity upon implementation will depend on the sentiment of active capital at that time. Below, we will analyze SpaceX's current price trend and key technical structures.
Recent stock price movement
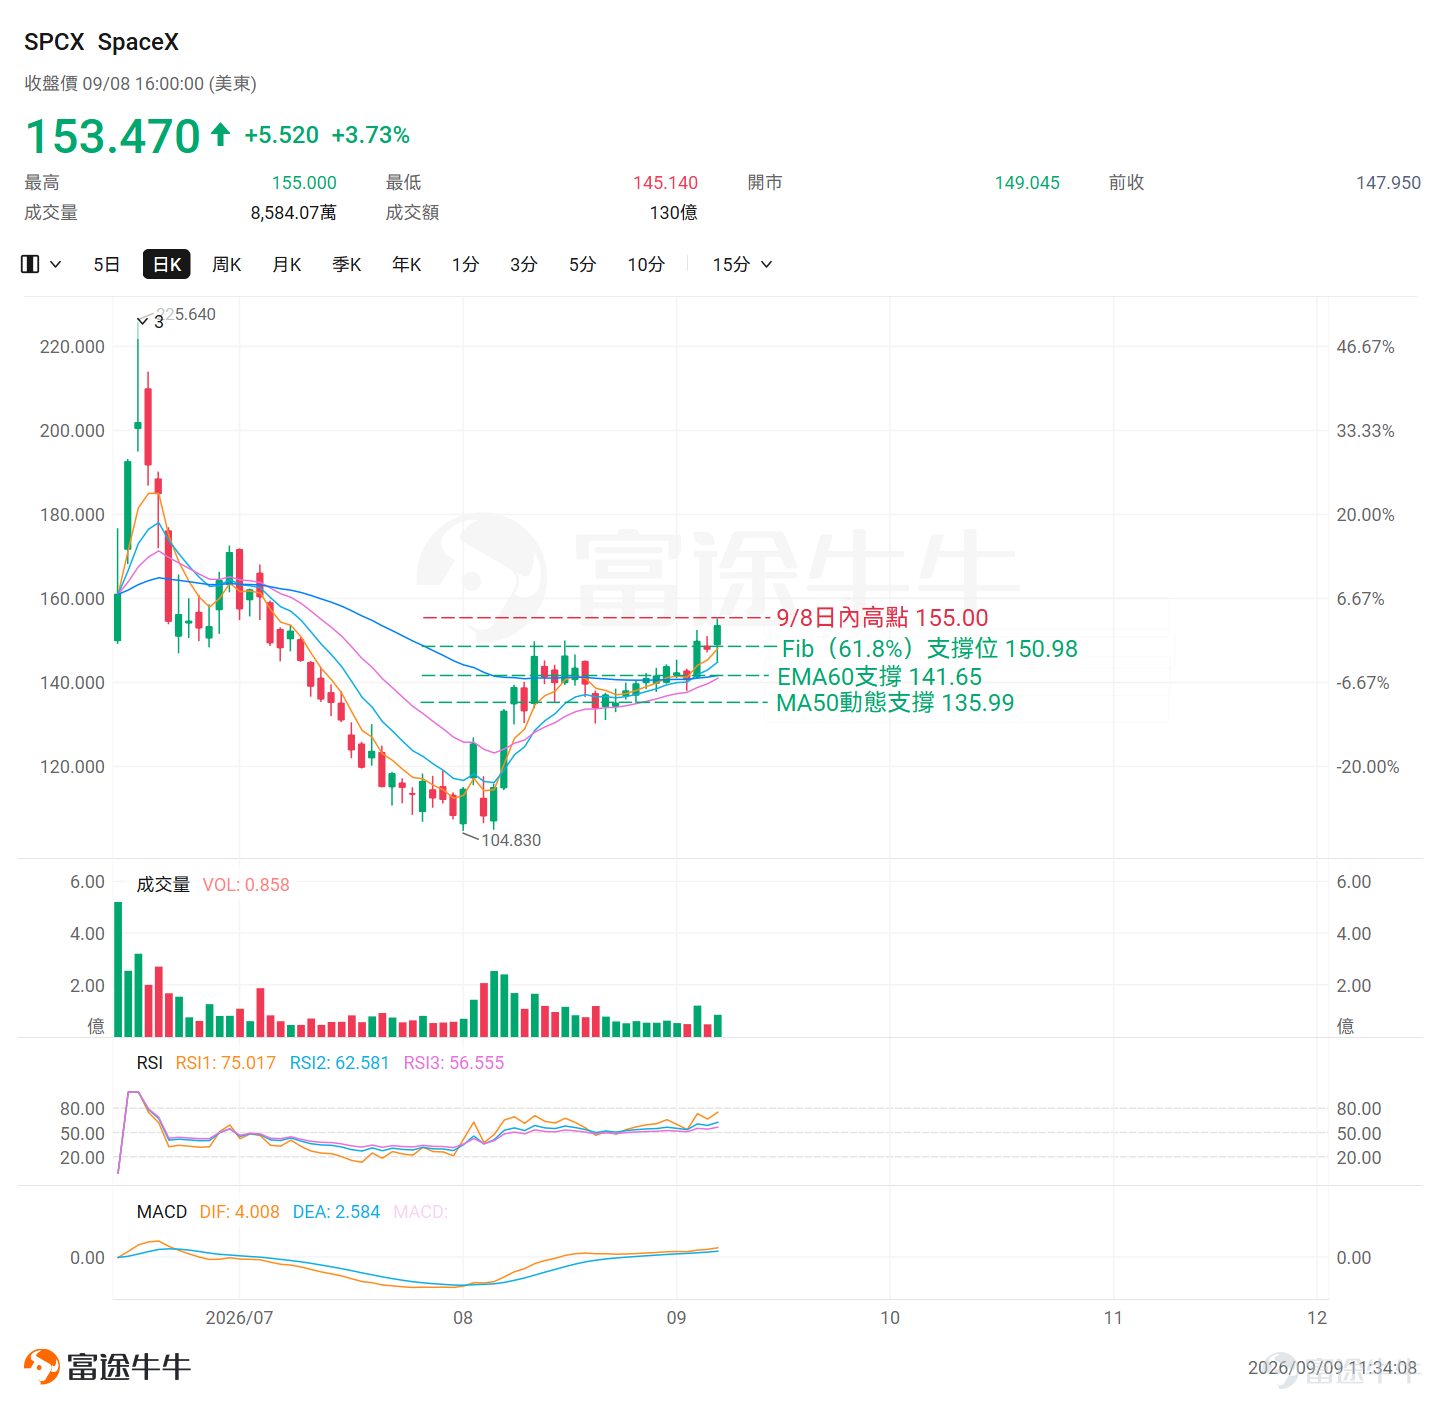
SpaceX currentlymaintains a short-term upward trend, having strongly broken out of the previous consolidation range with an intact structure.Notably, the 60-day EMA has crossed above the 20-day EMA,indicating a bullish bias in short-to-medium-term momentum.
Key Technical Indicator Analysis
EMA Moving Averages:EMA5 stands at $148.07, EMA10 at $144.87, and EMA20 at $140.99. The EMA60 crossing above the EMA20 signals an upgrade in the medium-term structural trend, indicating a healthy moving average structure.
RSI:At 62.58, it is in a neutral-to-strong zone. The RSI has risen in tandem with the stock price over the past 10 days, showing no bearish divergence, indicating that momentum remains intact.
MACD:The MACD line (4.01) is above the Signal line (2.58); the histogram is positive and expanding. The golden cross is maintained above the zero axis, with bullish momentum continuing to strengthen and no divergence observed.
Bollinger Bands:The Bollinger Bands are in an expansion phase. The latest closing price of $153.47 has broken above the upper band, showing strong momentum. However, caution is advised regarding the risk of a reversion to the middle band as the bandwidth narrows after expansion.
Fibonacci:The current stock price of $153.47 lies between the Fibonacci 61.8% level ($150.98) and the Fibonacci 50.0% level ($165.23) —The next target for the stock price is $165.23, with near-term support at $150.98.
* Fibonacci retracement levels are automatically calculated based on the highest and lowest prices over the past 60 trading days, not manually selected swing points. Actual support/resistance effectiveness should be confirmed by market price action
Comprehensive assessment
Regarding key support,$150.98 corresponds to the 61.8% Fibonacci retracement level,The stock price has recently broken through the resistance level effectively, which has now turned into support. If this level fails to hold,then $145.14 (the low of the September 8th lower shadow) serves as a reference for short-term support.If the stock price continues to decline,watch for two strong medium-term support levels: the 60-day EMA at $141.65 and the 50-day MA at $135.99.
On the resistance side,Keep a close eye on the intraday high of $155.00 on September 8;in terms of the medium-term trend,the 50.0% Fibonacci retracement level at $165.23 represents a more distant key medium-term resistance,which can serve as a medium-term target if short-term momentum persists.
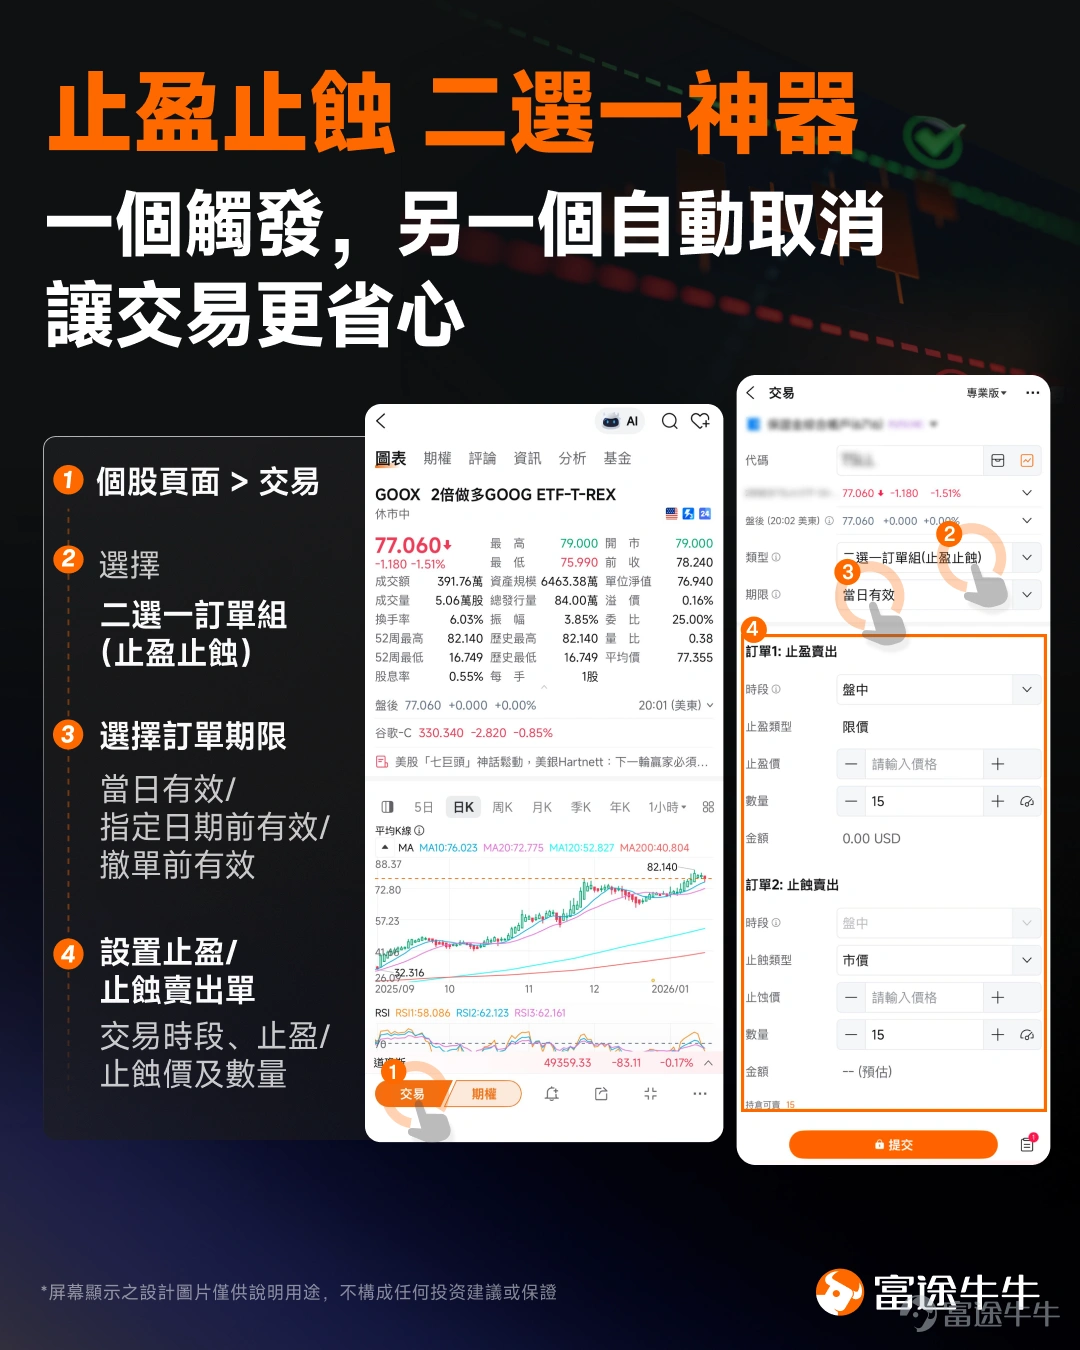
Intraday trading waits for no one; volatility is extreme, and liquidity can vanish in an instant. In such an environment, relying on manual monitoring and emotional decision-making is akin to gambling.OCO Orders (One-Cancels-the-Other)—Set your entry and exit automatically: sell when targets are hit, and stop out if support breaks! One order triggers while the other cancels automatically, making your trading hassle-free.
Risk Disclaimer: The above content only represents the author's view. It does not represent any position or investment advice of Futu. Futu makes no representation or warranty.Read more


Comments (8)
to post a comment
10
24